Ethernet Switch Market Size and Share
Market Overview
| Study Period | 2020 - 2031 |
|---|---|
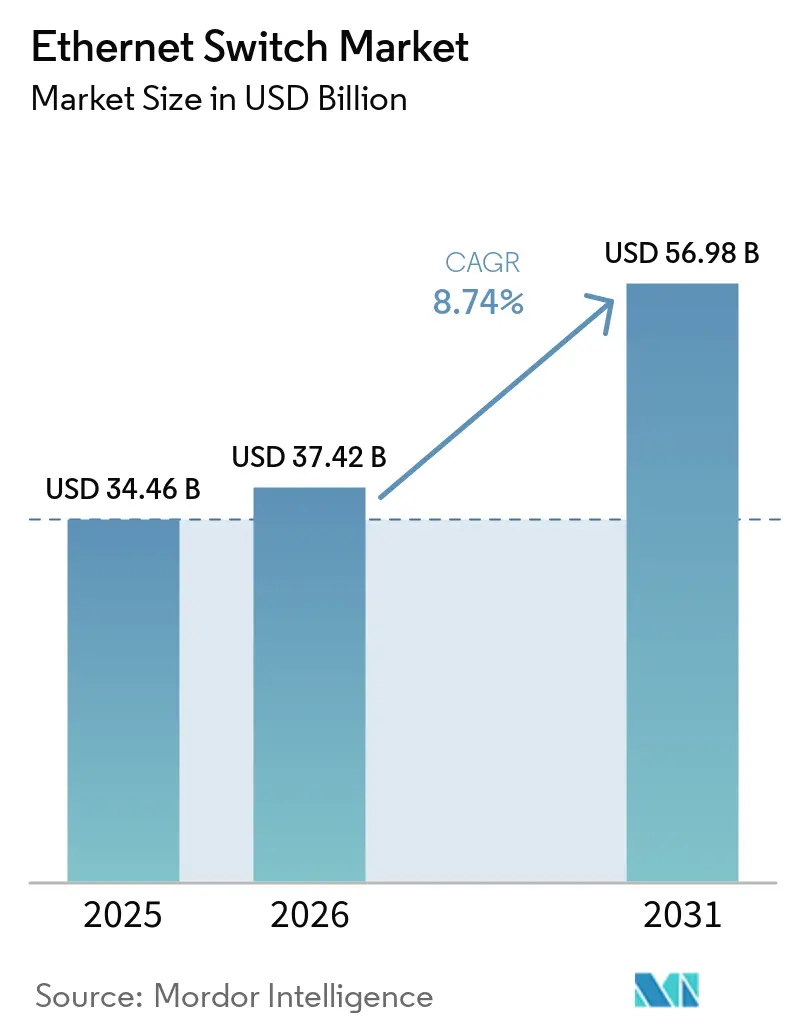
| Market Size (2026) | USD 37.42 Billion |
| Market Size (2031) | USD 56.98 Billion |
| Growth Rate (2026 - 2031) | 8.74% CAGR |
| Fastest Growing Market | Asia-Pacific |
| Largest Market | North America |
| Market Concentration | Medium |
Major Players *Disclaimer: Major Players sorted in no particular order Image © Mordor Intelligence. Reuse requires attribution under CC BY 4.0. | |
Ethernet Switch Market Analysis by Mordor Intelligence
The ethernet switch market size is expected to increase from USD 34.46 billion in 2025 to USD 37.42 billion in 2026 and reach USD 56.98 billion by 2031, growing at a CAGR of 8.74% over 2026-2031. Near-term growth rests on hyperscalers rolling out 400- and 800-gigabit platforms to support artificial intelligence clusters, while enterprise refresh cycles revolve around WiFi 7, power-over-Ethernet upgrades, and consolidated observability. Vendors that marry merchant silicon with open-source software are gaining share, although proprietary operating systems still anchor many campus and service-provider deployments. Capital-expenditure headwinds remain for mid-tier enterprises, yet leasing models and cloud-managed platforms are softening up-front costs. Regionally, the Middle East and Asia-Pacific are outpacing mature markets as sovereign artificial intelligence programs and edge data center builds accelerate port demand.
Key Report Takeaways
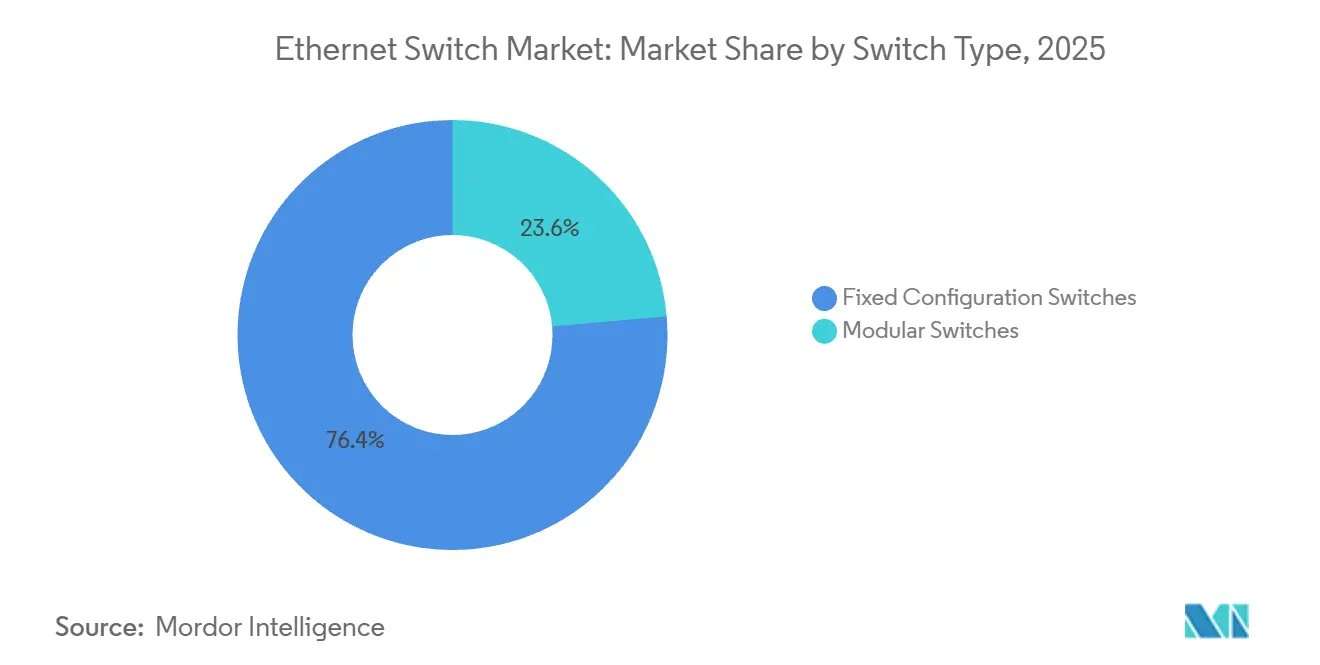
- By switch type, fixed configuration led with 76.38% share of the Ethernet switch market in 2025; modular switches are advancing at a 10.18% CAGR through 2031.
- By port speed, legacy 1 gigabit captured 31.12% of the Ethernet switch market share in 2025, while 400 gigabit and above is projected to grow at a 13.63% CAGR between 2026 and 2031.
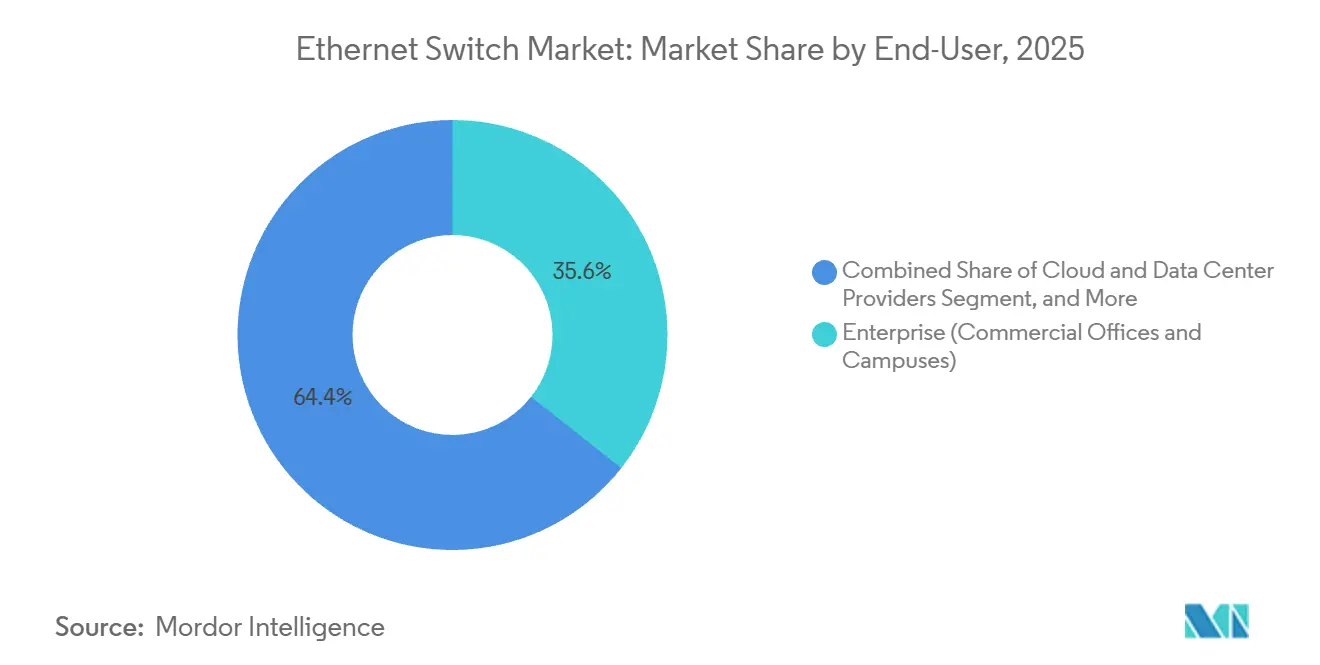
- By end-user, the enterprise segment held a 35.62% revenue share in 2025; cloud and data center providers are expected to exhibit the fastest expansion at a 11.62% CAGR to 2031.
- By management type, fully managed products accounted for 51.26% of the Ethernet switch market size in 2025, and unmanaged units are growing at 9.11% CAGR through 2031.
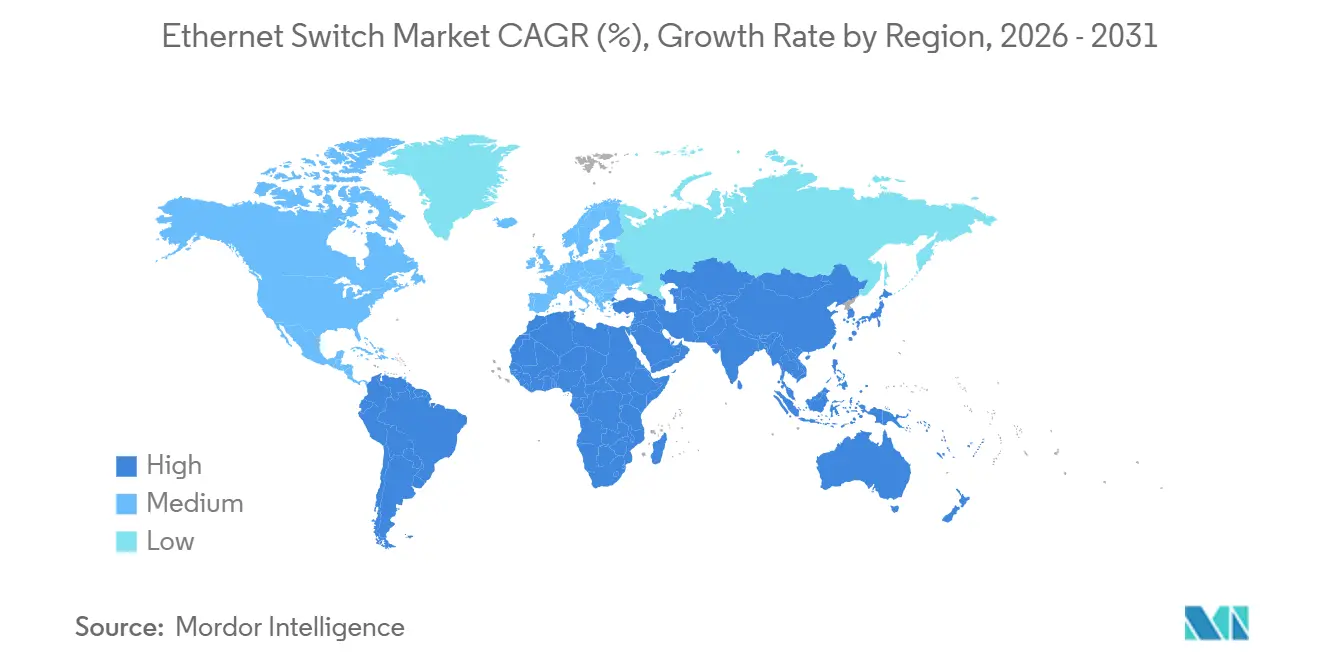
- By geography, North America led with 35.18% revenue share in 2025, whereas Asia-Pacific is tracking a 10.12% CAGR over 2026-2031.
Note: Market size and forecast figures in this report are generated using Mordor Intelligence’s proprietary estimation framework, updated with the latest available data and insights as of January 2026.
Global Ethernet Switch Market Trends and Insights
Drivers Impact Analysis*
| Driver | (~) % Impact on CAGR Forecast | Geographic Relevance | Impact Timeline |
|---|---|---|---|
| Increasing Bandwidth Demand From AI Workloads | +2.80% | Global, with concentration in North America and Middle East | Medium term (2-4 years) |
| Proliferation of Cloud Data Centers | +2.20% | North America and Asia-Pacific core, spillover to Europe and Middle East | Long term (≥ 4 years) |
| Growth of Edge Data Centers in Tier-2 Cities | +1.50% | Asia-Pacific (India, Southeast Asia), Middle East, and Africa | Medium term (2-4 years) |
| Rising Adoption of PoE and IoT-Enabled Devices | +1.30% | Global, with early gains in North America enterprise campuses | Short term (≤ 2 years) |
| Open Ethernet Disaggregation in Hyperscale Networks | +0.90% | North America hyperscale operators, expanding to Europe and Asia-Pacific | Long term (≥ 4 years) |
| Transition to Time-Sensitive Networking in Industry 4.0 | +0.70% | Europe (Germany automotive), Asia-Pacific (Japan, South Korea manufacturing) | Long term (≥ 4 years) |
| Source: Mordor Intelligence | |||
Increasing Bandwidth Demand From AI Workloads
Generative-AI training clusters require low-latency fabrics that legacy 100-gigabit gear cannot satisfy. Meta’s Prometheus supercomputer, online since December 2025, connects GPUs with NVIDIA Spectrum-X switches operating at 800 gigabits per second, illustrating Ethernet’s cost advantage over InfiniBand.[1]Arista Networks, “NVIDIA Spectrum-X Powers Prometheus,” arista.com Oracle Cloud followed in 2025, citing a 1.6-times throughput gain from adaptive routing built into the same platform. Hyperscalers are now aiming for 1:1 oversubscription ratios, effectively doubling the number of ports per rack. NVIDIA locked in USD 2 billion of custom switch ASIC supply from Marvell to guarantee capacity for its DGX SuperPOD architecture. As AI clusters scale past 1 GW of power draw, 800G Ethernet emerges as the default spine-and-leaf choice for new builds.
Proliferation of Cloud Data Centers
Capital expense among hyperscalers continues to surge, with multibillion-dollar campuses breaking ground in every major region. Google’s Virgo AI cluster, unveiled in 2025, chains custom 800 gigabit switches across availability zones to reduce latency between tensor-processing units. Microsoft’s USD 15.2 billion commitment to a 5 GW facility in the United Arab Emirates underscores how liquid cooling enables denser racks, thereby requiring modular chassis capable of aggregating 576 ports of 800 gigabit Ethernet per spine.[2]Microsoft Corporation, “UAE Data-Center Investment,” microsoft.com Open networking stacks such as SONiC are accelerating in these environments; Microsoft, Meta, and LinkedIn submitted more than 1,000 code commits during 2024, trimming feature roll-out cycles.
Growth of Edge Data Centers in Tier-2 Cities
Latency-critical workloads, autonomous vehicles, immersive reality, and real-time analytics are fueling micro-facility builds outside traditional hubs. Yotta Infrastructure and Airtel Nxtra announced sites in Pune, Hyderabad, and Chennai in 2025 to bring compute within 10 milliseconds of end users. Indonesia and Vietnam are attracting hyperscale back-ups as Singapore throttles new power allocations. Saudi Arabia’s 1 GW Humain campus, green-lighted in December 2025, blends hyperscale density with regional proximity, demanding modular lines that scale from 10 to 800 gigabit ports. Vendors that can ship turnkey edge racks with integrated cooling and automated management are widening their funnel among regional carriers.
Rising Adoption of PoE and IoT-Enabled Devices
Power over Ethernet simplifies deployments by delivering data and up to 90 watts of power on a single cable. Cisco estimates 30% in installation savings when facilities eliminate standalone electrical runs for access points. The next-gen IEEE 802.3cz draft, slated for 2026 ratification, raises the ceiling to 100 watts, opening the door for LED lighting and on-desk device charging. As WiFi 7 rolls out, enterprise campuses are standardizing on 2.5 and 5 gigabit uplinks; Juniper’s EX4000 switch family embeds those rates along with AI-driven telemetry for zero-touch operations. Uptake is strongest in the North America education and healthcare segments, where budget cycles align with renovation work.
Restraints Impact Analysis*
| Restraint | (~) % Impact on CAGR Forecast | Geographic Relevance | Impact Timeline |
|---|---|---|---|
| High CapEx for 400G and 800G Upgrades | -1.20% | Global, with acute pressure in Europe and mid-tier enterprises | Short term (≤ 2 years) |
| Semiconductor Supply Chain Disruptions | -0.90% | Global, with bottlenecks in TSMC and Broadcom ASIC production | Short term (≤ 2 years) |
| Alternative Fabrics (NVLink, CXL) Curtailing Port Growth | -0.60% | North America AI clusters, limited spillover to Asia-Pacific | Medium term (2-4 years) |
| Energy-Efficiency Regulations Elevating TCO | -0.40% | Europe (EU Ecodesign), expanding to North America | Long term (≥ 4 years) |
| Source: Mordor Intelligence | |||
High CapEx for 400G and 800G Upgrades
A 64-port 800 gigabit switch lists near USD 200,000, and optics add USD 1,000-3,000 per port, straining budgets outside hyperscale circles. Linear pluggable optics are lowering per-bit cost; Arista’s XPO modules announced in April 2026 deliver 12.8 Tbps each while trimming power budgets. Even so, many European enterprises defer refreshes because the region’s energy-efficiency code pushes operators toward platforms under 100 gigabit per port.[3]European Commission, “Code of Conduct for Data Centres,” ec.europa.eu Consumption-based leasing eases near-term cash flow but ultimately spreads expenses across longer periods.
Semiconductor Supply Chain Disruptions
Switch ASICs rely on 5 nm and 3 nm processes, nodes also coveted by smartphone and AI-accelerator vendors. Broadcom reported 150% year-over-year AI-networking revenue growth in Q4 2024, extending lead times for mainstream enterprise chips to 52 weeks. NVIDIA reserved wafer capacity at Marvell under a USD 2 billion deal in late 2024, illustrating how vertical integration is now a survival strategy. Geopolitical export controls further constrain tooling deliveries to Asia, forcing vendors to dual-source silicon or redesign line cards around smaller-node availability, thereby inflating research and development spending and delaying volume production.
*Our forecasts treat driver/restraint impacts as directional, not additive. The impact forecasts reflect baseline growth, mix effects, and variable interactions.
Segment Analysis
By Switch Type: Modular Scalability Meets Fixed-Port Ubiquity
Fixed configuration units dominated shipments with 76.38% share in 2025, anchoring campus access layers, retail branches, and industrial facilities where port counts hover under 48. Modular chassis, though smaller in footprint, are expanding at a 10.18% CAGR as hyperscalers demand spine fabrics that grow line cards by line card without forklift swaps. Arista’s 7800R4 platform supports 576 800 G ports and delivers 230.4 Tbps of aggregate throughput.[4]Arista Networks, “7800R4 Modular Switch Datasheet,” arista.com Cisco’s Nexus 9800 refresh in December 2025 rivals that ceiling at 115.2 Tbps while layering in real-time telemetry.
The cost-performance trade-off continues to shape buyer choices. Unmanaged fixed switches posting 9.11% CAGR serve IoT rollouts where administrators favor plug-and-play. Smart web-managed tiers bridge small enterprises into VLAN and QoS without the cost of full software-defined networking. Fully managed fixed gear anchors campus cores, integrating with identity-aware policies and segmentation. Modular adoption will remain hyperscale-centric, but mid-market colocation providers are starting to spec chassis to future-proof against unpredictable AI tenant bursts.


By Port Speed: 800 GbE Moves From Niche to Necessity
Legacy 1-gigabit still claimed 31.12% of the Ethernet switch market share in 2025, amid cost-sensitive small offices and industrial sensor fields. At the opposite end, the 400-gigabit-and-above tier is charting a 13.63% CAGR as GPU clusters and analytics pipelines overwhelm older fabrics. Meta recorded 1.6× higher effective throughput when shifting Prometheus from InfiniBand to 800 gigabit Ethernet with adaptive routing.
Multi-gigabit 2.5/5 GbE is bridging the gap to WiFi 7 refreshes, while 10 GbE remains the backbone of mid-sized data centers that cannot yet cost-justify 100 GbE. Buyers are leapfrogging 25/40 GbE straight to 100 GbE, compressing the middle of the curve. Arista’s April 2026 XPO optics slash per-port power draw, enabling 800 GbE in top-of-rack footprints once limited to 100 GbE. These advances will steadily erode the legacy share, though a long tail of industrial endpoints ensures 1 GbE persists well into the next decade.
By End-User: Cloud Momentum Reshapes the Revenue Mix
Enterprise campuses accounted for the largest share of 2025 revenue at 35.62%, supported by enormous installed bases across education, healthcare, and the public sector. Cloud and data-center operators, however, are registering an 11.62% CAGR, fueled by multi-region AI fabrics that swallow millions of high-speed ports. Microsoft’s UAE build, one of the world’s biggest at 5 GW, will rely on tens of thousands of 400 and 800 GbE connections.
Telecom carriers continue to deploy carrier Ethernet gear for 5G X-haul, guided by MEF CE 3.0 performance templates. Government networks emphasize secure, air-gapped deployments certified under stringent frameworks, favoring vendors with hard-to-earn federal accreditations. The cloud segment’s appetite for open networking and merchant silicon is forcing incumbents to open software stacks or risk disintermediation.

By Management Type: Cloud Dashboards Alter Purchasing Criteria
Fully managed platforms delivered 51.26% of value in 2025 thanks to rich policy engines and software-defined overlays. Unmanaged devices are the growth outlier, with a 9.11% CAGR, as factories, warehouses, and smart buildings prefer simplicity. The IEEE 802.1DG automotive Ethernet standard, ratified in 2025, provides sub-millisecond determinism, enabling unmanaged switches in autonomous-vehicle production cells.
Smart web-managed units bridge skills gaps for small businesses through browser-based GUIs. Cloud-managed lines such as Cisco Meraki and Juniper Mist centralize provisioning across hundreds of sites, turning CapEx into subscription bundles. As zero-trust architectures proliferate, fully managed dashboards must interoperate with identity platforms and telemetry lakes, setting a high bar for analytics and AI-driven troubleshooting.
Geography Analysis
North America maintained 35.18% of global revenue in 2025 as hyperscale budgets funneled billions into high-speed fabric rollouts. Meta’s Prometheus deployment, consuming 1 GW and stitched together by 800 GbE Spectrum-X switches, illustrates the region’s technical edge. Canada is emerging as a secondary hub, given Montreal's hydro-powered cost advantages and ample land near Toronto. Enterprise refresh momentum stays steady as organizations migrate to WiFi 7 and explore zero-touch campus architectures. Regulatory scrutiny remains lighter than in Europe, yet forthcoming U.S. Department of Energy guidelines on equipment power draw could shift demand toward lower-wattage silicon over the long term.
Asia-Pacific is the fastest-rising territory, tracking 10.12% CAGR through 2031. Saudi Arabia’s USD 100 billion AI capacity drive includes a 1 GW data-center partnership between STC and Humain, launched in December 2025. The United Arab Emirates tops even that with a 5 GW campus backed by Microsoft that will install tens of thousands of 400 and 800 GbE ports. India’s tier-2 cities witnessed a burst of edge-facility announcements in 2025 from Yotta Infrastructure, CtrlS, and Airtel Nxtra to serve regional e-commerce and government workloads.[5]Yotta Infrastructure, “Tier-2 Expansion Press Release,” yotta.com China’s Huawei and H3C dominate domestic bids, though export controls stunt global reach. Japan and South Korea anchor automotive and semiconductor manufacturing use cases, increasingly adopting time-sensitive networking. Australia and New Zealand favor subscription-managed switches to connect hybrid offices across vast geographies.
Europe confronts tighter energy rules that nudge operators toward 100 GbE rather than 400 GbE for certain workloads. The EU’s Code of Conduct for Data Centers recommends power-usage effectiveness below 1.3, which directly influences switch-selection criteria. Germany is deploying IEEE 802.1DG in automotive lines, while the United Kingdom targets manufacturing robotics latency requirements. Eastern European infrastructure spending remains subdued amid macroeconomic pressures, and Russia’s sanctions-constrained market relies on older architectures. South America reports incremental gains led by Brazilian 5G backhaul projects, whereas Africa is at a nascent stage with Nigeria and South Africa piloting micro-facilities around fintech hubs.

Competitive Landscape
Cisco, Huawei, and Arista constitute the top bracket, yet strategic paths diverge. Cisco’s proprietary IOS-XR keeps it entrenched in campus cores, though hyperscalers lean toward open software and merchant silicon. Arista’s AI-driven revenue surged 150% year over year in Q3 2024 by aligning with Broadcom Jericho3-AI chips and embracing SONiC compatibility. Huawei preserves share across China and parts of Asia-Pacific through price competitiveness, but export restrictions mute its impact elsewhere.
Mergers and alliances are redefining the middle tier. Hewlett Packard Enterprise’s planned USD 14 billion acquisition of Juniper Networks looks to blend Juniper’s AI-centric MistOS with HPE’s edge-to-cloud GreenLake stack. NVIDIA’s Spectrum-X entrance snagged marquee wins at Meta and Oracle by combining adaptive routing with congestion telemetry, making the GPU vendor an unexpected switch contender. Optics innovation is a new battleground; Arista’s XPO linear pluggables garnered support from more than 100 ecosystem partners within weeks of the April 2026 launch.
Open Compute Project contributions are further commoditizing base hardware as hyperscalers donate reference designs and software patches. Metro-scale carriers still value end-to-end support contracts, so proprietary stacks will not disappear quickly. That said, vendors lacking optical roadmaps, energy-efficiency narratives, and deep SONiC expertise face commoditization risk, especially as AI workloads amplify port speeds every hardware generation.
Ethernet Switch Industry Leaders
Cisco Systems, Inc.
Huawei Technologies Co., Ltd.
Arista Networks, Inc.
Dell Technologies Inc.
Hewlett Packard Enterprise Company
- *Disclaimer: Major Players sorted in no particular order

Recent Industry Developments
- April 2026: Arista Networks introduced XPO linear pluggable optics delivering 12.8 Tbps per module, standardizing the interface through a 100-company multi-source agreement.
- December 2025: eta confirmed its 1 GW Prometheus supercomputer uses NVIDIA Spectrum-X 800 GbE switches, signaling a pivot away from InfiniBand.
- December 2025: Arista Networks launched the 7060X6 series with 64 ports of 800 GbE OSFP connectivity for spine and leaf roles.
- December 2025: Saudi Telecom Company and Humain unveiled a 1 GW AI data-center partnership tied to a USD 100 billion sovereign investment program.


Global Ethernet Switch Market Report Scope
The Ethernet Switch Market is the global industry encompassing the design, manufacturing, sales, and deployment of Ethernet switches, specialized networking hardware that connect multiple devices within a local area network (LAN) using Ethernet technology. The market is primarily driven by surging data traffic, cloud adoption, 5G rollout, AI workloads, and the need for scalable, high-performance networking solutions.
The Ethernet Switch Market Report is Segmented by Switch Type (Fixed Configuration Switches, and Modular Switches), Port Speed (1 GbE and Below, 2.5/5 GbE, 10 GbE, 25/40 GbE, 100 GbE, and 400 GbE and Above), End User (Cloud and Data Center Providers, Enterprise (Commercial Offices and Campuses), Telecommunication Service Providers, Government and Defense, and Other End-Users), Management Type (Smart / Web-Managed Switches, Unmanaged Switches, and Fully Managed Switches), and Geography (North America, South America, Europe, Asia-Pacific, Middle East, and Africa). The Market Forecasts are Provided in Terms of Value (USD).
| Fixed Configuration Switches |
| Modular Switches |
| 1 GbE and Below |
| 2.5/5 GbE Multi-Gig |
| 10 GbE |
| 25/40 GbE |
| 100 GbE |
| 400 GbE and Above |
| Cloud and Data Center Providers |
| Enterprise (Commercial Offices and Campuses) |
| Telecommunication Service Providers |
| Government and Defense |
| Other End-Users |
| Smart / Web-Managed Switches |
| Unmanaged Switches |
| Fully Managed Switches |
| North America | United States |
| Canada | |
| Mexico | |
| South America | Brazil |
| Argentina | |
| Rest of South America | |
| Europe | Germany |
| United Kingdom | |
| France | |
| Italy | |
| Spain | |
| Russia | |
| Rest of Europe | |
| Asia-Pacific | China |
| Japan | |
| India | |
| South Korea | |
| Australia and New Zealand | |
| Rest of Asia-Pacific | |
| Middle East | Saudi Arabia |
| United Arab Emirates | |
| Turkey | |
| Rest of Middle East | |
| Africa | South Africa |
| Nigeria | |
| Rest of Africa |
| By Switch Type | Fixed Configuration Switches | |
| Modular Switches | ||
| By Port Speed | 1 GbE and Below | |
| 2.5/5 GbE Multi-Gig | ||
| 10 GbE | ||
| 25/40 GbE | ||
| 100 GbE | ||
| 400 GbE and Above | ||
| By End-User | Cloud and Data Center Providers | |
| Enterprise (Commercial Offices and Campuses) | ||
| Telecommunication Service Providers | ||
| Government and Defense | ||
| Other End-Users | ||
| By Management Type | Smart / Web-Managed Switches | |
| Unmanaged Switches | ||
| Fully Managed Switches | ||
| By Geography | North America | United States |
| Canada | ||
| Mexico | ||
| South America | Brazil | |
| Argentina | ||
| Rest of South America | ||
| Europe | Germany | |
| United Kingdom | ||
| France | ||
| Italy | ||
| Spain | ||
| Russia | ||
| Rest of Europe | ||
| Asia-Pacific | China | |
| Japan | ||
| India | ||
| South Korea | ||
| Australia and New Zealand | ||
| Rest of Asia-Pacific | ||
| Middle East | Saudi Arabia | |
| United Arab Emirates | ||
| Turkey | ||
| Rest of Middle East | ||
| Africa | South Africa | |
| Nigeria | ||
| Rest of Africa | ||


Key Questions Answered in the Report
What is the projected value of the ethernet switch market in 2031?
The ethernet switch market size is forecast to reach USD 56.98 billion by 2031, expanding at an 8.74% CAGR from 2026 to 2031, according to Mordor Intelligence.
Which switch type commands the largest revenue share today?
Fixed configuration units led with 76.38% share of the ethernet switch market in 2025, largely due to enterprise and edge deployments.
Which port-speed segment is growing the fastest?
The 400 gigabit and above tier is registering a 13.63% CAGR through 2031 as AI clusters and hyperscale cores demand bandwidth beyond 100 gigabit.
Why are modular chassis switches gaining traction?
Hyperscalers favor modular chassis because they can scale up to 576 ports of 800 gigabit ethernet without replacing the entire frame, reducing long-term capital expense.
How will energy-efficiency rules affect European buyers?
EU policies encouraging power-usage-effectiveness below 1.3 are steering many operators toward lower-wattage 100 gigabit platforms or delaying 400 gigabit upgrades.
Page last updated on:


