Power Over Ethernet (PoE) ++ Switch Market Size and Share
Market Overview
| Study Period | 2020 - 2031 |
|---|---|
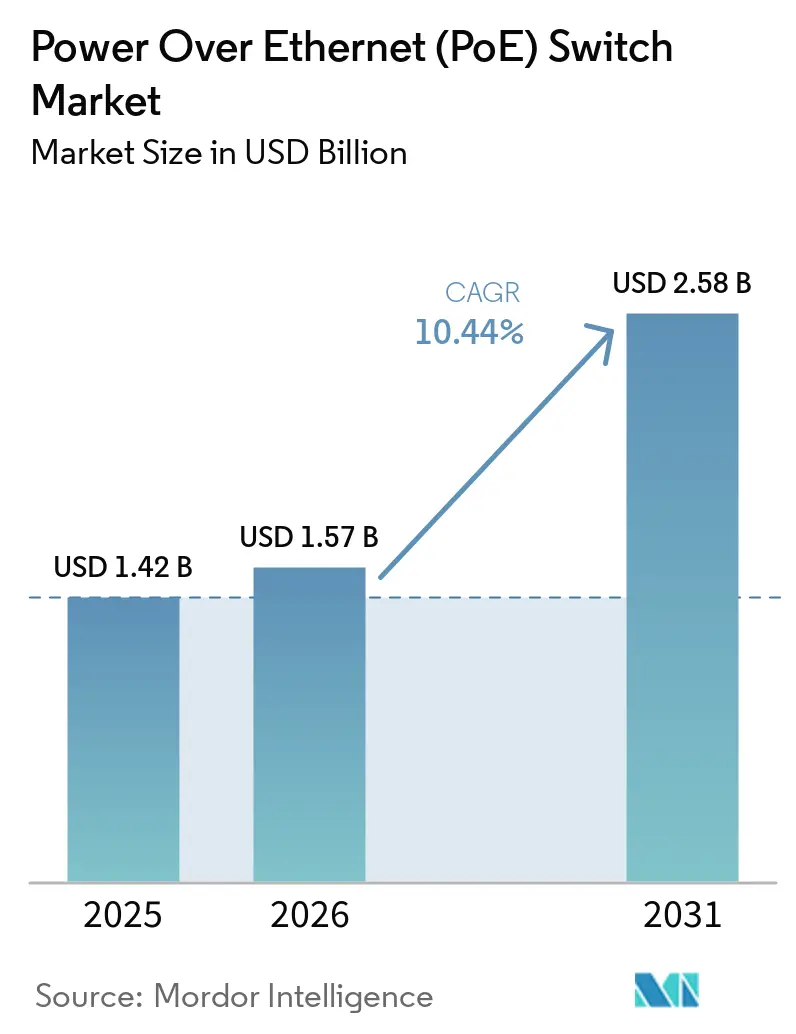
| Market Size (2026) | USD 1.57 Billion |
| Market Size (2031) | USD 2.58 Billion |
| Growth Rate (2026 - 2031) | 10.44% CAGR |
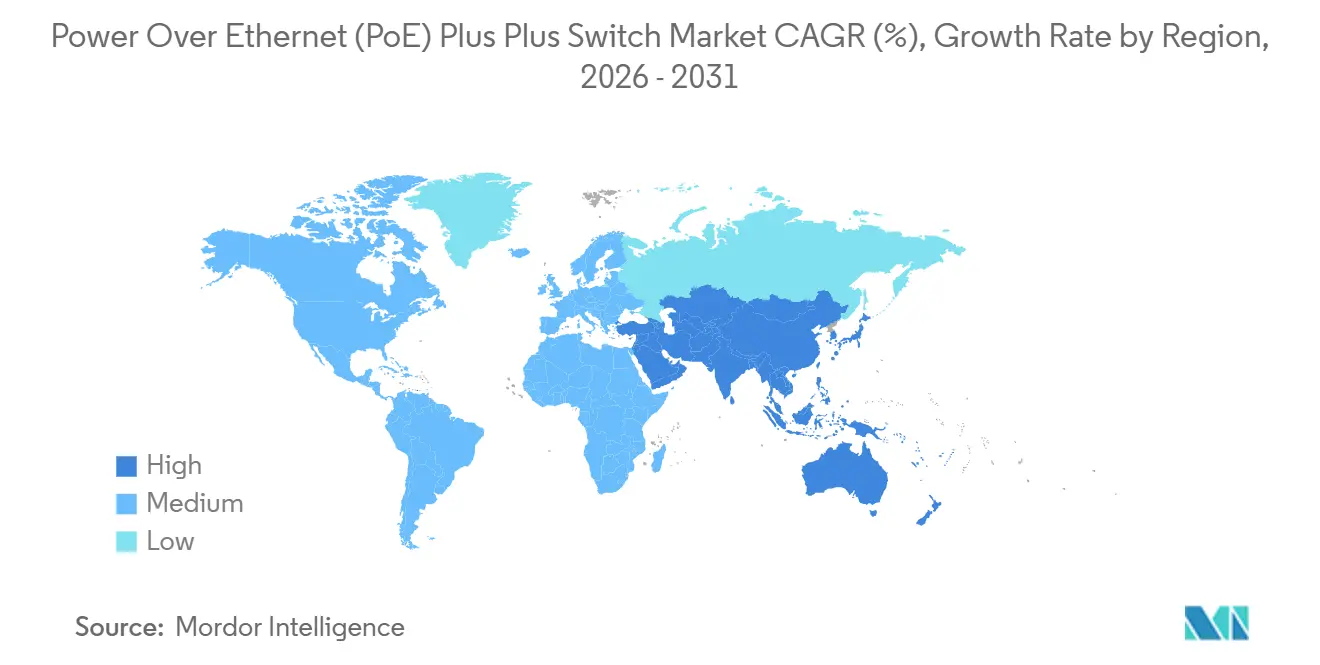
| Fastest Growing Market | Asia-Pacific |
| Largest Market | North America |
| Market Concentration | Medium |
Major Players *Disclaimer: Major Players sorted in no particular order Image © Mordor Intelligence. Reuse requires attribution under CC BY 4.0. | |
Power Over Ethernet (PoE) ++ Switch Market Analysis by Mordor Intelligence
The Power over Ethernet (PoE) ++ switch market size is projected to expand from USD 1.42 billion in 2025 and USD 1.57 billion in 2026 to USD 2.58 billion by 2031, registering a CAGR of 10.44% over 2026-2031. The Power over Ethernet (PoE) ++ switch market is moving beyond basic switch upgrades and into a wider access-layer redesign, because IT traffic and operational systems are increasingly sharing the same copper network. Demand is being pushed from the endpoint side, as newer Wi-Fi radios, AI-enabled PTZ cameras, edge-compute nodes, and smart-lighting fixtures now require materially higher wattage than older PoE deployments supported. North America remains the largest regional base because managed enterprise deployments are already deep, while Asia-Pacific is set to grow faster on the back of public digital infrastructure and smart-building spending, and Europe continues to benefit from energy-efficiency regulation tied to building retrofits. Vendors are now competing less on simple port counts and more on power density, AI-native telemetry, and cloud-based energy management, as buyers increasingly want switching platforms that support sustainability reporting and operational visibility. The main limit on faster adoption is still the higher thermal burden and system cost of 90 W designs, especially when buyers also need Cat 6a or Cat 7 cabling upgrades and larger power budgets in the closet.
Key Report Takeaways
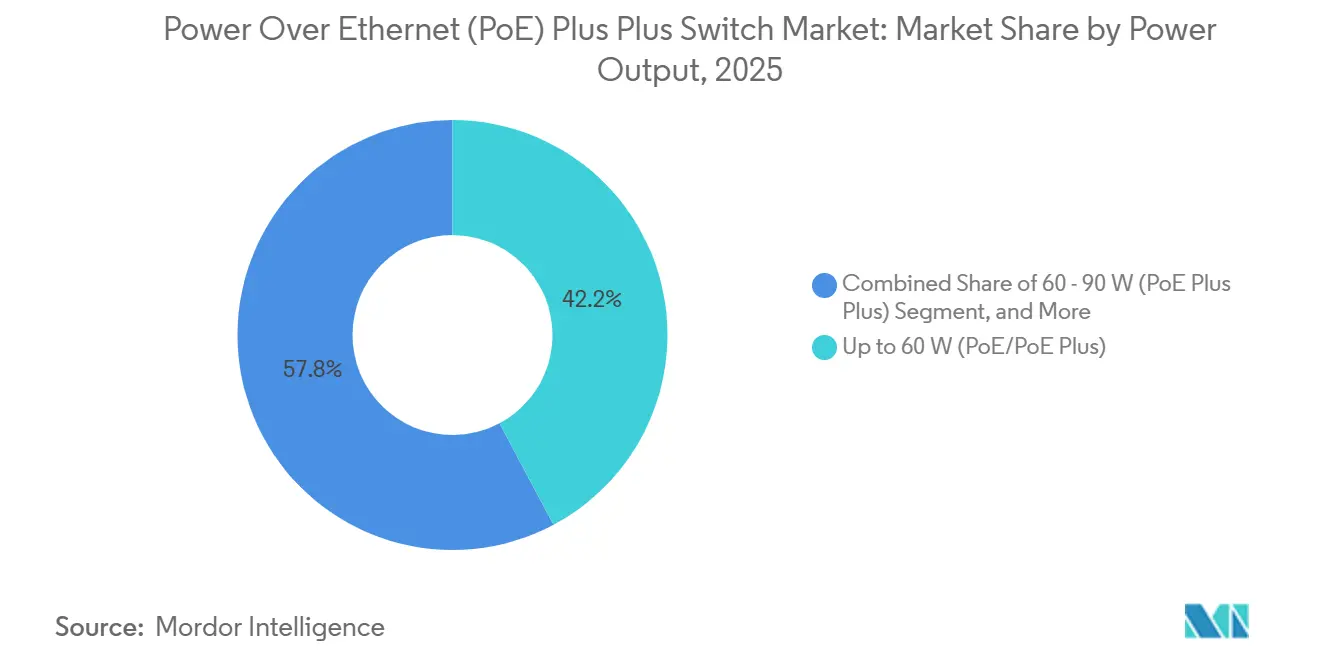
- By power output in the Power over Ethernet (PoE) ++ switch market, 60 W held 42.2% share in 2025, while 60-90 W is projected to expand at an 18.4% CAGR through 2031.
- By switch type, Fully Managed Layer 2 led with 46.1% revenue share in 2025, while Fully Managed Layer 3 is forecast to grow at an 18.2% CAGR through 2031.
- By port density, 17-24 ports accounted for 41.1% share in 2025, while above 48 ports are expected to advance at a 14.5% CAGR through 2031.
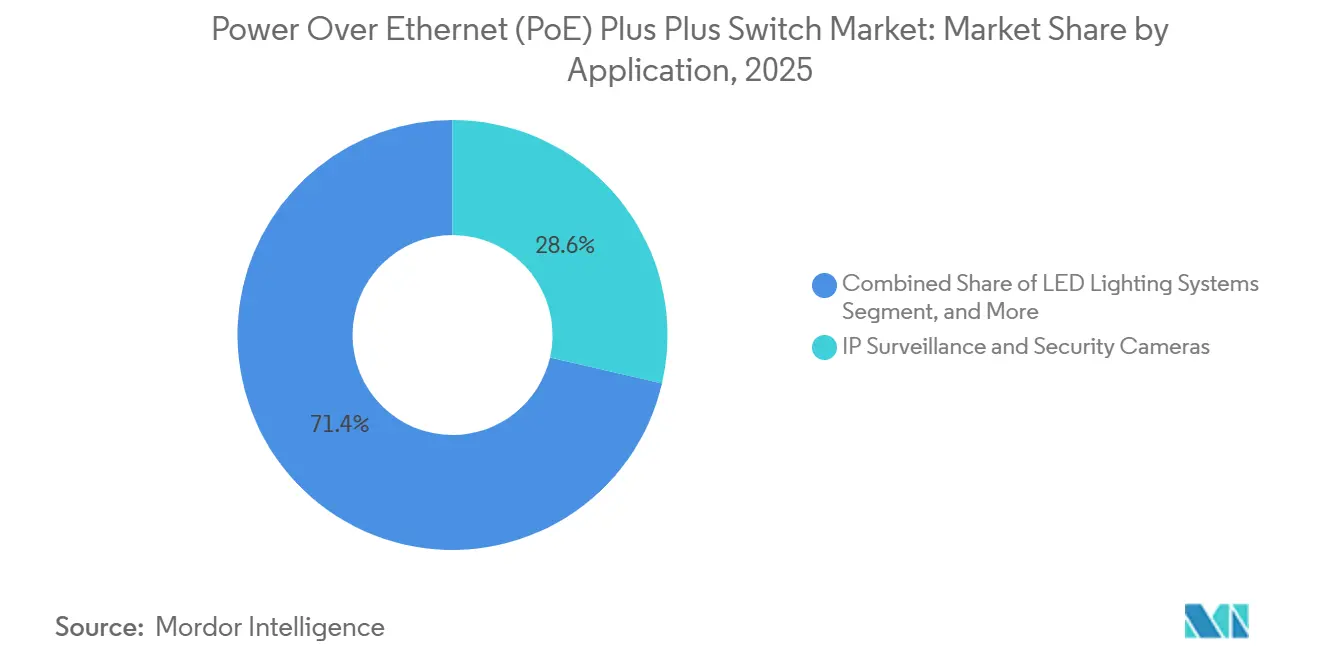
- By application, IP surveillance cameras and security systems represented 28.6% share in 2025, while LED lighting and building automation are projected to grow at a 17.3% CAGR through 2031.
- By end-user industry, commercial, enterprise, and hospitality captured 47.2% share in 2025, while government, defense, and smart cities are expected to record a 16.6% CAGR through 2031.
- By geography, North America held 37.1% share in 2025, while the Asia-Pacific is projected to expand at a 12.9% CAGR through 2031.
Note: Market size and forecast figures in this report are generated using Mordor Intelligence’s proprietary estimation framework, updated with the latest available data and insights as of January 2026.
Global Power Over Ethernet (PoE) ++ Switch Market Trends and Insights
Drivers Impact Analysis*
| DRIVER | (~) % IMPACT ON CAGR FORECAST | GEOGRAPHIC RELEVANCE | IMPACT TIMELINE |
|---|---|---|---|
| Proliferation of IoT Endpoints and IP Surveillance Cameras | +3.2% | Global, with highest density in North America, APAC core, and Western Europe | Short term (≤ 2 years) |
| Wi-Fi 6/6E Access-point Roll-outs Requiring 60 W or More Per Port | +2.8% | Global, early concentrations in North America and East Asia enterprise campuses | Short term (≤ 2 years) |
| Smart-building Retrofits Adopting PoE-powered LED Lighting | +1.9% | North America and EU, with spill-over to Gulf Cooperation Council and APAC | Medium term (2-4 years) |
| Energy-efficiency Regulations Favoring Remote Power Monitoring | +1.4% | EU, North America, and East Asia, emerging in South America | Medium term (2-4 years) |
| Edge-AI Cameras With Heaters and Pan-tilt Heads Above 60 W | +1.1% | APAC and North America smart-city deployments, with expansion to Middle East and Africa | Medium term (2-4 years) |
| ESG-driven Copper-cable Reduction Targets in Enterprise Networks | +0.8% | Global enterprise networks, led by North America and Northern Europe | Long term (≥ 4 years) |
| Source: Mordor Intelligence | |||
Proliferation of IoT Endpoints and IP Surveillance Cameras
The growth of connected endpoints remains the clearest demand driver for the Power over Ethernet (PoE) ++ switch market, as every new camera, access point, sensor cluster, or smart-lighting node adds to the load on the access layer. Computer-vision cameras stand out in this mix because newer PTZ systems combine analytics, infrared illumination, and motion features that require much more power than older 1080p devices. Axis states that the Q6358-LE can draw up to 51 W, placing it firmly in the range where 802.3bt-capable source equipment is required for full operation.[1]IEEE, “IEEE 802.3bt Standard,” IEEE, ieee.org When surveillance operators replace installed cameras without replacing older switching gear, they often find that the bottleneck is not optics or bandwidth, but port-level power availability. That shifts refresh timing in practical ways, because the camera project starts first, but the switch upgrade follows immediately once the power gap becomes visible. In many building deployments, the camera cycle is therefore becoming the event that brings forward broader hardware spending in the Power over Ethernet (PoE) ++ switch market.
Wi-Fi 6/6E Access-Point Roll-Outs Requiring 60 W or More per Port
New Wi-Fi 6E and Wi-Fi 7 access points are raising baseline power expectations in the Power over Ethernet (PoE) ++ switch market, because they lose features when deployed on older 802.3af or 802.3at infrastructure. Cisco documentation for the Catalyst 9166 series shows that IEEE 802.3bt UPOE supports full tri-radio operation, a 5 Gbps Multigigabit port, and USB IoT output, while lower-power modes reduce capability. HPE Aruba guidance similarly positions 802.3bt Class 6 as the practical baseline for new Wi-Fi 6E deployments, which makes higher-power switching relevant even before buyers move into Wi-Fi 7 refresh cycles. Cisco and Juniper also document that Wi-Fi 7 platforms such as the CW9178I and AP47 require Type 4 delivery for full dual-4x4 multi-link operation, which pulls power design into the earliest stages of campus planning. A 48-port platform running 90 W per port can support a 4,320 W PoE budget, shifting closet-level planning from a typical access switch decision to a broader facility power decision. That is why wireless refresh cycles are now creating one of the strongest near-term upgrade paths for the Power over Ethernet (PoE) ++ switch market.
Smart-Building Retrofits Adopting PoE-Powered LED Lighting
PoE lighting is moving into mainstream commercial retrofit planning in the Power over Ethernet (PoE) ++ switch market, especially where owners want one network to support lighting, occupancy sensing, and building controls. Lantronix notes that organizations using PoE LED systems can achieve 30-50% energy reductions compared with conventional LED installations when lighting is paired with occupancy sensing, daylight harvesting, and scheduling controls. The same Ethernet link also serves as a data path for environmental sensors and HVAC coordination, giving facilities teams a stronger reason to treat lighting as part of the digital building stack rather than a separate electrical system. In cities such as New York, Local Law 97 turns energy visibility into a compliance requirement, making managed lighting networks more attractive than isolated subsystems. Retrofit work often exposes older Cat 5e or early Cat 6 cabling, creating a practical split between projects that can stay within 60 W delivery and those that can justify broader recabling for 90 W. That is one reason 60 W designs continue to fit many retrofit cases well, while new construction is better placed to support the upper end of the power curve in the market.
Energy-Efficiency Regulations Favoring Remote Power Monitoring
Energy policy is becoming a direct technology driver in the Power over Ethernet (PoE) ++ switch market, because building owners increasingly need device-level or port-level data rather than high-level utility readings alone. The EU Energy Efficiency Directive set a legally binding target of a 11.7% reduction in final energy consumption by 2030, which underscores the value of platforms that can document actual power use within facilities. Commission Delegated Regulation (EU) 2024/1364 also requires data centers with at least 500 kW of installed IT power to report annual energy performance indicators, underscoring the importance of granular measurement across supporting infrastructure. Cisco's IOS XE 26.1.1 now logs PoE consumption in 15-minute intervals, which lets operators feed reporting systems without adding separate hardware meters at each endpoint cluster. This has practical budget consequences, because money once reserved for building energy systems can now support access-switch upgrades when telemetry is part of compliance. Government facilities, hospitals, and listed companies are therefore treating telemetry as a core buying criterion alongside port density and throughput in the Power over Ethernet (PoE) ++ switch market.
Restraints Impact Analysis*
| RESTRAINT | (~) % IMPACT ON CAGR FORECAST | GEOGRAPHIC RELEVANCE | IMPACT TIMELINE |
|---|---|---|---|
| Higher BOM Cost and Thermal Design Challenges for 802.3bt 90 W Switches | -1.8% | Global, most acute in SMB and mid-market segments across APAC and South America | Medium term (2-4 years) |
| Legacy Cat 5e/Cat 6 Cabling Length and Gauge Limitations | -1.2% | Global brownfield stock, the highest constraint in North America and Europe, building inventory pre-2010 | Long term (≥ 4 years) |
| Emerging USB-C Power-delivery-over-IP Alternatives | -0.7% | North America and Western Europe, led by hyperscaler-adjacent deployments | Long term (≥ 4 years) |
| Supply-chain Tightness for High-efficiency DC-DC Converter ICs | -0.5% | Global, concentrated risk in the Taiwan and South Korea semiconductor supply chain | Short term (≤ 2 years) |
| Source: Mordor Intelligence | |||
Higher BOM and Thermal Design Burden for 802.3bt Switches
A Type 4 switch is a more complex product than an older 802.3at platform, and that complexity continues to slow some upgrades in the Power over Ethernet (PoE) ++ switch market. Running simultaneous power and data over all 4 cable pairs at 90 W per port requires efficient DC-DC conversion, precision detection circuitry, stronger heat management, and larger internal power design. Cisco's C9350-48HX illustrates the scale of that requirement, because full-density 90 W delivery depends on three hot-swappable 1,600 W Titanium-rated power supplies and StackPower+ support.[2]Cisco Systems, “Cisco C9350 Smart Switch Materials,” Cisco, cisco.com For SMB and mid-enterprise buyers, the cost of power supplies, cabling upgrades, and cooling adjustments can raise total deployment cost to 2-3 times that of a comparable 802.3at setup. That gap keeps a large part of the installed base in the PoE+ tier, especially in projects where wireless or camera demand has not yet crossed the threshold that forces higher wattage. The restraint is strongest outside large North American enterprise programs, where buyers are less willing to absorb a single-cycle jump in both hardware and infrastructure cost.
Legacy Cabling Length and Gauge Limitations
Installed copper remains one of the most practical limits on adoption in the Power over Ethernet (PoE) ++ switch market, especially across older commercial buildings. Type 4 delivery across 100-meter runs generally works best with Cat 6a cabling and 23 AWG or larger conductors, because those combinations better control voltage drop and heat. Older Cat 5e at 24 AWG introduces higher resistive loss and greater thermal stress in bundled cable runs, which increases the chance that installations must be de-rated. In real projects, that means a building wired in 2005 may not support full 90 W service to ceiling-mounted devices unless the owner accepts lower delivered power or replaces cabling. This shifts retrofit economics in a material way, because recabling can consume more budget than the switch purchase itself. It also helps explain why the 60-90 W tier is moving faster than the next step up in brownfield projects, where the wiring base still shapes the adoption curve.
*Our forecasts treat driver/restraint impacts as directional, not additive. The impact forecasts reflect baseline growth, mix effects, and variable interactions.
Segment Analysis
By Power Output: PoE++ 60-90 W Momentum Reshapes the Power Budget
Up to 60 W retained 42.2% of the Power over Ethernet (PoE) ++ switch market size in 2025, because the installed base of VoIP phones, basic wireless access points, and older IP cameras still renews on legacy power classes. That large base gives the lower-wattage tier durability even as device requirements move upward, since many branch and floor-level refreshes still favor continuity and lower upfront cost. The 60-90 W segment is the fastest-growing tier in the Power over Ethernet (PoE) ++ switch market, with an 18.4% CAGR projected from 2026 to 2031. That growth is tied directly to Wi-Fi 6E and Wi-Fi 7 radios, AI-enabled PTZ cameras, and other endpoints that need Class 6 or Class 8 delivery for full features. The above 90 W category remains early in volume terms, but Cisco's UPOE+ path and the power profiles of newer multiradio platforms show that the upper boundary is already being tested in select deployments.
The Power over Ethernet (PoE) ++ switch market is also being shaped by edge-compute convergence, because the switch is no longer only a power source and transport layer. Cisco's C9350 platform brings a quad-core x86 CPU and 16 GB DDR5 memory into the access layer so that third-party containers can run on the switch while it also supplies high-wattage PoE to endpoint clusters. That shifts planning assumptions, since switch heat output and closet power availability begin to look closer to small edge-server environments than traditional access closets. In Europe, reporting and energy-monitoring obligations further favor managed 802.3bt platforms, because unmanaged alternatives cannot support the same level of per-port visibility needed in regulated settings.


By Switch Type: Managed Layer 3 Gains Ground as Campus Fabrics Mature
Fully Managed Layer 2 accounted for 46.1% of the Power over Ethernet (PoE++) switch market share in 2025, reflecting how much of the enterprise installed base still depends on VLAN-based policy and Layer 2 intelligence at the access edge. This segment remains large because many branch offices, campus floors, and standard commercial deployments still prioritize operational familiarity over architectural change. Unmanaged and Smart or Hybrid Managed products continue to serve the SMB and mid-market base, where lower upfront cost and simple deployment still matter more than broad automation features. Fully Managed Layer 3 is the fastest-growing switch type in the Power over Ethernet (PoE) ++ switch market, at an 18.2% CAGR from 2026 to 2031. The main reason is the move toward EVPN-VXLAN campus fabrics, where routing and policy enforcement at the access layer help separate IT and IoT traffic without sending flows back through higher-tier devices.
Juniper's February 2025 EX4000 launch is a clear example of this direction, because it pairs 802.3bt PoE++, Mist AI telemetry, Virtual Chassis stacking, and fast boot times for modern access deployments.[3]Juniper Networks, “EX4000 Switch Series,” Juniper Networks, juniper.net Another point of change is zero-trust enforcement at the port, which is becoming more important as building systems and user traffic share the same network edge. Fortinet positions its FortiSwitch line with FortiGate integration through FortiLink, allowing dynamic NAC policy and device profiling without the need for a separate appliance layer. That lifts the role of the Power over Ethernet (PoE++) switch industry beyond simple connectivity and makes switching a more central control point in government, healthcare, and other regulated deployments.
By Port Density: Above-48-Port Configurations Anchor the High-Power Buildout
The 17-24 port bracket represented 41.1% of the Power over Ethernet (PoE) ++ switch market size in 2025, which reflects how well that format fits SMB, branch, and single-floor environments. A single switch in this band is often enough to support a practical mix of wired users, wireless access points, and cameras without forcing stacking or larger closet design. The smaller 5-8 and 9-16 port categories continue to address retail, hospitality, and compact branch use cases where point-of-sale devices, entry cameras, and a few APs must be supported at the lowest possible system cost. At the other end, above 48 ports is the fastest-growing density tier in the Power over Ethernet (PoE) ++ switch market, with a 14.5% CAGR expected from 2026 to 2031. Smart-city programs, hyperscale campuses, and large public sites are driving this shift by increasingly centralizing cameras, access points, and environmental sensors within larger distribution spaces.
High-density platforms now offer a combination of power and throughput that was previously associated mainly with chassis systems. Cisco's C9350-48HX supports 4,320 W of simultaneous PoE output, while Ruckus Networks' ICX 8200-48ZP2 offers a 1,480 W PoE budget and stacks up to 12 switches. The 25-48 port tier remains the common format for mid-enterprise headquarters floors, while compact 9-16 port systems are still gaining share in distributed locations with tight space and power conditions. ANSI/TIA TSB-184-A thermal rules are also making procurement teams examine bundled cable conditions more closely before approving full-density 90 W rollouts in the Power over Ethernet (PoE) ++ switch market.
By Application: LED Lighting and Building Automation Outpaces Legacy Verticals
IP surveillance cameras and security systems anchored the application mix with a 28.6% share in 2025, and that base remained strong because urban security mandates and AI-enabled PTZ replacement cycles continue to sustain camera spending. Wireless access points and WLAN infrastructure remained the second-largest application set, as enterprises kept modernizing campus access around Wi-Fi 6E and the early Wi-Fi 7 cycle. VoIP and unified communication devices still matter, but their share has been easing because softphone adoption reduces the installed volume of traditional handsets. Even so, dedicated room systems and video-collaboration endpoints keep that category relevant in selected enterprise settings. IoT gateways and edge devices are smaller today, but they are becoming more visible in the Power over Ethernet (PoE) ++ switch market as enterprises place local processing close to surveillance and building systems.
LED lighting and building automation is the fastest-growing application, and it is expected to expand at a 17.3% CAGR through 2031 in the Power over Ethernet (PoE) ++ switch market. Lantronix reports that converging power and data through PoE can cut copper usage by more than 50% and reduce total energy consumption by 35-40% when connected to intelligent energy management systems. Cisco's PENN1 deployment in New York showed how one Ethernet backbone can support PoE LED lighting, HVAC, window shades, and environmental monitoring in one coordinated system. Signify's Philips PoE Connected Lighting portfolio is also targeting commercial projects that want LEED and WELL alignment through digitally managed lighting networks, which gives this use case one of the strongest structural growth paths in the Power over Ethernet (PoE) ++ switch industry.
By End-User Industry: Government and Smart Cities Accelerate Ahead of Commercial Baseline
Commercial, enterprise, and hospitality remained the largest end-user grouping with a 47.2% share in 2025, since large campuses continued refresh programs tied to new wireless generations and structured building upgrades. This base stays important because office and hospitality operators usually carry a mix of surveillance, wireless, meeting-room equipment, and basic automation that maps well to managed PoE deployments. Industrial and manufacturing demand is also rising in the Power over Ethernet (PoE) ++ switch market, especially where DIN-rail form factors, wide temperature tolerances, and protocol compatibility matter on factory floors. Residential remains a small niche, while healthcare and education continue to add stable volume through hospital surveillance upgrades and campus Wi-Fi densification. Government, defense, and smart cities are the fastest-growing end-user clusters, with a 16.6% CAGR projected from 2026 to 2031.
Public-sector deployments help explain that pace because the work often covers offices, public safety, connectivity, and building systems simultaneously. Beijing's multi-agency smart-building effort across more than 100 government office buildings illustrates how IoT, cloud, AI, and BIM are being combined across large public estates. South Korea's Chungnam Provincial Office of Education deployed 282 PoE switches and 606 Wi-Fi 6E and 7 access points across school buildings in December 2025 under guidance tied to the national school Wi-Fi program. Defense buyers add another layer of demand because they increasingly ask for TAA alignment, post-quantum readiness, and FIPS 140-3 support on connected equipment, which keeps public-sector demand among the most active pools in the Power over Ethernet (PoE) ++ switch market.
Geography Analysis
North America held 37.1% of the Power over Ethernet (PoE) ++ switch market share in 2025, and it remained the largest regional base because enterprise campuses and government facilities already have deep managed-switch penetration. The United States supported this lead through federal smart-building modernization programs and continued demand for higher-performance campus access networks.[4]General Services Administration, “Federal Building Technology and Modernization Programs,” GSA, gsa.gov Canada added demand through managed services expansion and healthcare IT upgrades, which supported steady purchasing across institutional environments. Mexico contributed incremental volume from industrial zone builds and hospitality projects, where new properties can install higher-grade cabling and managed access networks from the outset. Sustainability compliance is also becoming a stronger buying factor in this region, because large facilities increasingly want managed PoE switches that can provide energy telemetry rather than only transport and power.
Asia-Pacific is the fastest-growing regional block in the Power over Ethernet (PoE) ++ switch market, and it is forecast to expand at a 12.9% CAGR through 2031. China is the main growth engine because smart-city, transportation, public security, and building automation projects are all adding demand for higher-power access-layer equipment. The Ministry of Industry and Information Technology set a target of more than 10 billion IoT device connections by 2028 and a core IoT industry size above CNY 3.5 trillion, equal to USD 486 billion at the 2025 IRS average exchange rate retained in the input, which reinforces the scale of downstream infrastructure demand. In March 2026, Sinopec's Tianjin subsidiary issued procurement for PoE-based lighting and video monitoring terminals, showing that industrial buyers are also joining the regional adoption curve. India and Japan broaden the picture, because India's digitalization and smart-city programs support Ethernet-led access networks while Japan adds higher-value factory automation use cases tied to robotic guidance and edge-AI cameras.
Europe kept a steady position in the Power over Ethernet (PoE) ++ switch market, because the policy framework for zero-emission new construction and lower primary energy use in existing non-residential buildings continues to support retrofit activity. Germany, the United Kingdom, and France remain the core premium smart-building markets, while Russia's separation from Western supply chains is shifting procurement patterns toward domestic and Chinese suppliers. South America is smaller in absolute value, but Brazil and Argentina are still seeing project-led uptake in São Paulo and Buenos Aires where international tenants increasingly specify LEED-aligned PoE infrastructure. Middle East and Africa remains the smallest regional block by volume, yet Gulf projects under Saudi Vision 2030 and UAE digital-city programs are creating above-average demand for surveillance and building-automation networks that favor higher-wattage PoE switching.

Competitive Landscape
The Power over Ethernet (PoE) ++ switch market is moderately concentrated at the premium end, but it remains fragmented across the mid-tier and value-oriented ranges where many suppliers compete on price, management model, and deployment simplicity. Cisco Systems, Huawei Technologies, and Hewlett Packard Enterprise Aruba hold the leading revenue positions because they combine switching hardware with broad software environments that help them keep enterprise accounts over longer refresh cycles. Cisco Catalyst Center, Huawei CloudCampus, and HPE Aruba Central strengthen that position by connecting switching to analytics, orchestration, and recurring software layers that are harder for customers to unwind later.[5]Hewlett Packard Enterprise, “Aruba Central and Campus Switching Portfolio,” HPE Aruba Networking, hpe.com Juniper, Ubiquiti, and Extreme Networks are responding with a different value proposition, centered on AI-native cloud management, open integration, and lower cost-per-port in the parts of the Power over Ethernet (PoE) ++ switch market where buyers remain price aware. Juniper's EX4000 launch in February 2025 was a direct example of that strategy, combining 60 W PoE++, Mist AI telemetry, and fast boot performance to challenge older campus access designs.
Competition is also moving toward software-defined energy visibility and security control. Cisco's IOS XE 26.1.1 release in May 2026 added 15-minute PoE energy telemetry, which gives buyers a practical tool for ESG reporting and more granular power management across endpoint groups. Fortinet is pushing a converged model in which FortiSwitch works with FortiGate through FortiLink, allowing access control and device profiling inside one operational stack rather than through a separate NAC layer. Cisco's post-quantum-ready C9350 positioning also matters in long-lifecycle public-sector bids, because government and defense buyers are placing more weight on future cryptographic resilience.
White space remains in industrial PoE++, tenant-level power metering for multi-tenant buildings, and high-density outdoor PoE++ systems with IP67 or IP68 protection. Belden's Hirschmann, Antaira Technologies, Red Lion Controls, and Planet Technology remain visible in those narrower segments where environmental hardening and niche form factors matter more than global brand scale. Ruckus Networks and other international vendors also compete where buyers want multigigabit throughput, stacking, and high power density without stepping up to chassis architecture. The competitive picture in the Power over Ethernet (PoE) ++ switch market therefore favors vendors that can balance power density, policy enforcement, and energy reporting while keeping total deployment cost within reach of buyers still comparing these systems against lower-cost PoE+ alternatives.
Power Over Ethernet (PoE) ++ Switch Industry Leaders
Cisco Systems, Inc.
Hewlett Packard Enterprise (Aruba)
Huawei Technologies
Netgear, Inc.
TP-Link Technologies
- *Disclaimer: Major Players sorted in no particular order

Recent Industry Developments
- April 2026: Huawei Technologies launched its Xinghe AI Fabric 2.0 solution alongside over 10 new CloudEngine series data center switches at the Huawei Network Summit 2026 in Cairo, targeting Northern Africa enterprise and public-sector AI infrastructure with data-center-to-campus PoE continuity.
- April 2026: Cisco Systems released IOS XE 26.1.1, the first Extended Maintenance Release under its new annual naming scheme, introducing new C9350 multigigabit UPOE+ SKUs for Q2 CY2026 with industry-leading 1.6 Tbps stacking bandwidth and granular 15-minute PoE energy telemetry for ESG reporting, extending its position in Wi-Fi 7 and IoT-dense access deployments.
- November 2025: Cisco Systems introduced the C9350 Smart Switch, delivering simultaneous 90 W UPOE+ on all 48 ports with three hot-swappable 1,600 W Titanium-rated power supplies and StackPower+ dynamic pooling, positioning it as the reference platform for Wi-Fi 7, high-density camera, and edge-AI deployments in enterprise campuses.
- May 2025: Hewlett Packard Enterprise (Aruba) announced the CX 10040 distributed services switch and new CX 6300M campus switches with Gen7 ASICs offering up to 1,760 Gbps system switching capacity, Class 8 PoE, 90 W per port, and integrated AI insights via Aruba Central, along with new Wi-Fi 7 access points in the 720, 740, and 760 Series.


Global Power Over Ethernet (PoE) ++ Switch Market Report Scope
A Power over Ethernet (PoE) ++ switch is a type of network switch designed to transmit data while supplying higher electrical power, ranging from 60 to 100 watts per port, through Ethernet cables. This functionality makes it well-suited for powering advanced devices such as Wi-Fi 6/7 access points, PTZ cameras, smart TVs, and small computers.
The Power Over Ethernet (PoE) ++ Switch Market Report is Segmented By Power Output, Up to 60 W, 60-90 W, and Above 90 W), Switch Type (Unmanaged, Smart/Hybrid Managed, Fully Managed Layer 2, and Fully Managed Layer 3), Port Density (5-8 Ports, 9-16 Ports, 17-24 Ports, 25-48 Ports, and Above 48 Ports), Application (IP Surveillance and Security Cameras, Wireless Access Points and WLAN Infrastructure, VoIP and Unified Communication Devices, LED Lighting Systems, Building Automation and Smart Controls, and IoT Gateways and Edge Computing Devices), End-user Industry (Commercial and Enterprise, Industrial and Manufacturing, Government, Defense, and Smart Cities, Residential, and Healthcare and Education), and Geography (North America, South America, Europe, Asia-Pacific, and Middle East and Africa). The Market Forecasts are Provided in Terms of Value (USD).
| Up to 60 W (PoE/PoE+) |
| 60 - 90 W (PoE++) |
| Above 90 W (next-gen high-power) |
| Unmanaged |
| Smart/Hybrid Managed |
| Fully Managed Layer 2 |
| Fully Managed Layer 3 |
| 5-8 Ports |
| 9-16 Ports |
| 17-24 Ports |
| 25-48 Ports |
| Above 48 Ports |
| IP Surveillance and Security Cameras |
| Wireless Access Points and WLAN Infrastructure |
| VoIP and Unified Communication Devices |
| LED Lighting Systems |
| Building Automation and Smart Controls |
| IoT Gateways and Edge Computing Devices |
| Commercial, and Enterprise |
| Industrial and Manufacturing |
| Government, Defense, and Smart Cities |
| Residential |
| Healthcare and Education |
| Other End-User Industries |
| North America | United States | |
| Canada | ||
| Mexico | ||
| South America | Brazil | |
| Argentina | ||
| Rest of South America | ||
| Europe | Germany | |
| United Kingdom | ||
| France | ||
| Italy | ||
| Spain | ||
| Russia | ||
| Rest of Europe | ||
| Asia-Pacific | China | |
| Japan | ||
| India | ||
| South Korea | ||
| ASEAN | ||
| Oceania | ||
| Rest of Asia-Pacific | ||
| Middle East and Africa | Middle East | Saudi Arabia |
| United Arab Emirates | ||
| Turkey | ||
| Rest of the Middle East | ||
| Africa | South Africa | |
| Nigeria | ||
| Rest of Africa | ||
| By Power Output | Up to 60 W (PoE/PoE+) | ||
| 60 - 90 W (PoE++) | |||
| Above 90 W (next-gen high-power) | |||
| By Switch Type | Unmanaged | ||
| Smart/Hybrid Managed | |||
| Fully Managed Layer 2 | |||
| Fully Managed Layer 3 | |||
| By Port Density | 5-8 Ports | ||
| 9-16 Ports | |||
| 17-24 Ports | |||
| 25-48 Ports | |||
| Above 48 Ports | |||
| By Application | IP Surveillance and Security Cameras | ||
| Wireless Access Points and WLAN Infrastructure | |||
| VoIP and Unified Communication Devices | |||
| LED Lighting Systems | |||
| Building Automation and Smart Controls | |||
| IoT Gateways and Edge Computing Devices | |||
| By End-User Industry | Commercial, and Enterprise | ||
| Industrial and Manufacturing | |||
| Government, Defense, and Smart Cities | |||
| Residential | |||
| Healthcare and Education | |||
| Other End-User Industries | |||
| By Geography | North America | United States | |
| Canada | |||
| Mexico | |||
| South America | Brazil | ||
| Argentina | |||
| Rest of South America | |||
| Europe | Germany | ||
| United Kingdom | |||
| France | |||
| Italy | |||
| Spain | |||
| Russia | |||
| Rest of Europe | |||
| Asia-Pacific | China | ||
| Japan | |||
| India | |||
| South Korea | |||
| ASEAN | |||
| Oceania | |||
| Rest of Asia-Pacific | |||
| Middle East and Africa | Middle East | Saudi Arabia | |
| United Arab Emirates | |||
| Turkey | |||
| Rest of the Middle East | |||
| Africa | South Africa | ||
| Nigeria | |||
| Rest of Africa | |||


Key Questions Answered in the Report
What is the size of the Power over Ethernet (PoE) ++ switch market in 2026 and where is it forecast to reach by 2031?
The Power over Ethernet (PoE) ++ switch market stood at USD 1.57 billion in 2026 and is forecast to reach USD 2.58 billion by 2031, growing at a 10.44% CAGR.
Which region leads revenue and which region is expanding the fastest?
North America led with 37.1% share in 2025, while Asia-Pacific is projected to grow the fastest at a 12.9% CAGR through 2031.
Why are higher-wattage PoE switches gaining traction now?
Wi-Fi 6E and Wi-Fi 7 access points, AI-enabled PTZ cameras, and building systems now need more power per port, which is pushing buyers toward 60-90 W and above.
Which application area is growing the fastest?
LED lighting and building automation is the fastest-growing application, with a projected 17.3% CAGR from 2026 to 2031.
What is slowing wider 90 W adoption?
The biggest limits are higher bill-of-materials cost, thermal design burden, and legacy cabling that often cannot support full 90 W delivery without upgrades.
Which buyer group is showing the strongest momentum?
Government, defense, and smart cities is the fastest-growing end-user group, with a 16.6% CAGR through 2031, supported by public digital infrastructure and smart-building programs.
Page last updated on:


