Data Center Switch Market Size and Share
Market Overview
| Study Period | 2020 - 2031 |
|---|---|
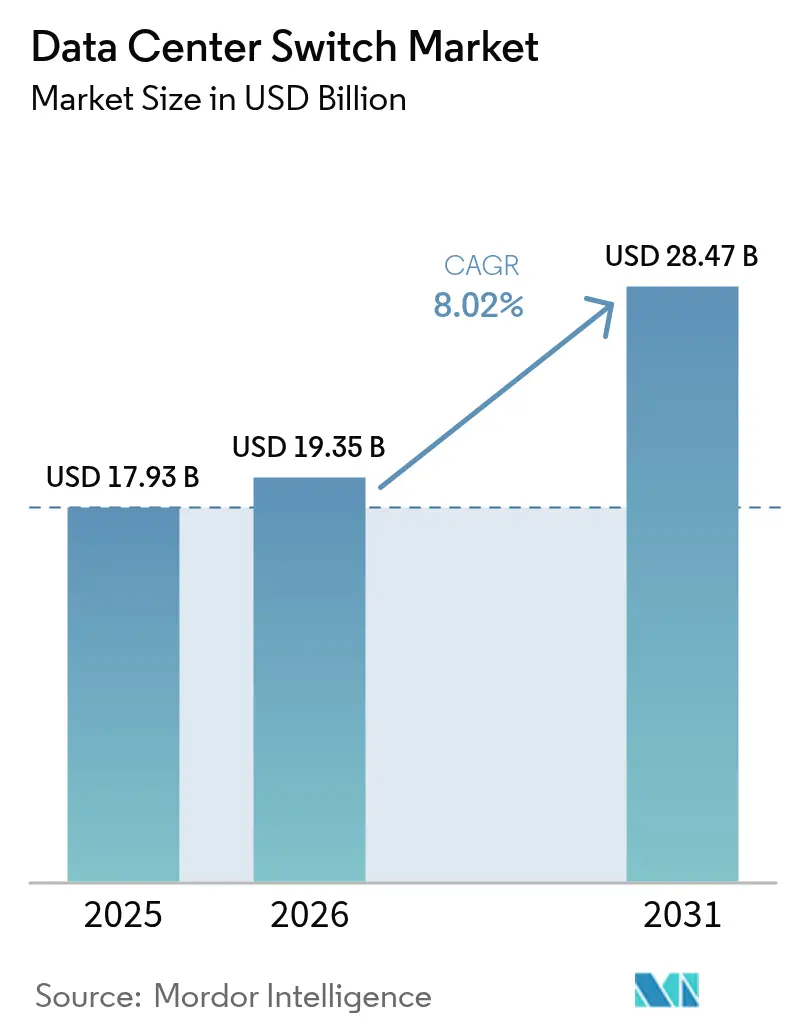
| Market Size (2026) | USD 19.35 Billion |
| Market Size (2031) | USD 28.47 Billion |
| Growth Rate (2026 - 2031) | 8.02% CAGR |
| Fastest Growing Market | Asia Pacific |
| Largest Market | North America |
| Market Concentration | Medium |
Major Players *Disclaimer: Major Players sorted in no particular order Image © Mordor Intelligence. Reuse requires attribution under CC BY 4.0. | |
Data Center Switch Market Analysis by Mordor Intelligence
The data center switch market size is expected to grow from USD 17.93 billion in 2025 to USD 19.35 billion in 2026 and is forecast to reach USD 28.47 billion by 2031 at 8.02% CAGR over 2026-2031. Strong demand stems from AI-centric computing clusters, sovereign-cloud buildouts that replicate infrastructure across borders, and the falling port-per-gigabit cost of 800 GbE optics. Operators are refreshing five-year-old 25-100 GbE fabrics with 400 GbE and 800 GbE platforms to eliminate training-time penalties in large language model workloads, while liquid-cooling-ready chassis unlock port densities that previously exceeded thermal envelopes. Semiconductor lead-times that stretch to 52 weeks have forced hyperscalers to pre-book ASIC capacity 18 months in advance, tightening supply for enterprise buyers. At the same time, mandates on data residency and emerging edge-compute use-cases are fragmenting traffic patterns, driving adoption of disaggregated, white-box switches and intent-based automation to contain operational overhead.
Key Report Takeaways
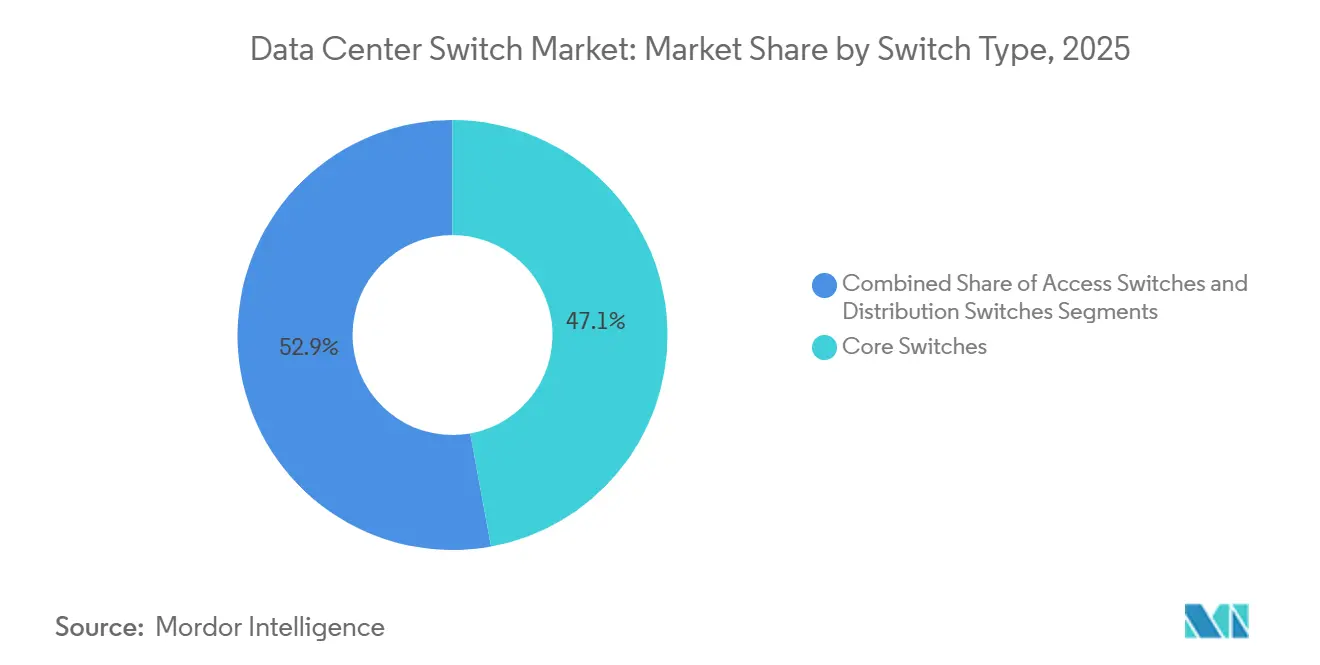
- By switch type, core switches held 47.14% of share in 2025, whereas access switches are projected to grow at a 9.43% CAGR through 2031.
- By bandwidth class, the 25-100 GbE segment accounted for 38.17% of the market share in 2025, while 800 GbE and beyond is forecast to post the fastest 9.32% CAGR during 2026-2031.
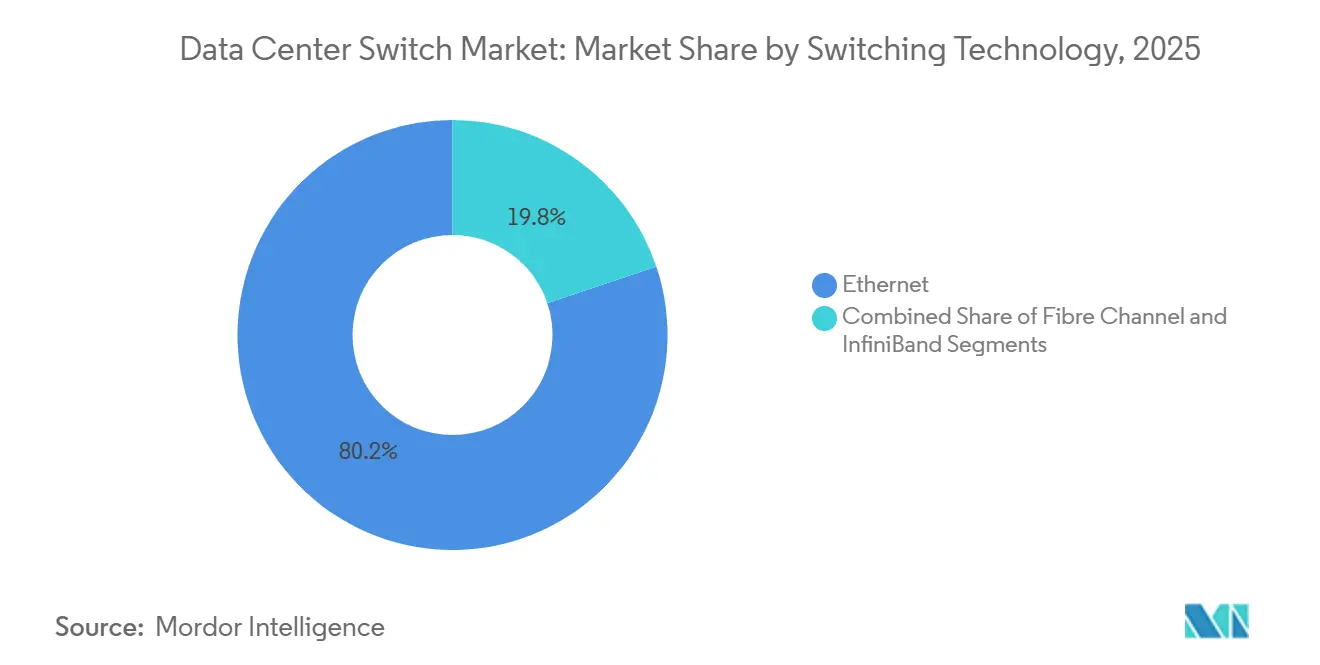
- By switching technology, Ethernet dominated with 80.16% market share in 2025 and is expected to grow at a 9.11% CAGR through 2031, whereas InfiniBand remains the smallest share contributor.
- By tier classification, tier 3 facilities captured 51.86% of the share in 2025, yet tier 4 sites are set to register the strongest 9.29% CAGR through 2031.
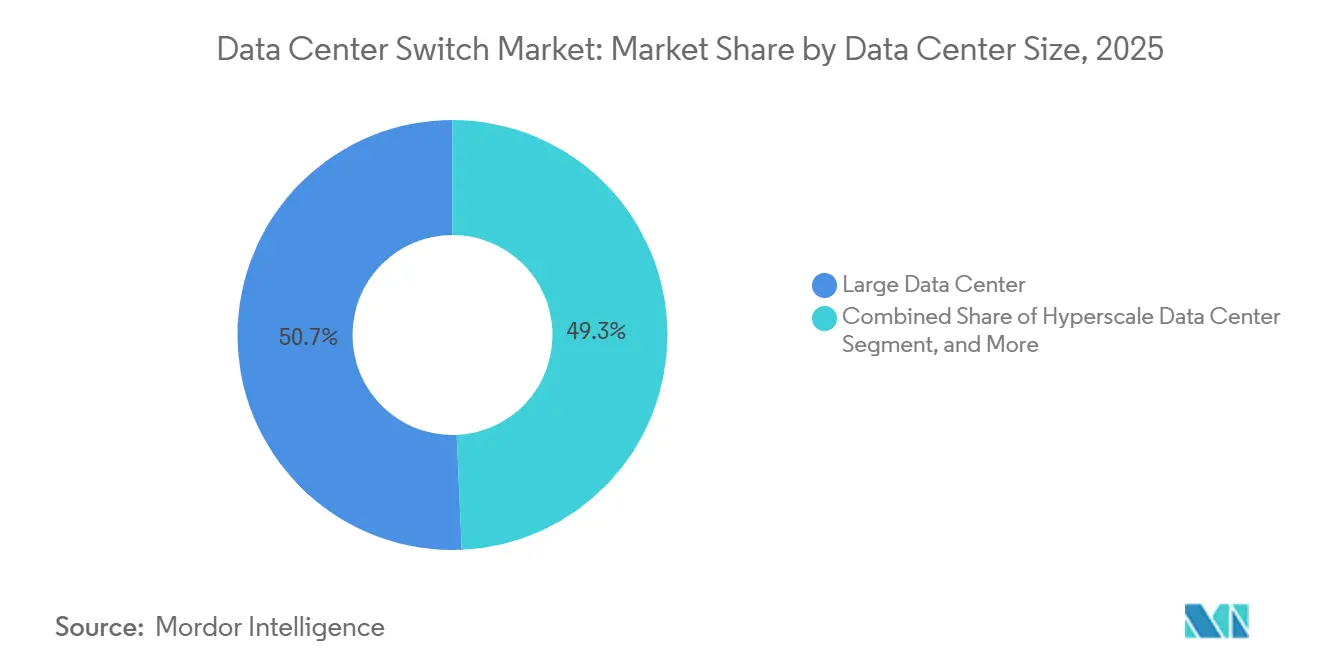
- By data-center size, large facilities represented 50.68% of the share in 2025, but hyperscale campuses are projected to record a 9.81% CAGR, the quickest among all size categories.
- By operator type, colocation providers generated 53.38% of share in 2025, although hyperscalers and cloud service providers are forecast to expand at a 9.72% CAGR to 2031.
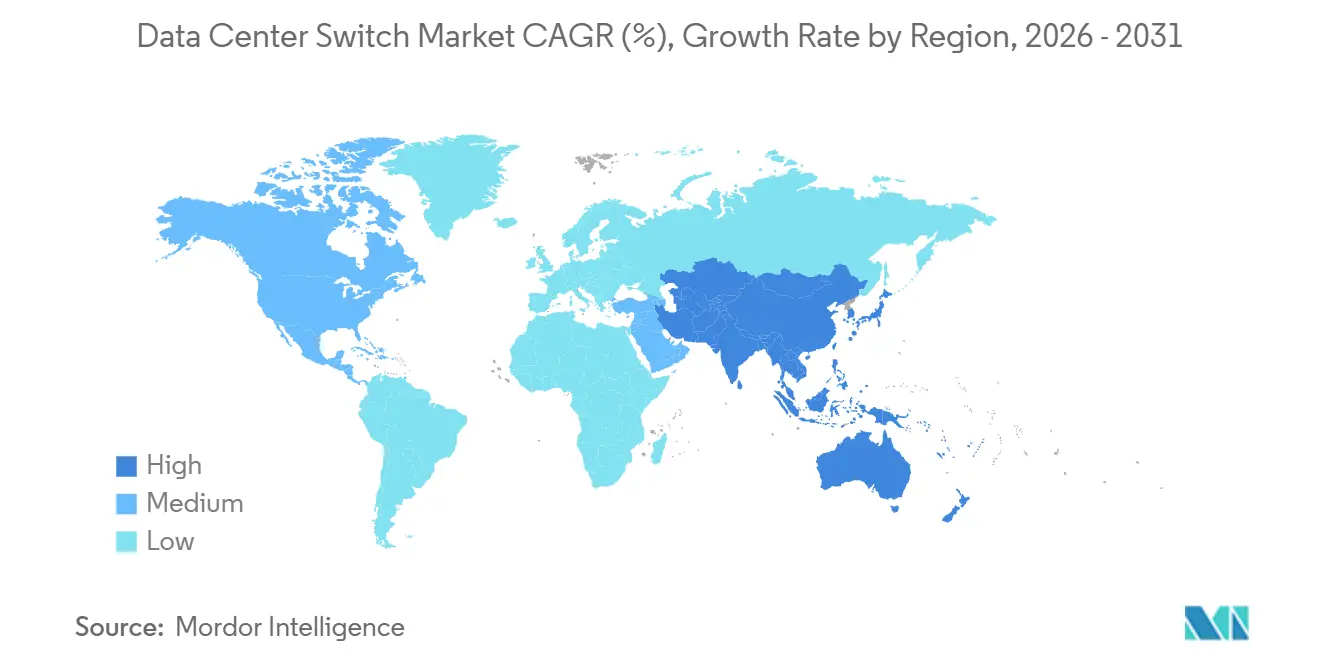
- By geography, North America led with a 39.94% share in 2025, while Asia-Pacific is expected to deliver the fastest regional growth at a 10.06% CAGR through 2031.
Note: Market size and forecast figures in this report are generated using Mordor Intelligence’s proprietary estimation framework, updated with the latest available data and insights as of 2026.
Global Data Center Switch Market Trends and Insights
Drivers Impact Analysis*
| DRIVER | (~) % IMPACT ON CAGR FORECAST | GEOGRAPHIC RELEVANCE | IMPACT TIMELINE |
|---|---|---|---|
| Cloud and Edge Computing Workload Surge | +2.1% | Global, with concentration in North America, Asia-Pacific | Medium term (2-4 years) |
| AI/ML Training Clusters Requiring High-Bandwidth Switching | +2.5% | North America, China, Europe | Short term (≤ 2 years) |
| Mandates on Data Residency and Sovereign Clouds | +1.3% | Europe, Asia-Pacific, Middle East | Long term (≥ 4 years) |
| 400G-800G Optics Driving Port USD/Gb Down | +0.9% | Global | Medium term (2-4 years) |
| Disaggregated Open Networking Adoption | +0.7% | North America, Asia-Pacific | Long term (≥ 4 years) |
| Liquid-Cooling-Ready Ultra-Dense Switching Platforms | +0.5% | North America, Europe, China | Medium term (2-4 years) |
| Source: Mordor Intelligence | |||


Cloud and Edge Computing Workload Surge
Enterprise migration to hybrid-cloud increases east-west traffic, forcing adoption of spine switches that aggregate at least 12.8 Tbit/s to avoid bottlenecks. Telecom operators rolling out 5G edge nodes deploy compact, power-efficient access switches so that sensor data remains local while synchronizing with regional clouds. Containerized microservices amplify lateral flows three- to five-fold, making non-blocking leaf-spine fabrics an operational necessity. Content-delivery networks now install cache nodes in Tier 3 Indian and Southeast Asian cities, each requiring dozens of 10 GbE or 25 GbE access ports. Together these patterns accelerate refresh cycles from five years to three, lifting aggregate port demand across all voltage domains.
AI/ML Training Clusters Requiring High-Bandwidth Switching
Training large language models generates all-to-all traffic that saturates legacy Ethernet within minutes; NVIDIA prescribes eight 51.2 Tbit/s switches per DGX rack to prevent GPU stalls.[1]NVIDIA Corporation, “NVIDIA DGX SuperPOD Design Guide,” nvidia.com Hyperscalers have begun standardizing 800 GbE spines, and financial models show a single 32-port 800 GbE switch priced at USD 180,000 replaces two 400 GbE units while cutting energy by 25%. Juniper logged USD 340 million in 2025 bookings for its AI-tuned QFX5130, underscoring broad intent to retire congested 100 GbE fabrics.[2]Juniper Networks, “QFX5130 AI Fabric Momentum,” juniper.net Although InfiniBand still enjoys 200-nanosecond latency advantage, 70% of new clusters select RoCE on Ethernet to exploit larger vendor ecosystems. Consequently, 800 GbE optics shipments tripled year on year, making this the fastest-growing speed grade in switching history.
Mandates on Data Residency and Sovereign Clouds
The EU Data Governance Act bans cross-border movement of sensitive data, compelling cloud providers to replicate complete leaf-spine domains inside every member state.[3]European Commission, “Data Governance Act,” eur-lex.europa.eu China’s Cybersecurity Law requires in-country switching hardware certified to MLPS 2.0, pushing demand toward Huawei and H3C. India’s draft legislation forces payment logs to traverse RBI-audited switches, while Saudi Arabia mandates hardware root-of-trust modules in government networks. Replication inflates capex by 15-20% but avoiding fines or cloud market bans justifies the spend. These directives lengthen deal cycles yet ultimately increase unit volumes as multinational operators stand up sovereign regions across three continents.
400G-800G Optics Driving Port USD/Gb Down
Coherent pluggables now cost USD 2,200 per 800 GbE port, a 60% decline since 2024, shifting the economics decisively toward higher speeds. Cisco’s Silicon One Q200 packs 12.8 Tbit/s on a single die, enabling 32-port 400 GbE or 16-port 800 GbE line cards without retimers. Hyperscalers gravitate to QSFP-DD800 for backward compatibility, easing incremental upgrades. A 32-port 800 GbE spine draws 4.8 kW, whereas equivalent throughput on 100 GbE equipment needs triple the rack space and more than double the power. Secondary markets already trade decommissioned 25-100 GbE gear at 30% of original cost, accelerating the refresh flywheel as residual value declines.
Restraints Impact Analysis*
| Restraint | (~) % Impact on CAGR Forecast | Geographic Relevance | Impact Timeline |
|---|---|---|---|
| High CAPEX and OPEX for Next-Gen Switch Upgrades | -1.2% | Global, acute in Europe and South America | Short term (≤ 2 years) |
| Skills Shortage in Managing Leaf-Spine Fabrics | -0.8% | Global, severe in Asia-Pacific and Middle East | Medium term (2-4 years) |
| Supply-Chain Disruptions for Advanced ASICs | -0.6% | Global, concentrated impact in North America and Europe | Short term (≤ 2 years) |
| Regulatory Delays in 5 nm / 3 nm Chip Production | -0.4% | Asia-Pacific, Europe | Medium term (2-4 years) |
| Source: Mordor Intelligence | |||
High CAPEX and OPEX for Next-Gen Switch Upgrades
Migrating to 400 GbE demands optics, cabling, and software that inflate budgets to 2.5-3 times hardware list price, turning a USD 120,000 chassis into a USD 230,000 deployment once accessories stack up. Power draw climbs from 1 kW to over 2 kW per device, which, at European energy rates of USD 0.28 /kWh, adds USD 4,500 yearly per switch. CFOs now scrutinize ROI, elongating refresh cycles by up to 18 months. Financing hurdles are steepest in South America and parts of Europe where interest rates and tariffs raise total cost of ownership further. These economics temper near-term port demand, especially in enterprise and colocation segments that lack hyperscale-level capital budgets.
Skills Shortage in Managing Leaf-Spine Fabrics
Sixty-eight percent of operators struggle to hire engineers fluent in EVPN-VXLAN overlays, pushing reliance on vendor services charging USD 2,500-3,500 daily. Misconfigurations in anycast gateways can degrade application performance by 50%, yet packet-level troubleshooting skills take two years to cultivate. Intent-based tools from Juniper and Arista abstract CLI commands, but adoption sits below 20% due to cultural resistance and API learning curves. Asia-Pacific and Middle East growth magnifies the talent gap, forcing operators to import expertise, which elongates deployment timelines and raises opex. Until certification programs catch up, human capital will constrain how fast new fabrics roll out.
*Our forecasts treat driver/restraint impacts as directional, not additive. The impact forecasts reflect baseline growth, mix effects, and variable interactions.
Segment Analysis
By Switch Type: Core Dominance Meets Edge Acceleration
Core switches delivered 47.14% of the market share in 2025, affirming their role as aggregation backbones that stitch together thousands of leaf ports. Despite this dominance, the access layer is forecast to outpace overall data center switch market growth at 9.43% CAGR through 2031 as 5G and edge nodes require compact 10-25 GbE platforms with hardened enclosures. Distribution switches occupy a shrinking middle ground because modern designs favor flat leaf-spine architectures that bypass the aggregation tier. Enterprises keep premium core chassis for scale-up database clusters and inter-metro peering, yet white-box solutions can now assume core duties when paired with robust software. Consequently, pricing premiums for core platforms persist, but volume growth shifts toward access form factors.
The data center switch market benefits as telecom operators roll out thousands of edge sites, each demanding at least two redundant access switches to meet service-level expectations. Cisco’s Nexus and Arista’s 7050X4 families illustrate how vendors blur category lines by enabling the same hardware to serve access or small-core roles via optics selection. Disaggregation amplifies this flexibility because buyers decide software after hardware procurement, diluting legacy definitions of core, distribution, and access. Over the forecast horizon, access port shipments will swell, yet revenue concentration will remain higher in core segments thanks to advanced buffering, redundancy modules, and telemetry features that command premium list prices.


By Bandwidth Class: 800 GbE Reshapes Economics
The 25-100 GbE bracket held 38.17% share in 2025 due to pervasive 25 GbE server links and 100 GbE spine uplinks that still satisfy most non-AI workloads. However, the 800 GbE and beyond class will post the strongest 9.32% CAGR as hyperscalers co-locate GPU clusters that rely on non-blocking fabrics. Lower tiers such as ≤10 GbE are destined for obsolescence as operating systems drop support for 1 GbE interface bonding in modern drivers. Mid-range 100-200 GbE speeds appear transitional, useful for operators unwilling to leapfrog directly to 400 GbE but losing share each quarter.
The data center switch market size advantage of the 25-100 GbE band persists for basic server connectivity, yet capacity modeling shows that doubling AI model parameters increases east-west bandwidth demand ten-fold, making 400 GbE and 800 GbE economically superior on a per-gigabit basis. Meta and Microsoft disclosed 800 GbE pilots that aggregate into 51.2 Tbit/s spines, validating vendor roadmaps. Suppliers, therefore, accelerate 1.6 Tbit/s optical components to avoid repeating the optics scarcity that dogged the 100 GbE transition. The long-tail of ≤10 GbE shipments will taper more quickly as the price delta between 1 GbE and 10 GbE network interface cards narrows below USD 30.
By Switching Technology: Ethernet’s Ubiquity, InfiniBand’s Niche
Ethernet commanded 80.16% of the market share in 2025 and is set to advance at a 9.11% CAGR because new IEEE standards ensure multi-vendor optics interoperability and widespread merchant-silicon supply. Fibre Channel maintains pockets of strength in regulated storage networks but now cedes ground to NVMe-over-TCP that traverses Ethernet without loss-class mechanisms. InfiniBand, while enjoying sub-microsecond latency, remains a niche at single-digit share due to NVIDIA’s near-monopoly on silicon and optics, which squeezes price competition.
InfiniBand will therefore linger in high-performance compute labs and national research facilities, whereas enterprise AI inference shifts to Ethernet plus RoCE for cost parity. Vendors exploit this trend by embedding congestion control and flow-telemetry directly into ASICs, closing latency gaps versus InfiniBand. The data center switch market share of Fibre Channel switches will erode below double digits by the decade’s close, leaving Ethernet to carry data, storage, and management traffic on unified fabrics that simplify cabling and operational tooling.
By Tier Type: Tier 4 Premiums Justify Redundancy
Tier 3 facilities delivered 51.86% of market share in 2025 because they balance uptime and capital efficiency. However, Tier 4 sites will register a 9.29% CAGR as banks, sovereign clouds, and trading venues demand 2N+1 redundancy. Dual-fabric architectures inherent in Tier 4 roughly double switch counts, elevating revenue even if site numbers remain lower than Tier 3.
Operators accept higher unit pricing because Tier 4 cabinets earn 35% more recurring revenue, offsetting capex. Conversely, Tier 1 and Tier 2 buildings now appear primarily at far-edge caching locations where cost minimization matters more than four-nines uptime. The regulatory climate, particularly in Europe and the Middle East, further steers fresh builds toward Tier 4 certifications, embedding redundancy as a non-negotiable design parameter.
By Data Center Size: Hyperscale Velocity Outpaces Legacy Tiers
Large data centers owned by enterprises and colocation firms accounted for 50.68% of the market share in 2025. Hyperscale campuses with more than 100,000 servers are expected to grow at the fastest rate, with a CAGR of 9.81%. This growth is driven by the clustering of compute at the megawatt scale in public cloud regions and AI supercomputers.
Small facilities under 1,000 servers transition to two-tier leaf-spine layouts that remove aggregation hops, cutting latency and capex but generating lower switch ASPs. Medium-sized sites maintain relevance for disaster recovery and regional offices, yet lack the purchasing leverage to dictate ASIC and optics roadmaps. As more traffic consolidates into hyperscale estates, volume purchasing concentrates, allowing cloud giants to negotiate silicon directly from Broadcom and Marvell, further compressing price points for the broader customer base.
By Data Center Type: Hyperscalers Internalize, Colocation Adapts
Colocation operators accounted for 53.38% of the market share in 2025 by leasing neutral space. However, hyperscalers are expected to grow faster at a 9.72% CAGR as they integrate switching layers to enhance telemetry and security control. The shift of enterprise workloads to public cloud slows on-premises refresh rates, exerting downward pressure on colocation margins.
To remain competitive, colocation firms retrofit 400 GbE spines and offer cross-connect fabrics that reach cloud on-ramps inside the same building. Meanwhile, hyperscalers design proprietary switches and ASICs, optimizing packet processing for AI telemetry offload. Edge and enterprise data centers lean into fanless, temperature-hardened switches tailored for industrial and retail environments, illustrating the divergent product requirements that now segment the broader data center switch market.
Geography Analysis
North America retained 39.94% of 2025 revenue driven by hyperscale additions in Virginia, Oregon, and Iowa. U.S. utilities near capacity constraints, with some operators waiting two years for new power connections, prompting long-term renewable purchase agreements. Canada’s Toronto-Montreal corridor serves financial and streaming workloads, while Mexico’s emerging locations cater to near-shoring traffic into Latin America. Although the region enjoys regulatory flexibility, energy pricing of USD 0.12 /kWh pressures opex, accelerating moves toward liquid cooling and direct-chip heat reuse.
Asia-Pacific is poised for the fastest 10.06% CAGR through 2031 as China, India, and Southeast Asia undertake sovereign-AI and payment-localization projects that mandate in-country switching fabrics. China already accounts for nearly half of regional revenue, with Alibaba and Tencent deploying 800 GbE fabrics inside AI mega-pods. India attracts hyperscaler buildouts along its west-to-south corridor, aided by favorable tax holidays and submarine cable trenching. Skills shortages, especially in overlay automation, remain a brake on rollout velocity, prompting partnerships with global vendors that embed remote-operations tooling.
Europe captured roughly 22% share but faces electricity prices north of USD 0.20 /kWh in core markets, steering new capacity to Nordic economies where hydroelectric and ambient cooling lower total cost of ownership by up to 50%. Sovereign-cloud mandates in Germany and France heighten demand for MLPS-equivalent certifications, inflating compliance spend yet locking in long-term contracts. Middle Eastern investment accelerates, anchored by Saudi Arabia’s multibillion-dollar NEOM campus and the UAE’s Dubai Internet City extension, both courting AI tenants with renewable power and liquid-cooling incentives. South America hinges on Brazil’s São Paulo metro where tariffs on imported optics raise capex, spurring local assembly initiatives. Chile and Colombia trail but receive exploratory scouting from U.S. hyperscalers eyeing pan-Andean latency improvements.

Competitive Landscape
The market is moderately concentrated. Cisco’s entrenched Nexus installed base locks in enterprise accounts, yet its hyperscale share erodes as cloud builders adopt white-box hardware running SONiC. Arista differentiates with CloudVision analytics that resolve micro-burst and buffer occupancy at nanosecond precision, a prized feature for trading and AI workloads. Juniper leverages Apstra intent-based automation to court sovereign-cloud projects that demand vendor-neutral fabrics.
White-box manufacturers such as Edgecore and Quanta Cloud Technology capture 15-20% of hyperscale purchase orders by pricing 30-40% below branded equivalents while enabling direct silicon procurement from Broadcom. NVIDIA’s Spectrum-X bundles switching ASICs with GPU clusters, winning USD 1.2 billion in 2025 bookings and threatening to vertically integrate the AI fabric stack. Smaller innovators like Pluribus Networks push micro-segmentation and fabric virtualization on commodity hardware, appealing to enterprises eager to escape license lock-in.
Liquid-cooling-ready switches represent an emerging battleground where Arista’s 7800R4 and NVIDIA’s Spectrum-4 already ship with direct-to-chip or rear-door exchangers. Sovereign-cloud certification creates another moat; Huawei and H3C hold domestic Chinese share through compliance leadership, while European ventures explore indigenous hardware to reduce geopolitical exposure. Edge computing opens niches for fanless, temperature-hardened platforms from HPE Aruba and Extreme Networks, expanding the competitive canvas beyond traditional data hall incumbents.
Data Center Switch Industry Leaders
Cisco Systems, Inc.
Arista Networks, Inc.
Juniper Networks, Inc.
Hewlett Packard Enterprise Development LP
NEC Corporation
- *Disclaimer: Major Players sorted in no particular order

Recent Industry Developments
- January 2026: NVIDIA reported USD 1.2 billion in Spectrum-X bookings for 2025, reflecting hyperscale AI cluster traction.
- December 2025: Juniper Networks secured a USD 340 million contract to deploy QFX5130 switches for a European sovereign-cloud operator.
- November 2025: Cisco introduced the Nexus 9300-GX2 with 48 × 100 GbE and 8 × 400 GbE ports aimed at enterprise fabric upgrades.
- October 2025: Broadcom sampled its Tomahawk 5 ASIC providing 51.2 Tbit/s with embedded nanosecond telemetry.


Global Data Center Switch Market Report Scope
A data center switch is usually found in the server area within a data center. It is one of the indispensable necessities in the premises used to connect multiple devices on the same network within the data center.
The Data Center Switch Market Report is Segmented by Switch Type (Core, Distribution, and Access), Bandwidth Class (≤10 GbE, 25-100 GbE, 100-200 GbE, 200-400 GbE, and 800 GbE and Beyond), Switching Technology (Ethernet, Fibre Channel, and InfiniBand), Tier Type (Tier 1 and 2, Tier 3, and Tier 4), Data Center Size (Small, Medium, Large, and Hyperscale), Data Center Type (Colocation, Hyperscalers/CSPs, and Enterprise and Edge), and Geography (North America, South America, Europe, Asia-Pacific, Middle East and Africa). The Market Forecasts are Provided in Terms of Value (USD).
| Core Switches |
| Distribution Switches |
| Access Switches |
| ≤10 GbE |
| 25–100 GbE |
| 100–200 GbE |
| 100–200 GbE |
| 800 GbE and Beyond |
| Ethernet |
| Fibre Channel |
| InfiniBand |
| Tier 1 and 2 |
| Tier 3 |
| Tier 4 |
| Small Data Center |
| Medium Data Center |
| Large Data Center |
| Hyperscale Data Center |
| Colocation Data Center |
| Hyperscalers Data Center/CSPs |
| Enterprise and Edge Data Center |
| North America | United States | |
| Canada | ||
| Mexico | ||
| South America | Brazil | |
| Rest of South America | ||
| Europe | United Kingdom | |
| Germany | ||
| France | ||
| Italy | ||
| Rest of Europe | ||
| Asia-Pacific | China | |
| Japan | ||
| India | ||
| South Korea | ||
| Rest of Asia-Pacific | ||
| Middle East and Africa | Middle East | Saudi Arabia |
| United Arab Emirates | ||
| Turkey | ||
| Rest of Middle East | ||
| Africa | South Africa | |
| Rest of Africa | ||
| By Switch Type | Core Switches | ||
| Distribution Switches | |||
| Access Switches | |||
| By Bandwidth Class | ≤10 GbE | ||
| 25–100 GbE | |||
| 100–200 GbE | |||
| 100–200 GbE | |||
| 800 GbE and Beyond | |||
| By Switching Technology | Ethernet | ||
| Fibre Channel | |||
| InfiniBand | |||
| By Tier Type | Tier 1 and 2 | ||
| Tier 3 | |||
| Tier 4 | |||
| By Data Center Size | Small Data Center | ||
| Medium Data Center | |||
| Large Data Center | |||
| Hyperscale Data Center | |||
| By Data Center Type | Colocation Data Center | ||
| Hyperscalers Data Center/CSPs | |||
| Enterprise and Edge Data Center | |||
| By Geography | North America | United States | |
| Canada | |||
| Mexico | |||
| South America | Brazil | ||
| Rest of South America | |||
| Europe | United Kingdom | ||
| Germany | |||
| France | |||
| Italy | |||
| Rest of Europe | |||
| Asia-Pacific | China | ||
| Japan | |||
| India | |||
| South Korea | |||
| Rest of Asia-Pacific | |||
| Middle East and Africa | Middle East | Saudi Arabia | |
| United Arab Emirates | |||
| Turkey | |||
| Rest of Middle East | |||
| Africa | South Africa | ||
| Rest of Africa | |||


Key Questions Answered in the Report
What is the projected revenue for data center switching hardware by 2031?
The data center switch market is forecast to reach USD 28.47 billion by 2031.
Which speed grade is expanding the fastest in hyperscale fabrics?
800 GbE and beyond is expected to post a 9.32% CAGR through 2031 as AI workloads demand higher throughput.
Why are Tier 4 facilities gaining traction despite higher costs?
Financial services and sovereign-cloud operators pay premiums for 2N+1 redundancy, boosting Tier 4 switch deployments at a 9.29% CAGR.
How are sovereign-cloud mandates affecting network design?
Regulations force providers to replicate entire leaf-spine domains per jurisdiction, raising capex by 15-20% but ensuring compliance with data-residency laws.
Which vendors benefit most from liquid-cooling-ready switches?
Arista, NVIDIA, and Huawei lead early shipments of liquid-cooled chassis that support 25-kW-plus rack densities.
Page last updated on:


