India Reverse Logistics Market Size and Share
Market Overview
| Study Period | 2020 - 2031 |
|---|---|
| Forecast Data Period | 2026 - 2031 |
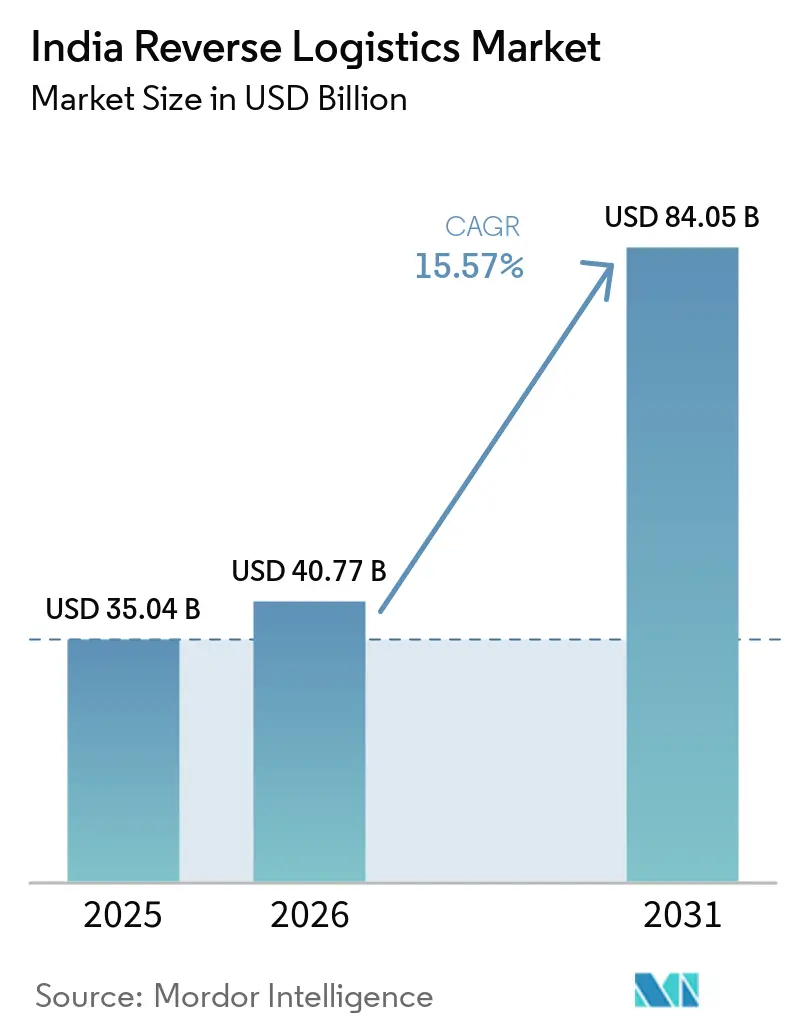
| Base Year Market Size (2025) | USD 35.04 Billion |
| Market Size (2026) | USD 40.77 Billion |
| Market Size (2031) | USD 84.05 Billion |
| Growth Rate (2026 - 2031) | 15.57% CAGR |
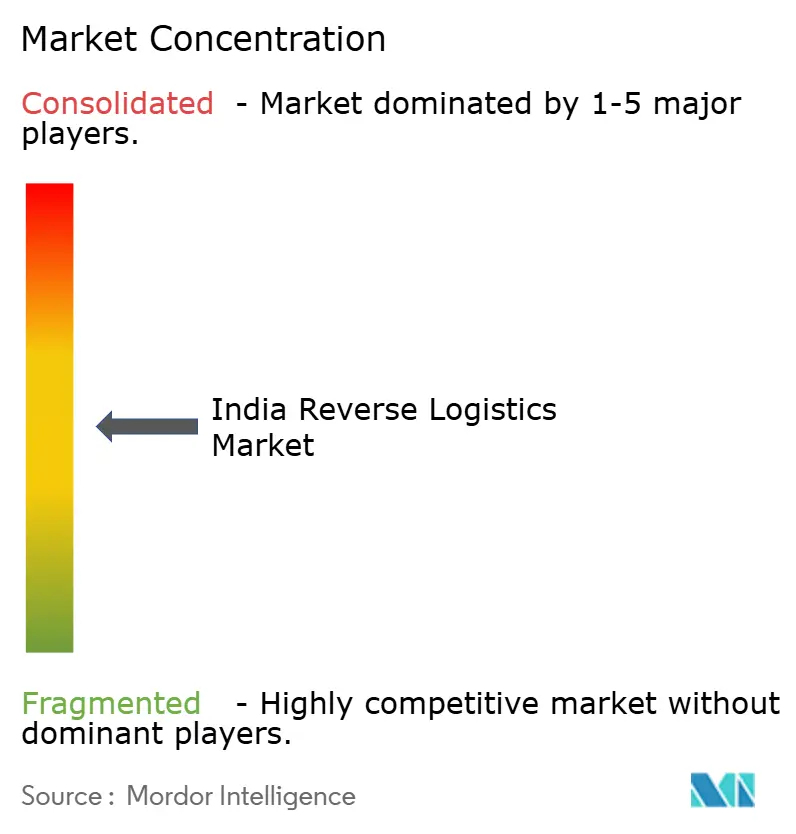
| Market Concentration | Medium |
Major Players
*Disclaimer: Major Players sorted in no particular order Image © Mordor Intelligence. Reuse requires attribution under CC BY 4.0. |
|
India Reverse Logistics Market Analysis by Mordor Intelligence
The India reverse logistics market size is expected to increase from USD 35.04 billion in 2025 to USD 40.77 billion in 2026 and reach USD 84.05 billion by 2031, growing at a CAGR of 15.57% over 2026-2031.
Reverse logistics is now more closely tied to customer retention and inventory recovery, so service quality is becoming more important than pure cost control in the India reverse logistics market. India also continues to see very high return activity in online commerce, with DHL stating that 81% of internet users in the country returned an online purchase in the past 12 months. Tier-2 and Tier-3 cities are further widening the volume base, with Blue Dart stating that these markets are expected to contribute nearly 66% of new direct-to-consumer orders in FY 26. At the same time, e-waste collection mandates and vehicle scrappage rules are creating demand that does not depend solely on voluntary consumer returns, giving the India reverse logistics market a broader base. Consolidation among major express operators and the high cost of failed deliveries are also pushing the India reverse logistics market toward better routing, stronger inspection capability, and dedicated returns infrastructure.
Key Report Takeaways
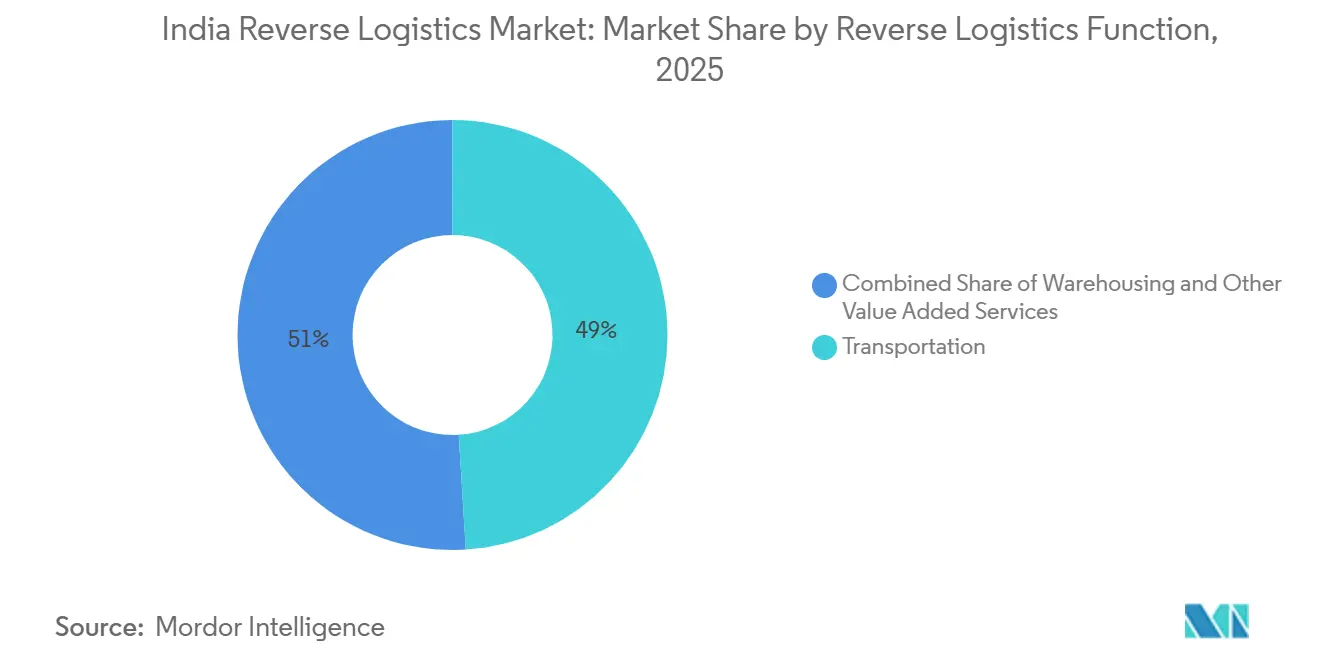
- By reverse logistics function, transportation held 49.05% of the India reverse logistics market size in 2025, while warehousing is projected to expand at 21.58% CAGR through 2031.
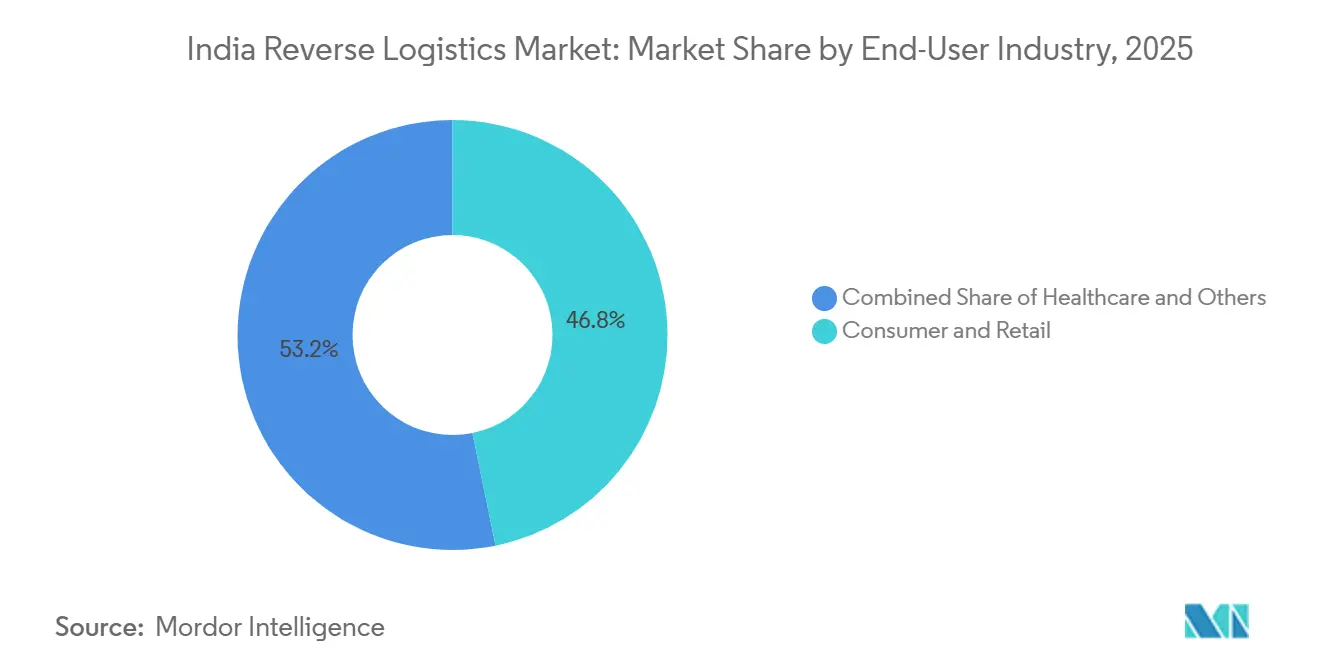
- By end-user industry, consumer and retail held 46.80% of the India reverse logistics market share in 2025, while healthcare and pharmaceuticals are projected to expand at a 23.75% CAGR through 2031.
- By geography, West India held 28.47% of the India reverse logistics market share in 2025, while North India is projected to expand at 18.64% CAGR through 2031.
Note: Market size and forecast figures in this report are generated using Mordor Intelligence’s proprietary estimation framework, updated with the latest available data and insights as of January 2026.
India Reverse Logistics Market Trends and Insights
Drivers Impact Analysis*
| Driver | (~) % Impact on CAGR Forecast | Geographic Relevance | Impact Timeline |
|---|---|---|---|
| Expansion of E-Commerce Returns and Return-to-Origin Volumes | +4.2% | National, concentrated in metro cities with accelerating spill-over to Tier 2/3 markets. | Short term (≤ 2 years) |
| Rising Consumer Trust Requirements for Frictionless Returns | +2.1% | National, highest impact in urban and semi-urban D2C commerce hubs | Medium term (2-4 years) |
| Resale, Refurbishment, and Recommerce Monetization | +2.0% | National, with early gains in metro electronics and fashion resale clusters | Medium term (2-4 years) |
| Poor Product Data and Expectation Mismatch in Online Commerce | +1.3% | National, with the highest exposure in fashion-apparel-heavy marketplaces | Short term (≤ 2 years) |
| E-Waste Compliance and Circular Economy Adoption | +1.4% | National, concentrated in industrial cities, spills over to Tier 2 EPR collection networks. | Long term (≥ 4 years) |
| Rapid Growth of 3PL-Led Reverse Logistics Networks | +2.2% | National, with infrastructure investment concentrated in the West and North India | Medium term (2-4 years) |
| Source: Mordor Intelligence | |||
Expansion of E-Commerce Returns and Return-to-Origin Volumes: The Volume Baseline That Cannot Be Managed Away
India’s online commerce base continues to expand, keeping a large pool of orders flowing into return and return-to-origin channels within the India reverse logistics market. DHL reported that 81% of internet users in India returned an online purchase in the past 12 months, which shows that returns are now a routine part of digital buying behavior. Fashion and footwear continue to generate especially heavy return traffic because size mismatch and expectation gaps remain common in organized online retail. Blue Dart stated that Tier-2 and Tier-3 cities are expected to contribute nearly 66% of new direct-to-consumer orders in FY 26, so reverse pickup density is moving beyond the largest metros. Consumer return windows under the Consumer Protection framework also keep brands under pressure to run formal return systems rather than informal recovery arrangements. This leaves providers with stronger address validation, customer intent checks, and pin-code-level routing tools better positioned in the India reverse logistics market.
Resale, Refurbishment, and Recommerce Monetization: From Cost Recovery to Revenue Generation
Returned goods are increasingly being handled as recoverable inventory rather than as a sunk cost, and that is changing how service models are built across the India reverse logistics market. Cashify stated that trade-ins grew 15-16% year over year in 2025, which shows that more consumers are entering organized exchange and upgrade programs. This shift favors operators that can inspect, grade, clean, and route goods quickly into resale or refurbishment channels. Attero’s Selsmart was active across more than 19 cities and handled more than 30,000 monthly orders by August 2025, which showed that formal doorstep take-back can reach meaningful scale. The informal channel still accounts for a large share of used-device trade, so companies that can capture verified supply at pickup maintain an advantage in formal recovery. Financial Express reported stronger volume expectations for refurbished smartphones in 2026 as new device prices rose, which supports better recovery value for returned electronics[1]India Brand Equity Foundation (IBEF) via Newsgram. "How Indian E-Commerce Companies Are Managing the Returns Challenge." Newsgram, March 24, 2026. .
E-Waste Compliance and Circular Economy Adoption: A Mandated Demand Floor
Regulation is creating demand that is not dependent on consumer return behavior, giving the India reverse logistics market a steadier volume base. The E-Waste (Management) Rules raised the EPR collection target to 70% in FY 2025-26 and will raise it again to 80% in FY 2026-27, which strengthens the case for certified collection and recycling networks. Non-compliance penalties ranging from INR 1 lakh (USD 1,044) to INR 1 crore (USD 0.10 million) per violation also increase the operating cost of weak compliance. From 2026, EPR registration data will be linked to BIS and Customs databases, increasing the risk of clearance delays for non-registered products and making compliant reverse flows more valuable. Attero committed INR 150 crore (USD 17.6 million) in December 2025 to add new plants and expand processing capacity. In February 2026, it outlined a further INR 7,000 crore (USD 813 million) investment plan tied to rare-earth and critical mineral processing[2]Attero Recycling / PV Magazine India. "Attero to Invest INR 100 Crore to Scale Rare Earth Element Recycling Capacity to 30,000 Tonnes." PV Magazine India, June 23, 2025.. The ELV Rules 2025 extend the same compliance logic into the vehicle cycle, so recycling and parts recovery are becoming a more formal demand lane for the India reverse logistics market.
Rapid Growth of 3PL-Led Reverse Logistics Networks: Consolidation Accelerates Capability Concentration
Scale is concentrating on networks that can combine linehaul, sorting, returns handling, and data visibility, reshaping the India reverse logistics market. Delhivery completed the acquisition of Ecom Express in July 2025 for INR 13,696 crore (USD 1.6 billion), which materially increased parcel density across first-mile pickup, processing, last-mile delivery, and reverse flows. Delhivery also stated in Q3 FY 26 that operating revenue grew 18% year over year to INR 2,805 crore (USD 2.93 billion) and that expected integration costs were likely to stay well below the original estimate. Shadowfax invested INR 185 crore (USD 21.8 million) in FY 26 and commissioned the OneNCR mega-hub with a daily capacity of 1 million shipments, demonstrating how automation and sortation density are becoming central competitive tools. Mahindra Logistics and TVS Supply Chain Solutions also posted stronger FY 26 performance, which shows that reverse capability is being built across multiple 3PL models. This favors operators that can feed return reasons, condition checks, and routing outcomes back into network design, which deepens switching costs in the India reverse logistics market.
Restraints Impact Analysis*
| Restraint | (~) % Impact on CAGR Forecast | Geographic Relevance | Impact Timeline |
|---|---|---|---|
| High Reverse Handling Cost as a Share of Order Value | -2.1% | National, with disproportionate impact in non-metro and Tier 2/3 markets | Short term (≤ 2 years) |
| Fragmented Pickup, Sorting, and Quality-Check Infrastructure Outside Tier 1 Hubs | -2.3% | Tier 2/3 cities, semi-urban and rural markets | Medium term (2-4 years) |
| Value Erosion From Delayed Validation and Restocking | -1.2% | National, highest impact in high-return categories (fashion, electronics) | Short term (≤ 2 years) |
| Complex Dispute Resolution for Open-Box, Damaged, and Refused Returns | -0.9% | National, with a higher incidence in COD-heavy markets | Medium term (2-4 years) |
| Source: Mordor Intelligence | |||
High Reverse Handling Cost as a Share of Order Value: A Margin Problem Without a Simple Fix
Reverse handling costs continue to compress margin recovery in the India reverse logistics market, especially in low-ticket categories[3]Shipway. "Reverse Logistics Costs: Calculate and Control Them." Shipway Blog, 2025. https://blog.shipway.com/reverse-logistics-costs-calculation-control-strategies. Blue Dart stated that return-to-origin shipments, more than customer returns alone, are India’s biggest e-commerce margin problem. GS1 India estimated in April 2026 that poor product data quality was costing the sector nearly INR 5,000 crore (USD 588 million) a year, including INR 1,900 crore (USD 2.03 billion) linked directly to reverse logistics handling and processing. COD-heavy orders remain the hardest to absorb because failed deliveries can incur forward and reverse shipping costs, with no revenue recovery. That cost floor shows that network efficiency alone is not enough; brands also need better listing quality, stronger prepaid conversion, and sharper checkout screening.
Fragmented Pickup, Sorting, and Quality-Check Infrastructure Outside Tier 1 Hubs: The Bharat Commerce Gap
The infrastructure for pickup, sorting, and quality checks is still concentrated in Tier-1 cities, which limits service quality across the wider India reverse logistics market. Blue Dart stated that Tier-2 and Tier-3 cities are expected to drive nearly 66% of new direct-to-consumer orders in FY 26, but reverse capacity in many of these markets is still early. Without doorstep quality checks, returned goods often travel longer distances before condition is verified, which increases value erosion and processing time. LEADS 2025 and current expressway investments show that trunk connectivity is improving in North India, but this does not, on its own, address local pickup density or edge-level sorting. Until these source-level gaps narrow, providers will struggle to capture the full opportunity available to the India reverse logistics market outside major metro hubs.
*Our forecasts treat driver/restraint impacts as directional, not additive. The impact forecasts reflect baseline growth, mix effects, and variable interactions.
Segment Analysis
By Reverse Logistics Function: Warehousing Investments Redefine the Value Chain
Transportation accounted for 49.05% of the India reverse logistics market share in 2025, making it the largest functional block. This concentration reflects the scale of first-mile pickup required across millions of delivery addresses. Road transport remains the dominant sub-mode because most returns move across short and medium distances rather than by premium air lanes. The segment also benefits from the spread of reverse pickup requests across COD, exchange, refused, and damaged orders, which keeps route density high. In practice, transportation remains the service layer where pickup success, transit visibility, and resolution speed shape the customer experience most directly.
Warehousing is the fastest-growing function, and the India reverse logistics market size for this part of the chain is projected to grow at 21.58% CAGR through 2031. Returns facilities are no longer used only for storage, and operators are building inspection, grading, refurbishment, restocking, and disposal workflows into the same sites. Other value-added services carry the highest per-unit margins because they combine return processing, restocking, refurbishment, and final disposition into a single service bundle.


By End-user Industry: Consumer and Retail Dominate While Healthcare Reshapes the Growth Curve
Consumer and retail accounted for 46.80% of the India reverse logistics market size in 2025, making it the leading end-user segment by a clear margin. Fashion, apparel, and footwear generate the largest share of returns because size mismatch and expectation gaps remain common in organized online commerce. COD use amplifies this flow because refusal and failed delivery risks remain high in these categories. Amazon and Flipkart are using AI-assisted listing and product-data tools to reduce preventable returns, which shows that return prevention is becoming part of competitive execution. Home and decor and FMCG add steady volume, although their return triggers are more often linked to damage, quality, or delivery condition than to fit.
Healthcare and pharmaceutical is the fastest-growing vertical, projected to expand at a 23.75% CAGR through 2031. The ELV Rules 2025 are pushing manufacturers, scrappage facilities, and recyclers into more formal recovery systems, which widens the service mix within the India reverse logistics industry. Healthcare and pharmaceuticals remain a specialized lane where GDP-compliant handling, temperature control, and traceability matter more than parcel scale, as shown by Kuehne+Nagel’s investments in Bengaluru and Hyderabad.
Geography Analysis
West India held 28.47% of the India reverse logistics market share in 2025, making it the leading regional cluster. Mumbai’s port access, Maharashtra’s industrial base, and Gujarat’s port network support fast movement between pickup, consolidation, and disposition nodes. Kuehne+Nagel opened a 3,500 m² container freight station near JNPA Mumbai in February 2026, which added more compliant capacity to the region’s logistics backbone[4]Kuehne+Nagel, “Kuehne+Nagel Expands Healthcare Logistics Network With Hyderabad Temperature-Controlled Facility,” Kuehne+Nagel Newsroom, newsroom.kuehne-nagel.com. Maharashtra’s logistics policy and ongoing warehouse development keep West India deeply embedded in the India reverse logistics market.
North India is the fastest-growing region, and the India reverse logistics market size here is projected to expand at 18.64% CAGR through 2031. Delhi-NCR accounted for 19% of pan-India industrial and warehousing absorption in H1 2025, giving the region a strong base for returns processing. The 594 km Ganga Expressway is expected to reduce logistics costs in Uttar Pradesh and support warehouse demand in markets such as Lucknow and Meerut. LEADS 2025 also highlighted Uttar Pradesh as a rapidly improving logistics ecosystem, with improved multimodal connectivity and deeper warehousing. High e-commerce origination volumes in NCR and rising manufacturing activity are making North India a more efficient hub-and-spoke region for the India reverse logistics market.
South and East India still hold smaller shares, but both are widening their role in specialized and emerging flows. Bengaluru, Hyderabad, and Chennai support pharma, electronics, and automotive returns, which gives South India a broader service mix than pure parcel returns. East India is starting from a lower base, but Vestian recorded Kolkata’s highest-ever warehouse absorption in Q3 2025, pointing to delayed but visible capacity activation. Central India remains the least developed region, although Nagpur’s central location and the development of logistics parks are beginning to support its role as a consolidation node for the India reverse logistics market.
Competitive Landscape
Competition in the India reverse logistics market is moderately concentrated at the top and fragmented across the mid-tier. Delhivery, Blue Dart, and Shadowfax currently anchor the listed express layer, especially in B2C reverse flows. Delhivery’s integration of Ecom Express expanded its domestic network and reduced expected integration costs to INR 100-110 crore (USD 12-13 million), down from the original estimate of INR 300 crore (USD 31.75 million). Blue Dart continues to differentiate through premium express service and aviation assets, including its Chennai aviation hub, launched in June 2025. Shadowfax paired FY26 capex of INR 185 crore (USD 21.8 million) with the OneNCR mega-hub, which showed that automation and sortation density are becoming central competitive tools.
Competitive advantage in the India reverse logistics market is increasingly tied to data rather than fleet size alone. Operators that collect return reasons, condition codes, address failures, and disposition outcomes can improve routing, staffing, and recovery yield over time. Attero’s MetalMandi platform moved this logic into scrap procurement, reaching more than 2 lakh downloads and handling 15,000 metric tons a month across 28 states in 2025. WareIQ took full control of a 75,000 ft² facility in Gurugram in 2026, signaling that newer players are blending software coordination with direct operational control in dense clusters. These moves show that the India reverse logistics market rewards firms that can connect pickup, processing, resale, recycling, and reporting in one operating loop.
White-space opportunities remain in doorstep quality checks, edge-level disposition decisions, and reliable pickup density across Tier-2 and Tier-3 cities. Global groups such as Kuehne+Nagel, DHL, and CEVA Logistics are strongest in pharma, industrial, and automotive lanes where compliance requirements support premium pricing. Domestic players still hold an advantage in large-scale parcel density, localized COD behavior, and broad pincode reach. Overall, the India reverse logistics market is moving toward greater concentration of capabilities, but it is still far from a winner-take-all structure.
India Reverse Logistics Industry Leaders
-
Blue Dart Express Limited
-
Delhivery Limited
-
DTDC Express Limited
-
Shadowfax Technologies Private Limited
-
DHL Group
- *Disclaimer: Major Players sorted in no particular order

Recent Industry Developments
- May 2026: Kuehne+Nagel launched a GDP-compliant airfreight cross-dock in Hyderabad with dedicated temperature zones of +2 °C to +8 °C and +15 °C to +25 °C, its second HealthChain-certified facility in India after the December 2025 Bengaluru Cool Zone launch. The facility supports compliant reverse logistics of pharmaceutical and medical shipments from India's largest API and vaccine corridor.
- April 2026: Flipkart's logistics arm Ekart expanded its last-mile delivery partnership with IKEA to cover Chennai, using a 100% electric vehicle fleet, following the initial partnership launch in NCR-Delhi in 2025. Chennai becomes the second market under the collaboration, reflecting Ekart's B2B enterprise logistics push.
- April 2026: Blue Dart inaugurated a new aviation hub at the Blue Dart Aviation Terminal in Chennai, spanning 4,912 m², to enable faster shipment transfers and reduce transit times for e-commerce and B2B cargo in South India. The hub strengthens air cargo infrastructure for forward and reverse logistics in a high-growth region.
- February 2026: Kuehne+Nagel inaugurated a new 3,500 m² CFS near JNPA Mumbai, built to CTPAT, AEO, and ISO standards, with electric material-handling equipment and solar-powered lighting. The facility supports scalable import-export operations and improves reverse supply chain connectivity for West India's manufacturing and e-commerce.


India Reverse Logistics Market Report Scope
| Transportation | Road |
| Air | |
| Other Modes | |
| Warehousing (Storage, Distribution, Consolidation) | |
| Other Value-added Services (Return Processing, Restocking, Refurbishment, Disposition) |
| Consumer and Retail |
| Home and Decor |
| Healthcare and Pharmaceuticals |
| FMCG |
| Other End Users |
| North |
| Central |
| West |
| East |
| South |
| By Reverse Logistics Function | Transportation | Road |
| Air | ||
| Other Modes | ||
| Warehousing (Storage, Distribution, Consolidation) | ||
| Other Value-added Services (Return Processing, Restocking, Refurbishment, Disposition) | ||
| By End-user Industry | Consumer and Retail | |
| Home and Decor | ||
| Healthcare and Pharmaceuticals | ||
| FMCG | ||
| Other End Users | ||
| By Region | North | |
| Central | ||
| West | ||
| East | ||
| South |


Key Questions Answered in the Report
What is driving growth in India reverse logistics through 2031?
Growth is being driven by high online return activity, rising order volumes from Tier-2 and Tier-3 cities, stronger enforcement of e-waste compliance, and more formal recovery in automotive and electronics.
How large is the reverse logistics opportunity in India by 2031?
The India reverse logistics market is projected to reach USD 84.05 billion by 2031, up from USD 40.77 billion in 2026, at a CAGR of 15.57% over 2026-2031.
Which reverse logistics function is growing the fastest in India?
Warehousing is the fastest-growing function, projected to expand at 21.58% CAGR through 2031, as returns centers take on inspection, grading, refurbishment, and disposal work.
Which end-user segment creates the most reverse volume in India?
Consumer and retail is the largest end-user segment, accounting for 46.80% in 2025, with fashion and apparel contributing heavily due to fit and expectation mismatches.
Which region offers the strongest expansion potential?
North India is the fastest-growing region, with a 18.64% CAGR through 2031, supported by NCR's warehousing depth, new expressway connectivity, and rising logistics investment in Uttar Pradesh.
How competitive is the India reverse logistics space today?
The top listed express operators are gaining scale, but the broader field remains fragmented across warehousing, refurbishment, recycling, and regional pickup networks, so the sector is not yet fully consolidated.
Page last updated on:


