United States Reverse Logistics Market Size and Share
Market Overview
| Study Period | 2020 - 2031 |
|---|---|
| Forecast Data Period | 2026 - 2031 |
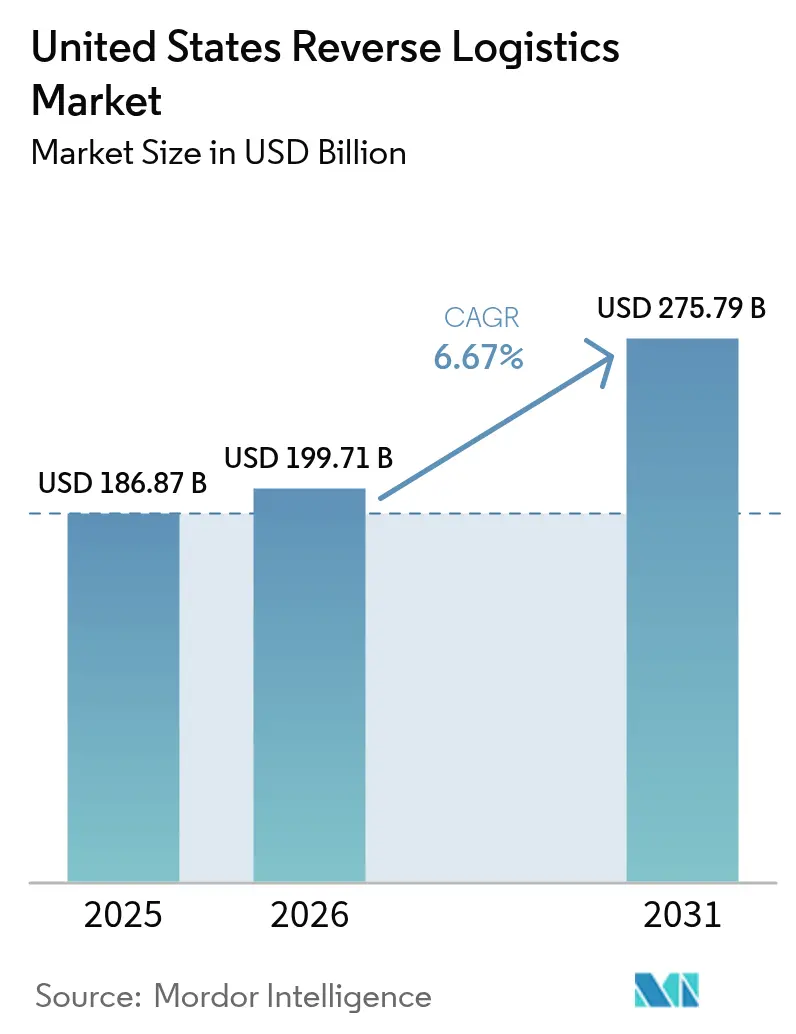
| Base Year Market Size (2025) | USD 186.87 Billion |
| Market Size (2026) | USD 199.71 Billion |
| Market Size (2031) | USD 275.79 Billion |
| Growth Rate (2026 - 2031) | 6.67% CAGR |
| Market Concentration | Medium |
Major Players *Disclaimer: Major Players sorted in no particular order Image © Mordor Intelligence. Reuse requires attribution under CC BY 4.0. | |
United States Reverse Logistics Market Analysis by Mordor Intelligence
The United States reverse logistics market size is expected to grow from USD 186.87 billion in 2025 to USD 199.71 billion in 2026 and is forecast to reach USD 275.79 billion by 2031 at a 6.67% CAGR over 2026-2031.
Momentum reflects the shift from cost-center thinking to value-creation, as efficient returns networks now unlock resale revenue, regulatory credits, and repeat-purchase loyalty. Federal right-to-repair statutes in California, New York, and Minnesota compel manufacturers to harvest parts, while blockchain consortia spearheaded by luxury brands authenticate returns, reducing counterfeit losses. Transportation dominates because every returned item still requires physical movement, margin growth concentrates in value-added services such as inspection, refurbishment, and recommerce, where recovery values reach 40-60% of the original retail price. Cold-chain complexity and DEA oversight accelerate healthcare volumes, and tougher DOT lithium-battery rules raise electronics return costs by 12-18%, nudging shippers toward specialized providers. Tight labor markets, with 15% technician vacancies, cap near-term throughput but also create pricing power for qualified operators.
Key Report Takeaways
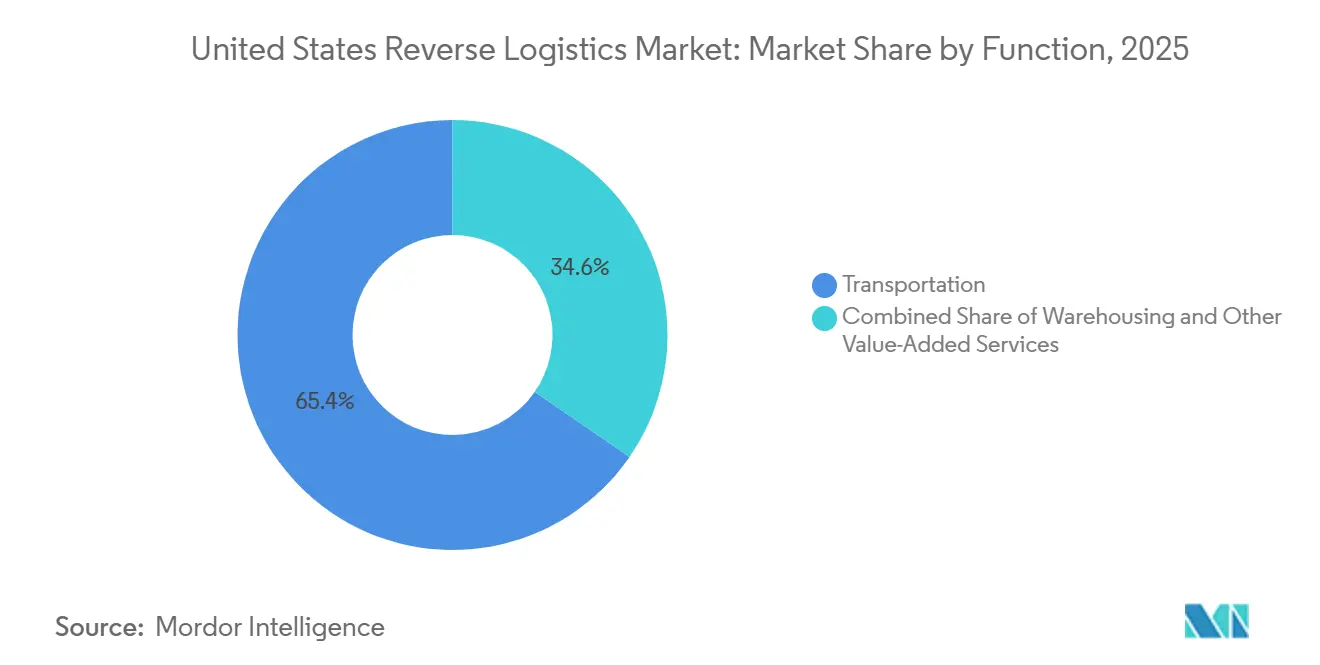
- By function, transportation held 65.4% of the United States reverse logistics market share in 2025, while value-added services are forecast to expand at a 6.8% CAGR through 2031.
- By end user, consumer and retail accounted for 41.5% of the United States reverse logistics market size in 2025; healthcare and pharmaceuticals are advancing at a 6.9% CAGR to 2031.
Note: Market size and forecast figures in this report are generated using Mordor Intelligence’s proprietary estimation framework, updated with the latest available data and insights as of 2026.
United States Reverse Logistics Market Trends and Insights
Drivers Impact Analysis*
| Driver | (~) % Impact on CAGR Forecast | Geographic Relevance | Impact Timeline |
|---|---|---|---|
| Circular-economy tax credits accelerating refurbishment investment | +1.1% | National, stronger in CA, NY, OR | Long term (≥ 4 years) |
| Ship-from-store returns models slashing first-mile costs | +1.3% | National, dense retail corridors | Medium term (2-4 years) |
| Subscription-commerce growth creating predictable reverse flows | +0.9% | National, urban clusters | Medium term (2-4 years) |
| Blockchain-enabled authenticity tracking | +0.7% | National, luxury & electronics | Long term (≥ 4 years) |
| POS-integrated recommerce platforms | +1.0% | National, omnichannel retailers | Medium term (2-4 years) |
| Federal right-to-repair momentum | +0.8% | National, state-level nuances | Long term (≥ 4 years) |
| Source: Mordor Intelligence | |||


Circular-Economy Tax Credits Accelerating Refurbishment Investment
State and federal incentives are compressing refurbishment payback periods from seven to roughly four years. California now offers credits covering up to 25% of qualified refurbishment equipment outlays, prompting expansion of multi-category plants handling electronics, appliances, and furniture. The Inflation Reduction Act extends production credits to domestic remanufacturing lines that meet local-content rules, anchoring jobs and capacity stateside. Oregon tops up its economy with per-pound electronics subsidies that fluctuate with commodity prices. Cisco’s Certified Refurbished program, buoyed by these measures, generated USD 1.2 billion in revenue in fiscal 2024 while diverting 99.8% of returned units from landfill. These policies reposition the United States reverse logistics market as a profit engine rather than an unavoidable expense[1]“SB-244 The Right to Repair Act,” California Legislative Information, leginfo.legislature.ca.gov.
“Ship-from-Store Returns” Models Slashing First-Mile Costs
Retailers now re-purpose sales floors as micro-hubs that accept, inspect, and reroute products within 48 hours. Target’s in-store sortation nodes cut transportation costs by 35% versus centralized depots and relist salable inventory online within two days. Nordstrom’s Local hubs handle three to five times the traditional returns volume per square foot, proving the density advantage of urban storefronts. Walmart piloted the concept across 50 outlets in 2024, realizing 40% cost savings and shortening cash-credit issuance cycles to customers. Rapid reinjection of goods curbs markdown erosion, a growing imperative as consumers expect near-instant refunds[2]“Hazardous Materials: Harmonization with International Standards,” Pipeline and Hazardous Materials Safety Administration, federalregister.gov .
Subscription-Commerce Growth Creating Predictable Reverse Flows
Recurring rental and replenishment services produce stable volumes, enabling route consolidation and facility scheduling that trim per-unit handling costs 15-20%. Rent the Runway now processes more than 100,000 apparel returns weekly through purpose-built facilities that turn items around in the same week. Stitch Fix uses predictive modeling to pre-stage labor and packaging, realizing higher labor utilization and fewer rush shipments. A USD 38 billion consumer subscription economy underpins this growth, with apparel and beauty boxes showing 25-40% return propensities that feed the United States reverse logistics market.
Blockchain-Enabled Authenticity Tracking Improving Recovery Values
The Aura Blockchain Consortium expanded to 40 luxury labels in 2024, recording 30 million product authentications that cut counterfeit return losses previously topping USD 10 billion. Each item receives a secure digital certificate, giving returns processors immediate proof of provenance. Electronics giants are piloting comparable systems to speed warranty validation, and on-chain proofs now command 15-25% resale premiums. As adoption scales, transparent traceability is set to raise average recovery values across the United States reverse logistics market.
Restraints Impact Analysis*
| Restraint | (~) % Impact on CAGR Forecast | Geographic Relevance | Impact Timeline |
|---|---|---|---|
| Skilled-labor shortages in refurbishment roles | -1.2% | National, acute in secondary metros | Short term (≤ 2 years) |
| Secondary-market price volatility | -0.9% | National, electronics and apparel | Medium term (2-4 years) |
| Stringent lithium-battery transport rules | -0.7% | National, air freight lanes | Short term (≤ 2 years) |
| Fragmented data standards | -0.6% | National, multi-carrier networks | Long term (≥ 4 years) |
| Source: Mordor Intelligence | |||
Acute Skilled-Labor Shortages in Refurbishment and Inspection
Vacancies for technicians able to replace batteries, repair boards, or grade cosmetics climbed to 15-20%, double general warehouse gaps, and turnover runs 25-35% annually. Higher complexity products now require up to 60 inspection points, limiting throughput and forcing otherwise refurbishable stock into low-margin liquidation. Providers pay 20-30% wage premiums, yet applicants gravitate toward IT roles, squeezing capacity during peak return seasons[3]“Job Openings and Labor Turnover Summary,” U.S. Bureau of Labor Statistics, bls.gov .
Secondary-Market Price Volatility Eroding Recovery Margins
Smartphone prices can fall 8-12% each month during product cycles, and fast-fashion apparel sees 30-50% seasonal swings. ThredUp’s 2024 report chronicled double-digit value declines for oversupplied brands. Operators often liquidate early to avoid depreciation, sacrificing 10-20% of potential resale value and dampening the United States reverse logistics market size upside[4]“Circular Economy and Plastic Pollution Reduction Act,” California Department of Tax and Fee Administration, cdtfa.ca.gov.
*Our forecasts treat driver/restraint impacts as directional, not additive. The impact forecasts reflect baseline growth, mix effects, and variable interactions.
Segment Analysis
By Function: Value-Added Services Drive Margin Expansion
Value-added services recorded the fastest 6.8% CAGR through 2031 as retailers and OEMs seek higher recovery values from inspection, grading, repair, and direct-to-consumer resale programs. Ingram Micro operates centers that process nearly 1 million devices monthly, refurbishing units that yield up to 60% of the original ticket price. Transportation still holds 65.4% market share, but its role is evolving toward scheduled pickups and store-based consolidation. Integration of both functions under one provider increasingly secures longer-term contracts, cementing the competitive positioning of diversified players in the United States reverse logistics market.
Second-tier warehousing supports staging and cross-docking but now embeds testing lines and recommerce photo booths, blurring functional boundaries. As refurbishment output rises, providers partner with e-commerce marketplaces to sell recovered goods at a higher margin, reinforcing the pivot from logistics cost mitigation to profit generation.


By End User: Healthcare Complexity Commands Premium Pricing
Healthcare and pharmaceuticals are growing at 6.9% CAGR as DEA-licensed distributors handle controlled returns and FDA rules require proof-of-chain for medical device recalls. UPS’s USD 1.6 billion purchase of Andlauer expands cold-chain campuses that process temperature-sensitive vials and devices within regulated timelines. Consumer and retail still generates the bulk of volume at a market share of 41.5%, but fraud-screening costs are rising, pushing merchants toward store-acceptance models that shorten refund cycles and cap shrinkage.
Home and decor returns demand oversized handling and in-home pickup; furniture-focused network AptDeco doubled capacity in 2025 to meet this niche. FMCG flows are anchored in recall execution and expiry mitigation; tight federal traceability deadlines drive adoption of serialized tracking even for low-value SKUs.

Geography Analysis
California generates roughly one-fifth of national reverse volumes thanks to 40 million consumers, sweeping electronics mandates, and a dense cluster of technology OEMs. Circular-economy tax credits and extended producer rules stimulate investments in Bay Area refurbishment plants that feed Pacific-Rim return-to-manufacturer loops.
The Northeast corridor from Boston to Washington, D.C., forms the second-largest regional block. High e-commerce penetration and stringent recycling laws, including New York’s Digital Fair Repair Act, spur certified processing facilities around New Jersey’s logistics belt. Pharmaceutical giants along the I-95 biotech stretch heighten demand for DEA-compliant reverse distribution, while port proximity eases export of secondary-market inventory.
Midwestern hubs such as Chicago, Indianapolis, and Columbus leverage central geography to consolidate coast-to-coast returns. Abundant industrial real estate and skilled labor pools inherited from manufacturing heritage reduce per-square-foot costs, attracting expansion by DHL, FedEx, and regional specialists. Southern states led by Texas, Georgia, and Florida post high growth as population inflows and fulfillment-center booms create fresh return volumes; lenient permitting and lower wages offset shortages of refurbishment technicians. Across all regions, LEED-certified facilities and renewable power purchase agreements now accompany most new builds, aligning with customer ESG scorecards and qualifying operators for additional state incentives.
Competitive Landscape
Competition is moderate but intensifying as sophisticated technology, compliance expertise, and network density differentiate winners. UPS, FedEx, and DHL exploit nationwide transport grids, yet now invest in robotics and AI-powered grading lines to sustain margins in the United States reverse logistics market. DHL’s January 2025 acquisition of Inmar added 14 sites and 500 million additional annual unit capacity, vaulting it to the top of the returns-processing leaderboard.
Specialist processors like GENCO, RLG, and Ingram Micro extract higher margins from refurbishment, electronics recommerce, and pharmaceutical take-back, routinely earning EBIT margins 15-25% above freight-centric providers. Optoro, Trove, and G2 Reverse Logistics supply cloud engines that evaluate item condition, resale demand, and compliance flags in near real time, granting smaller merchants access to optimization once limited to big box retailers. Venture funds poured more than USD 200 million into such platforms during 2024-2025, underscoring digital’s role in future market structure.
White-space niches involve DEA-licensed medical returns, EPA hazardous material processing, and high-capacity battery disassembly under new DOT rules. Blockchain authentication and on-device diagnostics for IoT equipment represent the next frontier, with early adopters reporting 20-30% better recovery values via fraud reduction and faster disposition. As circular-economy targets toughen, providers combining transport, refurbishment, and recommerce will likely consolidate share.
United States Reverse Logistics Industry Leaders
DHL Group
United Parcel Service of America, Inc.
FedEx
XPO Inc.
Ryder System, Inc.
- *Disclaimer: Major Players sorted in no particular order


Recent Industry Developments
- October 2025: DHL Supply Chain unveiled its DHL ReTurn Network, a nationwide, multi-client solution aimed at streamlining and making returns management more sustainable for businesses.
- April 2025: UPS agreed to acquire Andlauer Healthcare Group for USD 1.6 billion, expanding cold-chain reverse logistics for pharmaceutical returns.
- March 2025: FedEx launched a consolidated returns service with Kohl’s, opening 1,100 brick-and-mortar drop points to reduce consumer first-mile friction.
- January 2025: DHL Supply Chain completed its acquisition of Inmar Supply Chain Solutions, adding 14 United States return centers and doubling annual processing to more than 500 million units.


United States Reverse Logistics Market Report Scope
| Transportation | Road |
| Air | |
| Other Modes | |
| Warehousing (Storage, Distribution, Consolidation) | |
| Other Value-added Services (Return Processing, Restocking, Refurbishment, Disposition) |
| Consumer and Retail |
| Home and Decor |
| Healthcare and Pharmaceuticals |
| FMCG |
| Other End Users |
| By Function | Transportation | Road |
| Air | ||
| Other Modes | ||
| Warehousing (Storage, Distribution, Consolidation) | ||
| Other Value-added Services (Return Processing, Restocking, Refurbishment, Disposition) | ||
| By End User | Consumer and Retail | |
| Home and Decor | ||
| Healthcare and Pharmaceuticals | ||
| FMCG | ||
| Other End Users |


Key Questions Answered in the Report
What is the projected value of the United States reverse logistics market by 2031?
It is forecast to reach USD 275.79 billion by 2031, reflecting a 6.67% CAGR from 2026-2031.
Which functional segment is expanding fastest in United States reverse logistics?
Value-added services such as inspection, refurbishment, and recommerce are growing at 6.8% CAGR as companies pursue higher recovery margins.
Why is healthcare driving reverse logistics demand?
DEA and FDA regulations plus cold-chain complexity push healthcare and pharmaceuticals to a 6.9% CAGR, outpacing retail volumes.
How do right-to-repair laws affect reverse logistics providers?
They require OEMs to reclaim parts, creating steady inbound streams of devices and components that need certified testing and redistribution.
What are the main cost headwinds for electronics returns?
New DOT lithium-battery rules add 12-18% to transport and packaging costs, and skilled-technician shortages raise labor expenses in refurbishment lines.
Page last updated on:


