China Reverse Logistics Market Size and Share
Market Overview
| Study Period | 2020 - 2031 |
|---|---|
| Forecast Data Period | 2026 - 2031 |
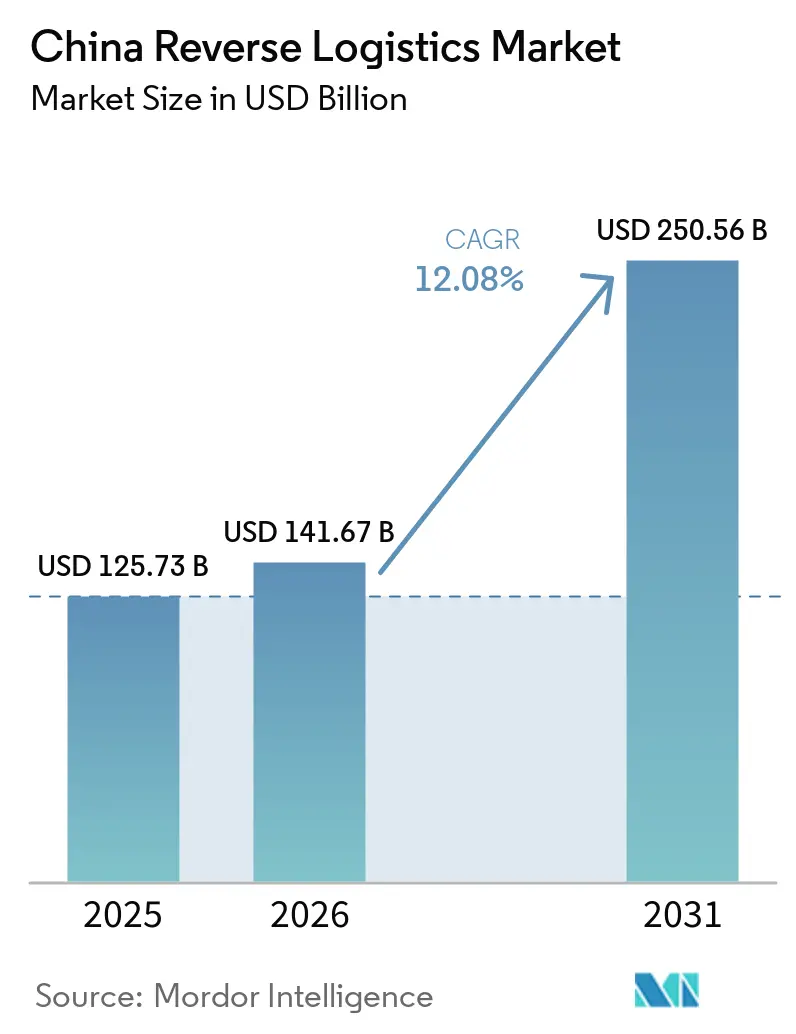
| Base Year Market Size (2025) | USD 125.73 Billion |
| Market Size (2026) | USD 141.67 Billion |
| Market Size (2031) | USD 250.56 Billion |
| Growth Rate (2026 - 2031) | 12.08% CAGR |
| Market Concentration | Medium |
Major Players *Disclaimer: Major Players sorted in no particular order Image © Mordor Intelligence. Reuse requires attribution under CC BY 4.0. | |
China Reverse Logistics Market Analysis by Mordor Intelligence
The China reverse logistics market size is projected to expand from USD 125.73 billion in 2025 to USD 141.67 billion in 2026 and reach USD 250.56 billion by 2031, growing at a CAGR of 12.08% from 2026 to 2031.
China’s reverse logistics market is performing steadily, supported by the country’s large e-commerce ecosystem, growing consumer returns, and increasing focus on product recovery and resale. The market is becoming more structured as companies invest in better return handling, refurbishment, recycling, and route optimization to reduce operational friction. Sustainability is also shaping the market, with businesses under pressure to improve circular economy practices and reduce waste through more efficient reverse flows. In the near term, demand should remain healthy as retail, electronics, and manufacturing players continue to professionalize their return and recovery processes. Looking ahead, the market has a positive outlook because digitalization, automation, and analytics are improving efficiency and making reverse logistics more commercially attractive. Overall, China’s reverse logistics market is evolving from a back-end cost center into a strategic capability that supports customer satisfaction, sustainability, and value recovery.
Key Report Takeaways
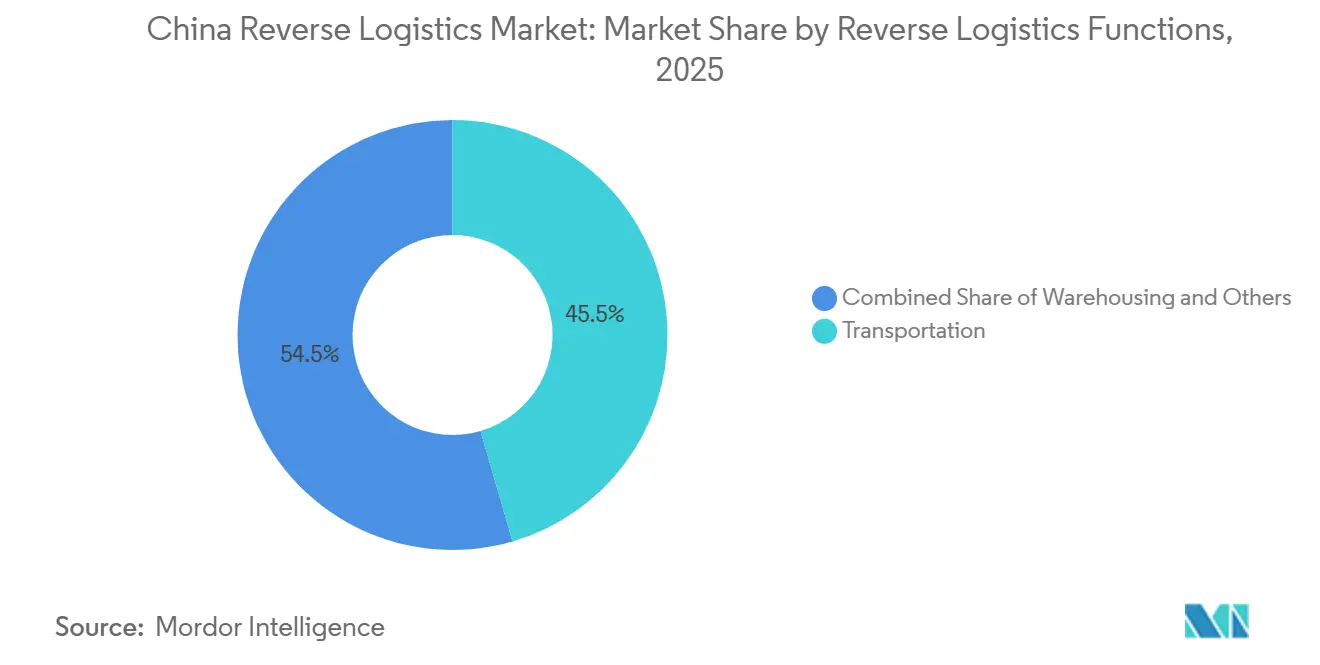
- By reverse logistics function, transportation led with 45.50% of China reverse logistics market share in 2025, while warehousing is forecast to expand at an 18.09% CAGR through 2031.
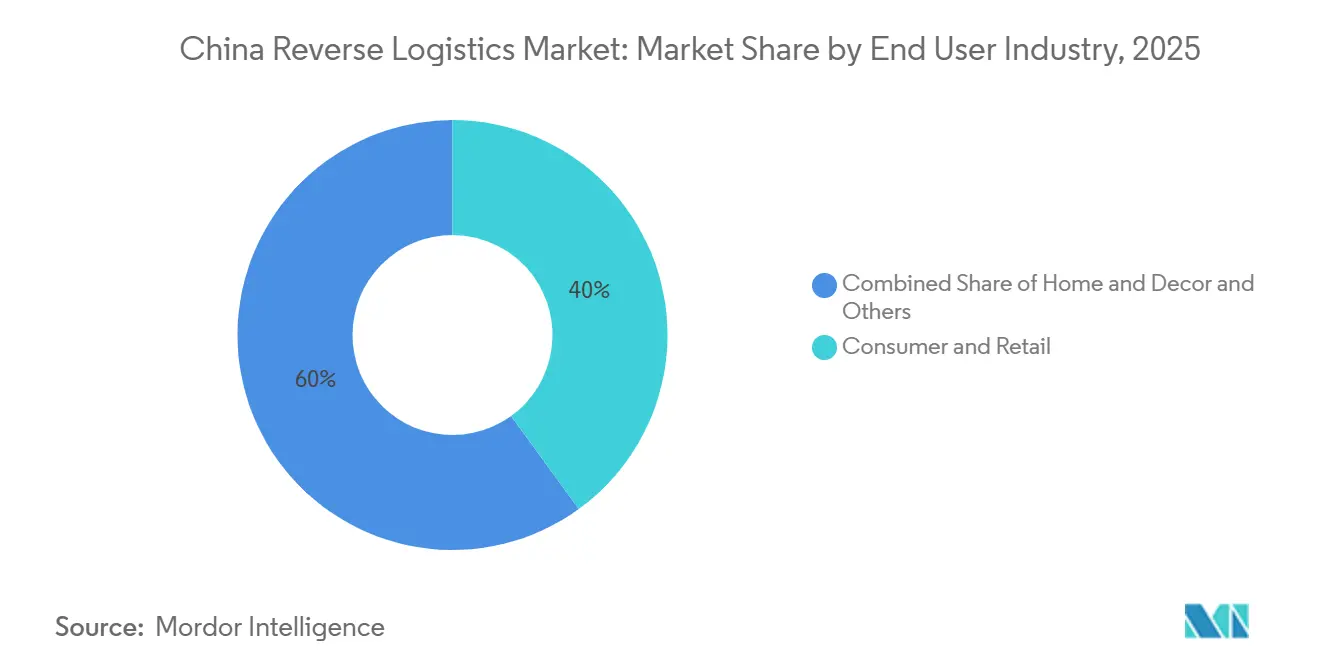
- By end-user industry, consumer and retail held 40% of China reverse logistics market size in 2025, while healthcare and pharmaceutical recorded the highest projected CAGR at 20.26% through 2031.
- By geography, East China accounted for 59.07% of China reverse logistics market share in 2025, while Northwest China is advancing at a 15.15% CAGR through 2031.
Note: Market size and forecast figures in this report are generated using Mordor Intelligence’s proprietary estimation framework, updated with the latest available data and insights as of January 2026.
China Reverse Logistics Market Trends and Insights
Drivers Impact Analysis*
| Driver | (~) % Impact on CAGR Forecast | Geographic Relevance | Impact Timeline |
|---|---|---|---|
| Rising E-Commerce Return Volumes And Refund Expectations | +2.8% | East, South, North, with secondary effects nationwide | Short term (≤ 2 years) |
| Circular Economy And Producer Responsibility Pressures | +1.5% | National, with compliance hotspots in manufacturing-heavy coastal provinces | Medium term (2-4 years) |
| EV Battery, Electronics, And High-Value Asset Take-Back Flows | +2.0% | National, with early concentration in East, South, and Northwest NEV production hubs | Short-term (≤ 2 years) and medium-term (2-4 years) |
| Urban Consolidation Needs Across Tiered Distribution Hubs | +1.2% | Tier-2 and Tier-3 cities in Central, Southwest, and Northwest China | Medium term (2-4 years) |
| Digitized Return Authorization And Visibility Expectations | +1.0% | East, North, South, in tech-forward platform ecosystems | Short term (≤ 2 years) |
| Cross-Border Return Complexity From International E-Commerce | +0.9% | East coastal export hubs and Northwest inland BRI ports | Medium term (2-4 years) |
| Source: Mordor Intelligence | |||
Rising E-Commerce Return Volumes and Refund Expectations
China’s very large online retail base continues to send high volumes of returns into the Country's reverse logistics market. Online retail sales reached USD 2.16 trillion in 2024, which kept parcel density high across the country’s main consumption corridors. Faster refunds and easier returns promises are making merchants treat returns as a core service requirement rather than a side process. That shift is pushing more sellers to outsource pickup, sorting, and disposition work to specialist providers across the China reverse logistics market.
Circular Economy and Producer Responsibility Pressures
Circularity and recovery programs are creating a more durable demand layer in the China reverse logistics market. China’s battery-tracking push and broader formalization of recycling are moving product recovery into more structured channels[1]Source: Xinhua, “China Rolls Out Battery Tracking System for EV Lifecycle Management,” China EV Home, chinaevhome.com. JD Logistics deployed 500,000 reusable cold-chain delivery boxes in June 2025, demonstrating that large-scale packaging reuse is already embedded in logistics operations. These programs create recurring collection, sorting, reuse, and recovery work that lasts throughout product life cycles rather than just during a single sales event. That makes this demand base steadier and helps support long-term capacity build-out in the China reverse logistics market.
EV Battery, Electronics, and High-Value Asset Take-Back Flows
Automotive take-back is becoming one of the highest-value streams in the China reverse logistics market. China’s comprehensive utilization volume of retired NEV batteries exceeded 400,000 tons in 2025, up 32.9% year on year. The national traceability platform is making battery custody and recovery more visible across the full product life cycle. This raises the value of certified handling, compliant storage, and documented recovery processes. As battery retirements continue to build, the automotive sector should remain a major growth stream in the China reverse logistics market.
Urban Consolidation Needs Across Tiered Distribution Hubs
Return parcels arrive from scattered consumer locations, so the China reverse logistics market depends on regional consolidation before testing, grading, or resale becomes economical. Inland and border-facing hubs are receiving fresh investment that supports this operating model. Xi’an’s CNY 120 million (USD 17.72 million) investment in the Sinotrans Northwest International Air Freight Distribution Center, equal to USD 17 million, shows how intermodal capacity is being built where inbound and outbound flows can be pooled. CEVA’s automated distribution center in Alashankou adds another example of infrastructure designed for faster sorting and consolidation near a growing cross-border corridor. As lower-tier cities generate more returns, these investments should reduce unit costs and broaden service coverage across the China reverse logistics market.
Restraints Impact Analysis*
| Restraint | (~) % Impact on CAGR Forecast | Geographic Relevance | Impact Timeline |
|---|---|---|---|
| High Cost Of Sorting, Testing, And Refurbishment | -1.8% | National, concentrated in the East for high-volume categories | Short term (≤ 2 years) |
| Fragmented Regional Service Standards And Operating Complexity | -1.2% | The Central, Southwest, and Northwest regions lack standardized SLA frameworks. | Medium term (2-4 years) |
| Margin Erosion On Low-Value, High-Volume Returns | -0.9% | National, most acute for apparel and FMCG categories | Short term (≤ 2 years) |
| Data Sharing, Custody, And Chain-Of-Responsibility Risks In Multi-Party Returns | -0.6% | National, across cross-platform and cross-carrier flows | Medium term (2-4 years) |
| Source: Mordor Intelligence | |||
High Cost of Sorting, Testing, and Refurbishment
Cost recovery remains a core limit in the China reverse logistics market. For many returned electronics, testing, triage, and refurbishment can consume 30% to 40% of the resale value, leaving little room for operators without high-throughput automation. Caixin reported in June 2026 that less than 30% of retired EV power batteries were collected through formal recycling channels, underscoring the ongoing struggle of compliant processing to overcome cost leakage and informal competition[2]Source: Caixin Global, “In Depth, As Retired Battery Wave Approaches, China Moves to Clean Up Recycling,” Caixin Global, caixinglobal.com. Lithium price swings add another layer of pressure because lower recovered material values weaken the economics of formal processing. The result is that scale players hold up better, while smaller firms in the China reverse logistics market continue to face margin pressure.
Fragmented Regional Service Standards and Operating Complexity
Service quality still differs sharply across regions in the China reverse logistics market. East China has faster consolidation, stronger warehouse automation, and more standardized workflows than many parts of the Southwest and Northwest. That gap makes it harder for merchants to offer the same return experience nationwide. For multinational operators, the challenge extends to environmental, safety, and customs compliance across multiple local jurisdictions. Nippon Express addressed this in December 2025 by obtaining ISO 14001:2015 and ISO 45001:2018 certifications across its China operations, a step that smaller regional providers often cannot match.
*Our forecasts treat driver/restraint impacts as directional, not additive. The impact forecasts reflect baseline growth, mix effects, and variable interactions.
Segment Analysis
By Reverse Logistics Function: Warehousing Gains Ground on a Transport-Led Market
Transportation held 45.50% of the China reverse logistics market share in 2025, indicating that much of the activity still sits in pickup, line-haul, and consolidation work. Road networks carry most of these flows because returns arise across dense city clusters and dispersed suburban demand points. Air remains important for time-sensitive electronics and pharmaceutical returns where speed and custody matter more than cost. Other modes remain smaller, but rail and intermodal options are gaining relevance where cross-border or long-distance return movements need lower-cost alternatives.
Warehousing is forecast to expand at 18.09% CAGR, the fastest pace in this segmentation, and a clear sign that value recovery is becoming more important in the China reverse logistics market. More returns are now being stored, graded, consolidated, and redirected to specialized processing centers rather than simple delivery stations. Other value-added services are also strengthening, as merchants need restocking, refurbishment, and disposition support within a single operating chain. This is shifting the China reverse logistics industry toward integrated platforms that combine transport with disciplined processing.


By End-user Industry: Specialized Healthcare Returns Driving High-Growth Reverse Logistics Demand
Consumer and retail accounted for 40% of the China reverse logistics market size in 2025, keeping this segment at the center of overall demand. The scale comes from online retail returns, where short product cycles and easy refund expectations create constant parcel movement. Healthcare and pharmaceuticals remain smaller, but they offer more specialized work because returns require stricter handling, documentation, and temperature control. FMCG activity stays volume-heavy and cost-sensitive, with most work tied to expiry management, damaged inventory, and promotional overstocks.
Healthcare and pharmaceutical is projected to grow at a 20.26% CAGR through 2031, making it the fastest-growing end-user segment in the China reverse logistics market. The driver is battery take-back rather than vehicle returns, as earlier EV sales begin feeding larger volumes of batteries into formal recovery channels. That shift is raising the need for certified transport, traceability, and compliant storage across the China reverse logistics industry. Home and Decor remains operationally distinct because bulky returns need specialized handling assets and create higher per-unit reverse costs.
Geography Analysis
East China remained the core region of the China reverse logistics market in 2025, with 59.07% share supported by the Yangtze River Delta’s dense merchant and warehouse base. Return loops are shorter in this corridor because major marketplaces, sellers, and resale channels are concentrated around Shanghai, Hangzhou, Suzhou, and Ningbo. China expanded its cross-customs-district return model nationwide from April 1, 2026, which allows eligible cross-border e-commerce return goods to enter at any customs port rather than only at the original export location. That policy should keep East China in a strong position in the China reverse logistics market, as its ports and processing infrastructure are already well-suited for high-volume trade.
Northwest China is projected to expand at 15.15% CAGR through 2031, making it the fastest-growing geography in the China reverse logistics market. Xinjiang’s hubs at Urumqi, Horgos, and Alashankou are moving beyond transit roles and are becoming more bidirectional trade nodes. Alashankou’s 2025 throughput and the rise in Horgos train movements show that these corridors are now large enough to generate meaningful cross-border return, redistribution, and damage-handling work[3]Source: CGTN, “How Horgos Is Redefining China’s Frontier in 2026,” CGTN, news.cgtn.com. Xi’an’s logistics hub build-out, including the Sinotrans Northwest International Air Freight Distribution Center and SF Express smart export infrastructure at Xianyang Airport, shows that capacity is being added ahead of sustained demand. This gives the China reverse logistics market a stronger inland processing base than it had only a few years ago.
Central and Southwest China are still growing from a lower infrastructure base, and capacity often lags local demand by 1 to 2 cycles. Central China has a natural consolidation role because it sits between the coastal manufacturing belt and the inland consumption belt. Southwest China is also gaining from stronger rail and multimodal connectivity that support domestic redistribution and cross-border handling. Northeast China remains a stable but slower-moving part of the China reverse logistics market because industrial and automotive components still drive demand more than consumer returns.
Competitive Landscape
The China reverse logistics market remains moderately fragmented, with domestic carriers strongest in e-commerce returns and global 3PL operators more visible in regulated categories. JD Logistics, SF Holdings, and the Tongda networks benefit from route density, integrated fulfillment infrastructure, and established merchant relationships. The January 2026 cross-shareholding agreement between SF Holding and J&T Express showed how leading firms are extending reach beyond China to support wider return corridors[4]Source: SF Holding, “SF Holding and J&T Express Enter Subscription Agreement to Advance International Strategy and Enhance Global Logistics Presence,” PR Newswire APAC, prnewswire.com. This raises the competitive bar in the China reverse logistics market, as merchants increasingly seek a single provider for both domestic and cross-border flows.
Technology and facility upgrades are also reshaping competition in the China reverse logistics market. CEVA opened a fully automated 4,300 m²distribution center in Alashankou in May 2026, using electric autonomous forklifts and real-time customs monitoring for the China-Central Asia corridor. FedEx upgraded its largest East China station in Shanghai in May 2026 to sort 3,000 parcels per hour and process nearly 12 tons of freight daily. FedEx also signed a strategic memorandum with China Southern Air Logistics in June 2026 to expand cargo capacity and network efficiency from Guangzhou. These moves show that speed, automation, and border-compliant handling are becoming stronger differentiators than basic transport capacity alone.
Partnership models are also expanding as retailers and brands seek logistics execution and market access within a single structure. JD.com and DHL Group signed a memorandum of understanding in February 2026 to support end-to-end solutions for German brands moving between China and Europe. Kuehne+Nagel also expanded its partnership with MTU Maintenance Lease Services in 2025 with a new aerospace parts fulfillment center in Zhuhai. As a result, the China reverse logistics market still has room for specialists, but scale operators with automation and compliance depth are strengthening their relative position.
China Reverse Logistics Industry Leaders
JD Logistics, Inc.
SF Holdings Co., Ltd.
Cainiao Network
YTO Express Group Co., Ltd.
ZTO Express (Cayman) Inc.
- *Disclaimer: Major Players sorted in no particular order

Recent Industry Developments
- June 2026: FedEx Corporation and China Southern Air Logistics signed a Strategic Memorandum of Understanding in June 2026, formally establishing a strategic cooperation relationship focused on expanding air cargo capacity and global network efficiency.
- May 2026: CEVA Logistics opened a fully automated 4,300-m²distribution center in the Alashankou Free Trade Zone (Northwest China), located 15 minutes from the Kazakhstan border. The facility uses electric autonomous forklifts and AI-based measurement technologies, completing cargo consolidation and transit in as little as 6 to 12 hours.
- May 2026: FedEx upgraded its 4,400 m² Chunyun Road station in Shanghai, its largest station in East China. The facility can sort up to 3,000 parcels per hour, uses automated dimension-and-weight capture, and supports inbound and outbound parcel handling, improving regional processing capacity, and supports reverse logistics.
- February 2026: JD.com and DHL Group signed a Memorandum of Understanding to facilitate end-to-end integrated logistics solutions for German brands entering China and accessing European markets via JD.com's Joybuy platform. DHL and JD Logistics will collaborate on fulfillment, customs clearance, and delivery services, offering merchants a preferential B2C shipment duty scheme.


China Reverse Logistics Market Report Scope
| Transportation | Road |
| Air | |
| Other Modes | |
| Warehousing (Storage, Distribution, Consolidation) | |
| Other Value-added Services (Return Processing, Restocking, Refurbishment, Disposition) |
| Consumer and Retail |
| Home and Decor |
| Healthcare and Pharmaceuticals |
| FMCG |
| Other End Users |
| North |
| Northeast |
| East |
| Central |
| South |
| Southwest |
| Northwest |
| By Reverse Logistics Function | Transportation | Road |
| Air | ||
| Other Modes | ||
| Warehousing (Storage, Distribution, Consolidation) | ||
| Other Value-added Services (Return Processing, Restocking, Refurbishment, Disposition) | ||
| By End-user Industry | Consumer and Retail | |
| Home and Decor | ||
| Healthcare and Pharmaceuticals | ||
| FMCG | ||
| Other End Users | ||
| By Region | North | |
| Northeast | ||
| East | ||
| Central | ||
| South | ||
| Southwest | ||
| Northwest |


Key Questions Answered in the Report
What is the projected size of China reverse logistics by 2031?
The China reverse logistics market is projected to reach USD 250.56 billion by 2031, rising from USD 141.67 billion in 2026 at a 12.08% CAGR.
Which function leads current demand in China?
Transportation leads with a 45.50% share in 2025 because pickup, line-haul, and consolidation still account for the majority of operating activity.
Which end-user category is growing the fastest?
Automotive is the fastest-growing end-user stream, with a projected 20.26% CAGR through 2031, driven by battery take-back and formal recovery needs.
Which region dominates return logistics in China today?
East China leads with a 59.07% share in 2025 due to its dense merchant base, stronger warehouse infrastructure, and proximity to major resale channels.
Which region is expanding the fastest?
Northwest China is forecast to grow at 15.15% CAGR through 2031 as Horgos, Alashankou, and Xi’an add more cross-border and inland logistics capacity.
What is changing competition among logistics providers in China?
Competition is shifting toward automation, compliance depth, and cross-border reach, as shown by CEVA’s Alashankou expansion, FedEx’s Shanghai upgrade, and the SF Holding and J&T Express alliance.
Page last updated on:


