
India Intra-city Logistics Market Size and Share
Market Overview
| Study Period | 2020 - 2031 |
|---|---|
| Forecast Data Period | 2026 - 2031 |
| Base Year Market Size (2025) | USD 33.5 Billion |
| Market Size (2026) | USD 34.93 Billion |
| Market Size (2031) | USD 43.06 Billion |
| Growth Rate (2026 - 2031) | 4.26 % |
| Market Concentration | Low |
Major Players
*Disclaimer: Major Players sorted in no particular order Image © Mordor Intelligence. Reuse requires attribution under CC BY 4.0. |
|
India Intra-city Logistics Market Analysis by Mordor Intelligence
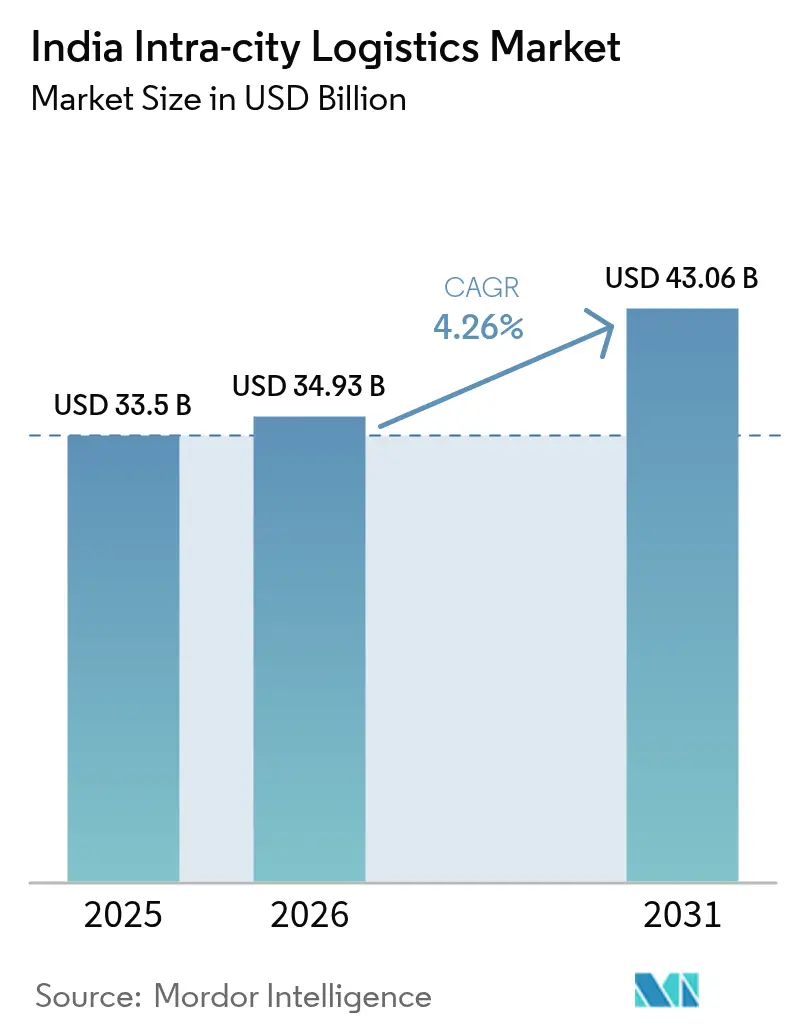
The India Intra-city Logistics Market size in 2026 is estimated at USD 34.93 billion, growing from 2025 value of USD 33.5 billion with 2031 projections showing USD 43.06 billion, growing at 4.26% CAGR over 2026-2031.
Increased e-commerce volumes, government infrastructure programs, and rapid technology adoption underpin this growth, although urban congestion and a fragmented small-fleet operator base continue to pressure margins. Transportation services remain the revenue cornerstone, quick-commerce drives demand for same-day delivery, and policy initiatives such as PM-Gati Shakti are steering investment toward multimodal networks that connect urban nodes more efficiently. Tier-1 metros still dominate activity, but Tier-3 cities are scaling faster on the back of retail digitalization, prompting operators to diversify their geographic footprints. Consolidation, reflected in acquisitions like Delhivery’s purchase of Ecom Express, signals a shift toward integrated platforms able to provide end-to-end urban fulfillment.
Key Report Takeaways
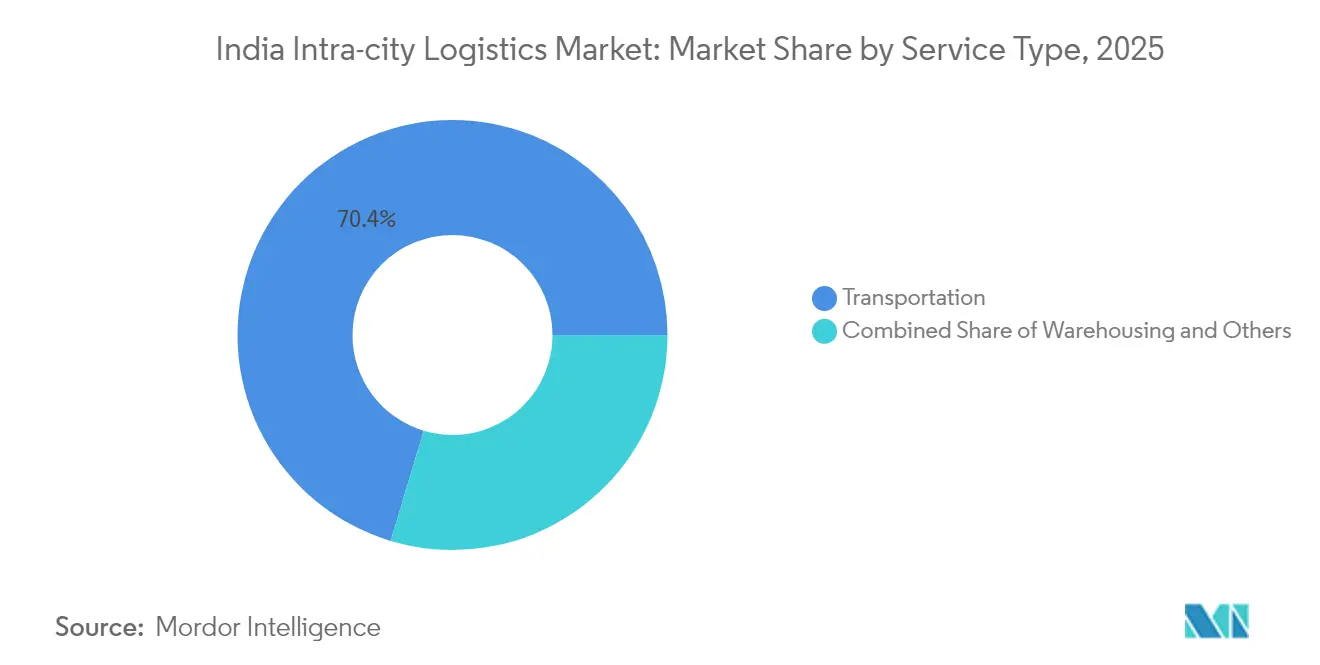
- By service, transportation captured 70.35% of the India intra-city logistics market share in 2025, while value-added services are forecast to grow at a 3.67% CAGR through 2031.
- By business model, the B2C segment held 58.30% of the India intra-city logistics market size in 2025 and C2C is projected to expand at a 3.38% CAGR during 2026-2031.
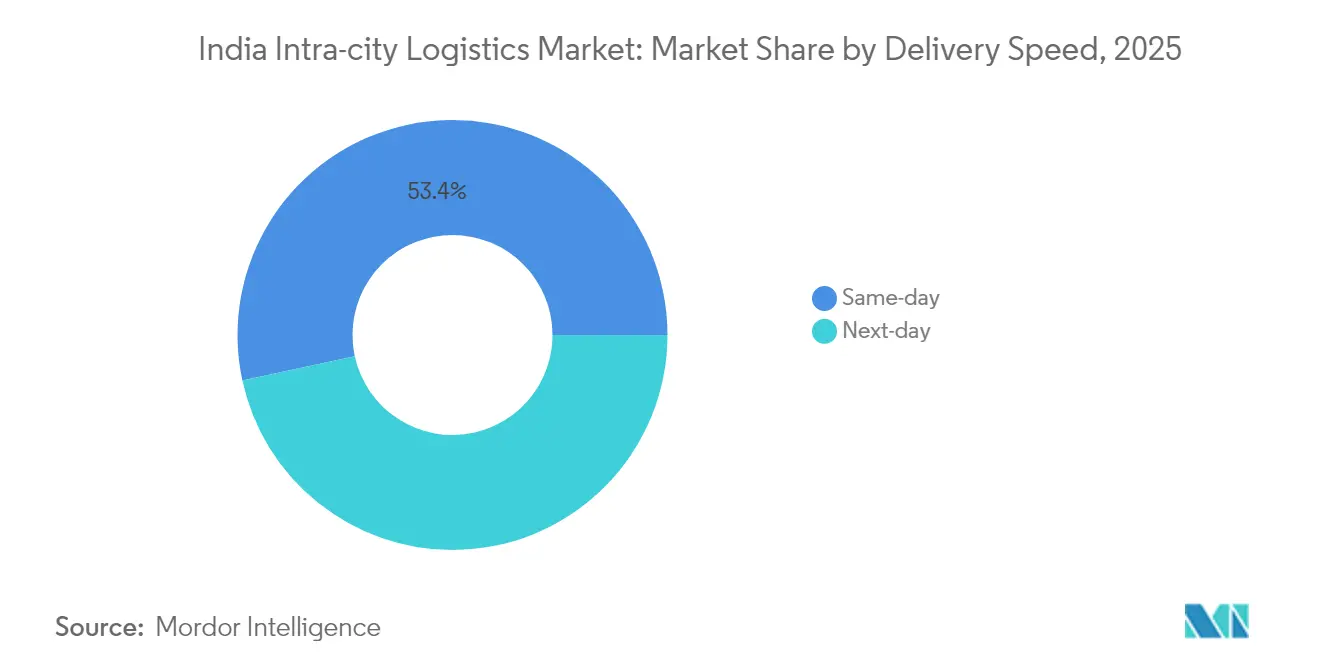
- By delivery speed, same-day services accounted for 53.40% of the India intra-city logistics market share in 2025 and lead growth at a 4.41% CAGR through 2031.
- By end-user, e-commerce retail represented 46.62% of the India intra-city logistics market size in 2025 and is advancing at a 4.73% CAGR to 2031.
- By geography, Tier-1 metros contributed 58.40% revenue share in 2025, whereas Tier-3 cities are registering the highest 4.32% CAGR during the forecast period.
Note: Market size and forecast figures in this report are generated using Mordor Intelligence’s proprietary estimation framework, updated with the latest available data and insights as of 2026.
India Intra-city Logistics Market Trends and Insights
Drivers Impact Analysis*
| Driver | % Impact on CAGR Forecast | Geographic Relevance | Impact Timeline |
|---|---|---|---|
| Explosive e-commerce parcel growth | +1.2% | Global, with concentration in Tier-1 metros and rapid Tier-2/3 expansion | Medium term (2-4 years) |
| National Logistics Policy & PM-Gati Shakti implementation | +0.8% | National, with early gains in Delhi NCR, Mumbai, Bengaluru | Long term (≥ 4 years) |
| Urban consolidation centres mandated in city-freight master plans | +0.6% | Tier-1 metros, expanding to major Tier-2 cities | Medium term (2-4 years) |
| Tier-2/3 city retail digitalisation wave | +0.7% | APAC core, spill-over to smaller urban centers | Short term (≤ 2 years) |
| Rapid electrification of last-mile fleets | +0.5% | National, with pilot programs in major metros | Long term (≥ 4 years) |
| ONDC-driven open logistics interoperability | +0.4% | National, with early adoption in tech-forward cities | Medium term (2-4 years) |
| Source: Mordor Intelligence | |||
Explosive E-commerce Parcel Growth
Same-day delivery seized 54.0% of the delivery-speed segment in 2024, underscoring consumer expectations for immediacy and fueling the India intra-city logistics market. Quick-commerce firms such as Zepto and Blinkit are leasing Grade A warehouses, pushing nationwide demand beyond 300 million sq ft by 2025. The proliferation of micro-fulfillment centers is redefining last-mile routing, shrinking travel distances, and elevating real-time visibility as an operational imperative. Logistics providers are deploying AI-enabled dispatch tools to optimize fleet utilization and ensure turn-around times under thirty minutes. E-commerce’s 47.0% end-user share establishes it as the pivotal growth catalyst for urban delivery investments[1]“$350 Million Loan Signing Between Government of India and ADB,” Press Information Bureau, pib.gov.in.
National Logistics Policy and PM-Gati Shakti Implementation
Government programs are modernizing multimodal infrastructure and digital governance. The USD 350 million SMILE loan signed in December 2024 is financing smart systems and standard warehousing frameworks that reduce hand-off delays in the India intra-city logistics market. ULIP surpassed 100 crore API calls in March 2025, evidencing rapid data interoperability that cuts paperwork and accelerates vehicle clearances. Multi-modal logistics parks under PM-Gati Shakti link city distribution networks with rail and expressways, trimming first-mile to last-mile transit times. These structural upgrades help the sector move toward the National Logistics Policy target of lowering logistics cost from 14% to 8% of GDP, creating headroom for price competitiveness in urban freight[2]“Warehousing Demand, Rents Witness Surge,” Business Standard, business-standard.com.
Urban Consolidation Centers Mandated in City-Freight Plans
Metropolitan master plans now require consolidation hubs on city fringes to streamline inbound freight. Facilities adjacent to new corridors, including Mumbai Trans Harbour Link and Delhi’s Dwarka Expressway, channel palletized loads into smaller electric vans for the final mile. This hub-and-spoke logic reduces vehicle trips inside congested cores, easing curb scarcity and emissions. Public-private partnerships manage land pooling, while operators deploy slot-booking apps that allocate dock times in ten-minute windows to curb dwell. Early results in Delhi NCR show a 12% reduction in intra-day traffic peaks, supporting smoother parcel flows and higher on-time delivery metrics.
Tier-2/3 City Retail Digitalization Wave
Increasing smartphone penetration and fintech adoption are propelling online commerce in Bhopal, Coimbatore, Surat, and other midsize cities. These centers post the fastest 4.40% CAGR within the India intra-city logistics market as SMEs migrate to online storefronts. Logistics firms that establish micro-hubs early gain cost-advantaged routes and first-mover brand loyalty. Local governments are extending warehousing incentives and simplified zoning clearances, compressing deployment timelines from eighteen to twelve months. Operators are also piloting electric two-wheelers tailored for narrow lanes, lowering delivery costs while meeting sustainability mandates.
Restraints Impact Analysis*
| Restraint | % Impact on CAGR Forecast | Geographic Relevance | Impact Timeline |
|---|---|---|---|
| Severe urban traffic congestion & curb scarcity | -0.9% | Tier-1 metros, expanding to major Tier-2 cities | Short term (≤ 2 years) |
| Hyper-fragmented small-fleet operator base | -0.6% | National, with concentration in urban centers | Medium term (2-4 years) |
| Rising land & compliance costs for micro-fulfilment sites | -0.7% | Tier-1 metros and high-growth Tier-2 cities | Long term (≥ 4 years) |
| Pending gig-worker safety / social-security mandates | -0.4% | National, with immediate impact in organized sector | Short term (≤ 2 years) |
| Source: Mordor Intelligence | |||
Severe Urban Traffic Congestion and Curb Scarcity
Delivery vans face average speeds below 15 km/h in Mumbai and Bengaluru rush hours, eroding fleet productivity and inflating fuel bills. Land transactions climbed to 2,335 acres across 23 cities in 2024, with prices escalating to INR 17 crore per acre USD 20.3 million after conversion complicating terminal development. Scarce loading bays force double-parking that attracts fines and escalates turnaround times. While infrastructure mega-projects pledge relief, their commissioning schedules stretch beyond immediate operational horizons, compelling carriers to overlay dynamic routing software and night-time delivery slots to navigate congestion[3]"Department of Posts and Amazon Sign Landmark MoU to Enhance Logistics Collaboration." Ministry of Communications, Press Information Bureau, pib.gov.in.
Pending Gig-Worker Safety / Social-Security Mandates
Implementation of the Code on Social Security 2020 extends EPFO and insurance benefits to 3 million platform riders. Compliance could add 15-20% to payroll outlays for organized logistics firms, compressing margins in the India intra-city logistics market. Operators must introduce accident-cover premiums, digital attendance systems, and grievance redressal portals. Smaller fleets struggle with administrative overhead, accelerating industry consolidation as larger platforms absorb stand-alone bike owners and standardize benefits programs to retain labor supply.
*Our forecasts treat driver/restraint impacts as directional, not additive. The impact forecasts reflect baseline growth, mix effects, and variable interactions.
Segment Analysis
By Service: Transportation Dominance Amid Value-Added Growth
Transportation retained 70.35% of the India intra-city logistics market share in 2025, driven by the non-discretionary need for urban freight movement. Growth continues as e-commerce volumes climb and food delivery scales across metros and Tier-2 towns. Warehousing and distribution services are expanding steadily, supported by urban consolidation centers that act as staging points for micro-fulfillment. The value-added segment, while smaller today, is registering a 3.67% CAGR as customers demand reverse logistics, real-time tracking, and white-glove services.
Digitization is reshaping service economics. AI-enabled route optimization lifts vehicle utilization, while automated invoicing reduces back-office cycles for mid-tier operators. The India intra-city logistics industry increasingly bundles transport with inventory management, enabling shippers to outsource integrated workflows. Environmental compliance is another catalyst: shippers value partners that certify fleets to BS6 norms and deploy electric vans, positioning value-added services as a differentiator in contract bids.



By Business Model: B2C Leadership with C2C Emerging
The B2C model dominated the India intra-city logistics market with 58.30% revenue contribution in 2025, a direct result of e-commerce acceleration and consumer preference for doorstep delivery. Amazon’s partnership with Indian Railways, scaling to 120+ intercity routes, illustrates how large platforms integrate national trunk routes with city distribution. B2B shipments remain significant, especially for FMCG and pharma, but their growth is slower relative to retail parcels.
C2C deliveries, although only a single-digit share today, are accelerating at 3.38% as ONDC’s open logistics layer levels entry barriers. Individuals selling on social media can now tap standard parcel networks at near enterprise rates, expanding peer-to-peer shipment volumes. For logistics companies, C2C represents an incremental utilization lever, filling backhaul capacity and smoothing peak workloads.
By Delivery Speed: Same-Day Services Lead Innovation
Same-day offerings held 53.40% of the India intra-city logistics market in 2025 and are projected to grow fastest at 4.41% CAGR. Micro-fulfillment centers within 3-5 km of dense residential clusters enable 30-minute drop-offs for grocery and pharmacy orders. Operators deploy AI to batch orders geographically, cutting dwell time at pick-up nodes.
Next-day (24-48 hour) services sustain relevance for bulkier SKUs and remote suburbs where same-day economics are challenging. Platforms like cityXfer specialize in large-format goods, achieving lower damage rates through trained crews and custom rigging. Market differentiation hinges on service reliability and transparent ETAs rather than speed alone, nudging carriers to invest in IoT tags and customer-facing apps that provide real-time van locations.
By End-user Industry: E-commerce Retail Drives Market Evolution
E-commerce retail accounted for 46.62% of the India intra-city logistics market size in 2025 and is forecast to post a 4.73% CAGR to 2031. Fashion, beauty, and electronics lead SKU throughput, but grocery and health staples are climbing due to consumer trust in online perishables. The healthcare segment gains traction through stringent cold-chain requirements that favor organized players with temperature-controlled micro-hubs.
Reverse logistics is expanding alongside sales, particularly in apparel where return rates exceed 20%. Specialized providers offer doorstep quality checks and instant refunds, enhancing customer experience. White-goods and furniture categories drive demand for two-technician crews trained in assembly and reverse pickup, adding complexity but also high-margin service layers within the India intra-city logistics industry.
Geography Analysis
Regional concentration remains pronounced, yet growth vectors are shifting. Northern and Western India, anchored by Delhi NCR and Mumbai Metropolitan Region, continue to command a large slice of the India intra-city logistics market. Delhi NCR topped 2024 real estate deals at 36 transactions, while Mumbai absorbed 407 acres of industrial land. Both regions benefit from expressways and port linkages that shorten inbound trunk hauls, feeding dense last-mile networks.
Southern states provide the next leg of expansion. Bengaluru’s tech-centric economy fuels premium parcel flows, and Hyderabad’s 340 km Regional Ring Road is opening greenfield corridors for Grade A sheds. Chennai and Delhi NCR together contributed about 50% of warehousing leasing in 2024, mirroring persistent demand for urban consolidation assets. State incentives for solar rooftops and EV charging encourage sustainable facilities that lower lifecycle costs.
The East, though smaller, is picking up speed on the back of port modernization in Kolkata and Paradip. Dedicated freight corridors under Act East policy unlock new hinterland access, letting shippers bypass congested trans-western routes. Odisha’s single-window clearance trims approval cycles for logistics parks, attracting first-wave investors targeting mineral-rich clusters and growing retail bases in Bhubaneswar and Cuttack. Each region’s trajectory underscores the need for network planners to maintain agile asset footprints aligned with local demand granularity.
Regulatory Landscape
The regulatory landscape for India intra-city logistics is shaped by national programs that standardize processes and improve multimodal coordination, led by DPIIT's Logistics Division and the PM Gati Shakti National Master Plan governance (including the Empowered Group of Secretaries). A key digital pillar is the Unified Logistics Interface Platform (ULIP), which the government positions as an interoperability layer to reduce documentation friction across logistics workflows.
In 2025-2026, policy actions also tightened and clarified operating frameworks that affect urban distribution networks connected to ports and rail. The Carriage of Goods by Sea Act, 2025 formalized carrier responsibilities and liabilities under bills of lading, while CBIC's nationwide rollout of Sea Cargo Manifest and Transhipment Regulations (SCMTR) continued with transition relief for electronic message filing extended up to 31 August 2026. For freight and containerized flows feeding city distribution, Indian Railways announced July 2026 reforms, including a unified Pan-India license for container train operators and simplified freight tariff structures, supporting smoother trunk-to-city transfers for integrated networks.
Value Chain Analysis
The intra-city logistics value chain in India typically starts with demand generation from e-commerce platforms, quick-commerce dark stores, retailers, SMEs, and enterprise shippers, followed by order orchestration (apps, dispatch engines, and customer-facing ETAs), pickup and first-mile collection, sorting or cross-docking at urban micro-hubs, and last-mile delivery using two-wheelers, three-wheelers, LCVs, and increasingly electric light vehicles. In parallel, returns processing and reverse logistics are gaining weight, requiring doorstep inspection, resale grading, and re-injection into inventory or onward movement to refurbishment and liquidation channels.
Upstream and enabling layers include fleet owners and driver-partners, leasing and facility developers for micro-fulfillment sites, vehicle OEMs and EV ecosystem partners (charging, batteries), and government digital and infrastructure platforms that reduce coordination costs. PM Gati Shakti has integrated 57 central ministries and departments with over 1,700 data layers (as of November 2025), supporting more coordinated planning of logistics parks, access roads, and multimodal nodes that ultimately shape intra-city feed and evacuation. Bottlenecks increasingly sit beyond ports and terminals, including congestion on approach roads, limited parking and staging, and delays at container freight stations, pushing operators toward consolidation centers and time-slot based dock scheduling to protect delivery SLAs.
Competitive Landscape
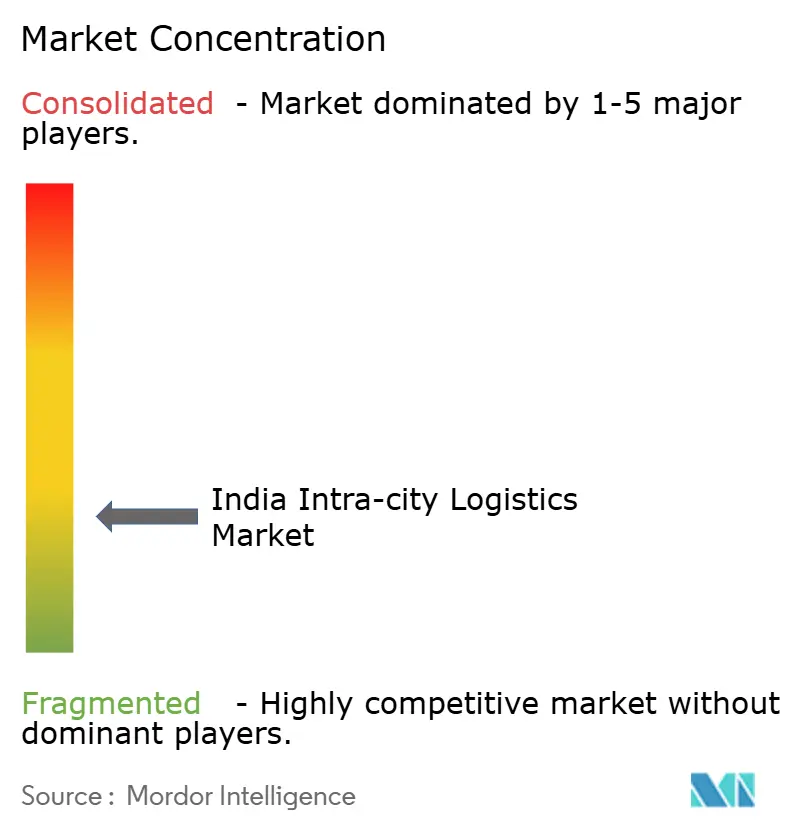
The India intra-city logistics market is moderately fragmented but consolidating as technology and compliance raise operating thresholds. Delhivery’s Rs 1,407 crore acquisition of Ecom Express enlarges its last-mile reach and diversifies service lines into Tier-3 geographies. Amazon’s deepening partnership with Indian Railways and India Post extends its access to 160,000 branch post offices, filling network gaps where private fleets are thin.
Digital interoperability via ONDC allows small courier firms to plug into unified routing stacks, intensifying price competition while widening parcel coverage. AI-centric specialists like COGOS Technologies use predictive analytics to match loads with idle capacity across 300+ cities, backed by recent seed funding that accelerates platform rollouts. Compliance with environmental norms and gig-worker safety regulations favors capitalized players that can fund BS6 fleet upgrades and social-security schemes, gradually edging out under-capitalized micro-operators.
As market leaders converge on integrated solutions, differentiation shifts to service quality and data transparency. Real-time tracking APIs, customer self-service dashboards, and carbon reporting modules are now baseline expectations in contract tenders. Alliances between freight tech startups and traditional 3PLs are proliferating to combine digital agility with asset density, shaping a landscape where scale and technology co-exist as twin pillars of competitive advantage.
India Intra-city Logistics Industry Leaders
-
Delhivery
-
Blue Dart Express
-
Shadowfax
-
Ekart Logistics
-
cityXfer
- *Disclaimer: Major Players sorted in no particular order

Market Opportunities and Future Outlook
A major opportunity area is tech-led formalization of MSME shipments and fleet utilization in Tier-2 and Tier-3 cities, where platform-based booking, dynamic pricing, and routing can replace ad-hoc contracting. Evidence of this shift includes findings from a C-DEP and IIT Delhi report (January 2026) that 71% of users and 97% of orders on tech-enabled intra-city logistics platforms are business-related, and that 95% of surveyed MSMEs reported improved on-time delivery. Operators that combine micro-hub footprints with app-based aggregation can use this demand profile to build denser routes, stabilize driver earnings, and layer value-added services such as COD reconciliation, returns pickup, and proof-of-delivery APIs.
Another whitespace sits at the interface of city logistics and national multimodal infrastructure, where digital integration and cleaner urban freight are becoming procurement differentiators. ULIP-driven interoperability and government pushes for standardization create room for logistics providers to productize integrations (FASTag, GPS, e-way bill, and enterprise ERP connectors) and sell them as part of contracted urban distribution. At the asset layer, the move toward electric last-mile fleets is translating into concrete deployments, including Delhivery's June 2026 initiative with Bajaj Auto to deploy Bajaj RIKI eCarts, supporting lower operating cost per drop in dense zones and aligning with emerging city-level air-quality constraints. In NCR, the policy discussion around shifting cargo from long-haul diesel trucks to electric trucks before entering Delhi, supported by proposed multimodal freight interchange hubs, highlights a pathway for consolidation-center operators and EV logistics specialists to partner with public agencies and large shippers on compliant urban freight corridors.
Recent Industry Developments
- June 2026: Delhivery partnered with Bajaj Auto to deploy 200 Bajaj RIKI eCarts for last-mile delivery in the first phase. The tie-up anchors Delhivery's electrification pathway for dense intra-city routes where stop-start utilization and curb access constraints shape unit economics. It also deepens collaboration between a logistics integrator and an OEM around purpose-built urban delivery vehicles.
- December 2025: Delhivery launched an on-demand intra-city shipping service in Mumbai and Hyderabad, following earlier rollouts in Delhi-NCR and Bengaluru. The expansion broadened the addressable base for intra-city, time-sensitive shipments beyond intercity parcel networks and strengthened Delhivery's play in same-day and hyperlocal use cases. Scaling across major metros also raises competitive pressure on incumbent intra-city aggregators and city courier networks.
- October 2024: Department of Posts and Amazon signed an MoU to expand parcel collaboration across 160,000 post offices. The agreement strengthened last-mile reach into dense urban neighborhoods and peripheral pin codes where private networks face higher marginal cost per delivery. It also reinforced India Posts role as a backbone partner for e-commerce-led intra-city distribution and returns.


Research Methodology Framework and Report Scope
Market Definition and Coverage
For this study, the Indian intra-city logistics market is defined as the paid movement and handling of goods within a city boundary, covering pickup, sorting, short-haul transport, and delivery that happen inside Indian urban areas.
Scope exclusions: We exclude inter-city line haul, international freight, and passenger mobility services that are not linked to goods movement.
Segmentation Overview
-
By Service
- Transportation
- Warehousing and Distribution
- Value-added Services
-
By Business Model
- B2B
- B2C
- C2C
-
By Delivery Speed
- Same-day (<24 h)
- Next-day (24-48 h)
-
By End-user Industry
- E-commerce Retail
- Fashion and Lifestyle
- Beauty, Wellness and Personal Care
- Home and Furniture
- Consumer Electronics and Appliances
- Healthcare and Medical Supplies
- Others
-
By City Tier
- Tier-1 Metros
- Tier-2 Cities
- Tier-3 and Below
Data Sources, Market Sizing, and Validation
Desk Research
Desk research was used to set the market boundary and to ground our assumptions on urban freight demand and operating economics. We referred to public sources such as the Ministry of Road Transport and Highways, the Ministry of Commerce and Industry (trade statistics), and the Reserve Bank of India for macro indicators that influence city deliveries. We also used publications from agencies like NITI Aayog and open city transport and freight documents released by municipal bodies where available.
To connect these data points to revenue pools, we reviewed company annual reports, investor decks, credible press coverage, and industry association updates on warehousing, express delivery, and e-commerce logistics activity. Where it helped, we also used paid subscriptions for company financials and intelligence, news and financials, and logistics supply chain and freight rate databases to cross-check price ranges and service mixes. The desk source list here is illustrative, and we also used additional public and paid references to collect data, validate assumptions, and clarify gaps.
Primary Interviews and Surveys
In India, we consult logistics operators, fleet owners, warehouse managers, shippers, and digital-commerce participants. Their input helps narrow delivery-distance, vehicle-utilization, pricing, service-mix, and city-tier assumptions. Follow-up discussions are used to resolve gaps in the desk evidence and explain differences between operating models.
Distribution of primary research fieldwork respondents
| Company type | Respondent position |
|---|---|
| Top tier: 26% | CXOs: 15% |
| Mid tier: 49% | Functional/Unit leaders: 30% |
| Smaller Players: 25% | Managers: 55% |
Market-Sizing & Forecasting
Sizing starts from a top-down build where urban consumption and delivery intensity are translated into an addressable intra-city demand pool, and then applied to service mixes that are commonly seen in Indian cities. The totals are corroborated using selective bottom-up checks, such as sampled price per delivery or per trip multiplied by observed volumes. We also run channel checks for warehousing and distribution charges, and use those results to tune the final number.
Key inputs in the model include e-commerce order momentum in major cities, same-day versus next-day service share, vehicle utilization and average trip length for intra-city runs, fuel and driver cost direction that influences pricing, and the split of revenue between pure transportation and warehousing or value-added services (like packaging and cash handling where applicable). Where full roll-ups are not feasible, missing values are handled with city tier proxies and sensitivity ranges that were tested with operators so extreme outputs could be avoided.
For forecasting, scenario analysis was used so we could reflect different demand paths for urban consumption and service speed adoption without relying on one straight-line growth assumption. Assumptions were then reviewed with primary respondents, and the forecast was adjusted where capacity additions, pricing resets, or regulatory shifts were expected to change near-term behavior.
Data Validation & Update Cycle
Outputs were validated through multiple checks, starting with internal consistency tests across service mix, pricing, and implied volume. We then compared the results to independent signals such as urban freight activity indicators and reported logistics performance commentary. When a variance was outside a reasonable range, the assumptions were reworked, and where needed we re-contacted the same expert types to confirm what changed and why.
Before sign-off, the model and narrative go through step-by-step analyst reviews, so calculation logic, unit handling, and currency conversion stay consistent. The report is refreshed annually, and interim updates are done when material events occur that can shift demand or pricing in the near term. Right before delivery, a final pass is performed to ensure clients receive the most current view available at the time.
Mordor Intelligence's Indian Intra City Logistics Market Estimate Compared With Other Published Estimates
Published market values for intra-city logistics in India can look far apart because the market boundary is not always treated the same, and because pricing and volume assumptions move quickly across city tiers. Differences also show up when one estimate uses a faster-growth scenario for e-commerce delivery density, while another stays closer to current utilization and rate cards.
The benchmark table shows a noticeable spread that mainly comes from what is included as intra-city revenue and how warehousing and value-added services are treated. In Mordor Intelligence's model, the count is limited to goods movement that stays within city limits, and service speeds and end-user mixes are validated through operator and shipper checks rather than assumed as a flat national average.
Benchmark comparison
| Source | Market Size | Gaps in Research Methodology |
|---|---|---|
| Mordor Intelligence | USD 33.50 B (2025) | |
| Industry Association A | USD 29.10 B (2025) | This estimate appears to emphasize core transportation revenue and may undercount warehousing and distribution fees that are bundled into intra-city contracts, which can lower the total in markets with mixed service offerings. |
| Global Consultancy B | USD 40.20 B (2025) | This figure likely uses a wider scope that blends intra-city with adjacent last-mile and inter-city legs in integrated networks, and it may apply aggressive urban order density and price escalation assumptions without city tier level calibration. |
Reading the table together, the lower figure is consistent with a narrower revenue definition, while the higher figure fits a broader logistics scope and stronger pricing assumptions. Our approach stays traceable because each step ties back to observable city activity, service mix, and practical price ranges, which makes the final number easier to explain and repeat when new inputs arrive.


Key Questions Answered in the Report
What is the current value of the India intra-city logistics market?
The market is valued at USD 34.93 billion in 2026 and is forecast to reach USD 43.06 billion by 2031.
Which service segment holds the largest share?
Transportation services command 70.35% of 2025 revenue, underscoring their central role in urban freight.
How fast is e-commerce retail driving growth?
E-commerce retail represents 46.62% of 2025 revenue and is expanding at a 4.73% CAGR through 2031.
Which delivery speed segment is growing the fastest?
Same-day delivery leads with 53.40% share and a 4.41% CAGR as consumers demand immediate fulfillment.
What government initiatives support the sector?
PM-Gati Shakti and the National Logistics Policy are investing in multimodal parks, digital platforms, and cost-reduction frameworks.
How is consolidation affecting competition?
Acquisitions like Delhivery’s takeover of Ecom Express are creating integrated platforms with wider geographic coverage and advanced technology.
Page last updated on:





