Market Overview
| Study Period | 2020 - 2031 |
|---|---|
| Forecast Data Period | 2026 - 2031 |
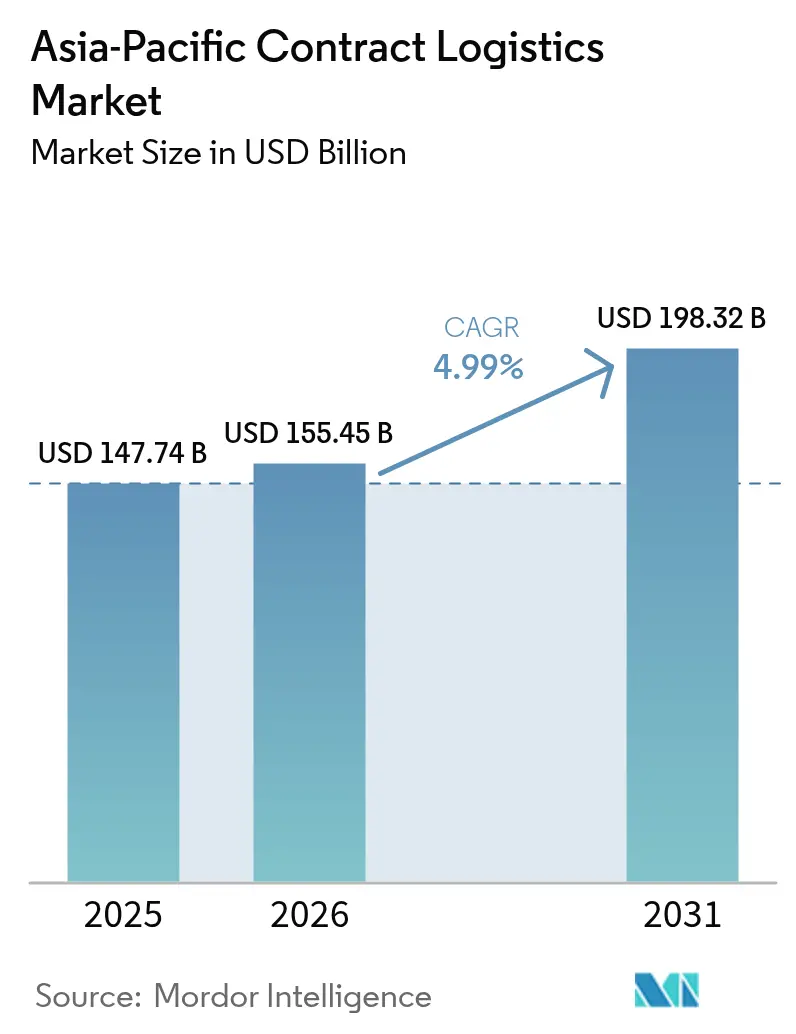
| Base Year Market Size (2025) | USD 147.74 Billion |
| Market Size (2026) | USD 155.45 Billion |
| Market Size (2031) | USD 198.32 Billion |
| Growth Rate (2026 - 2031) | 4.99% CAGR |
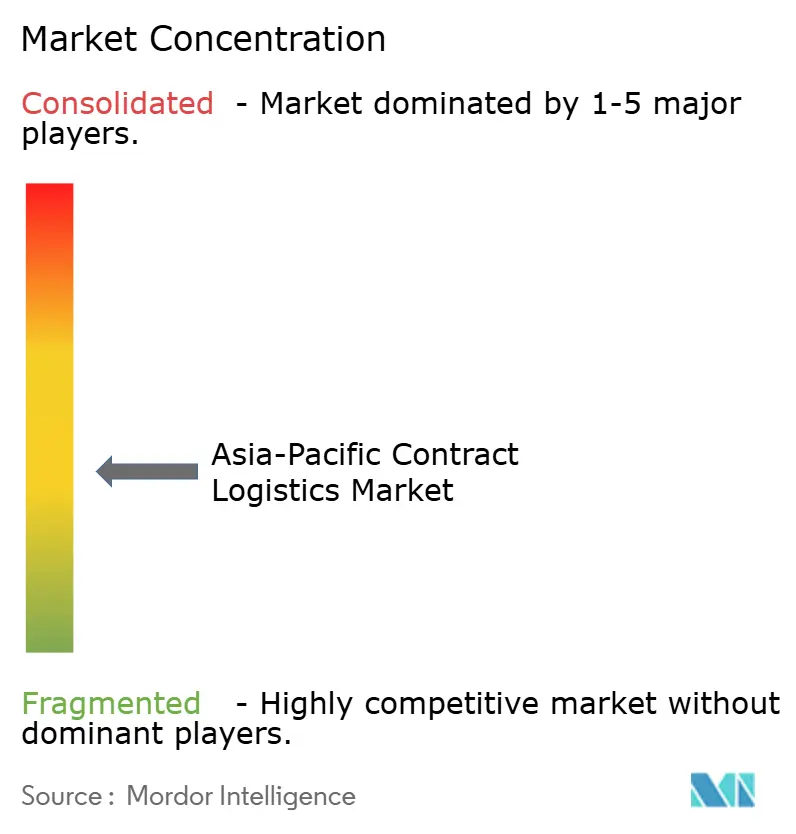
| Market Concentration | Medium |
Major Players *Disclaimer: Major Players sorted in no particular order Image © Mordor Intelligence. Reuse requires attribution under CC BY 4.0. | |
Asia-Pacific Contract Logistics Market Analysis by Mordor Intelligence
The Asia-Pacific contract logistics market size is projected to be USD 147.74 billion in 2025, USD 155.45 billion in 2026, and reach USD 198.32 billion by 2031, growing at a CAGR of 4.99% from 2026 to 2031.
Transportation services remained dominant, yet value-added modules, kitting, labeling, and reverse logistics are expanding faster as shippers seek deeper operational integration. Early tariff removal under the Regional Comprehensive Economic Partnership (RCEP) is redrawing intra-Asian freight patterns and lifting multi-country consolidation hub demand, while biologic pharmaceuticals are raising the bar on cold-chain compliance standards. Quick-commerce platforms have fragmented last-mile networks into dense micro-fulfillment nodes that require real-time orchestration, pushing 3PLs to invest in AI-enabled control towers for end-to-end visibility. Simultaneously, contracts longer than three years are gaining favor, allowing shippers to amortize warehouse automation and secure scarce capacity in tight real-estate markets.
Key Report Takeaways
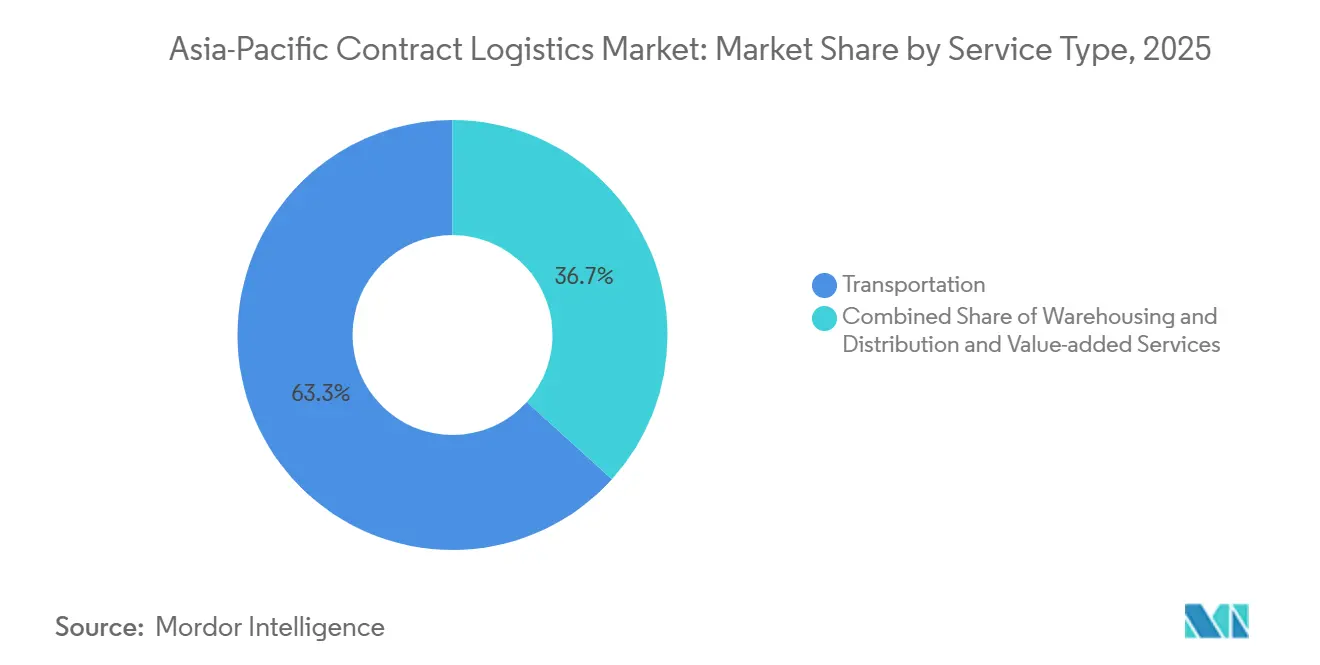
- By service type, transportation led with 63.3% market share of the Asia-Pacific Contract Logistics Market size in 2025, while value-added services are forecast to expand at a 5.22% CAGR through 2031.
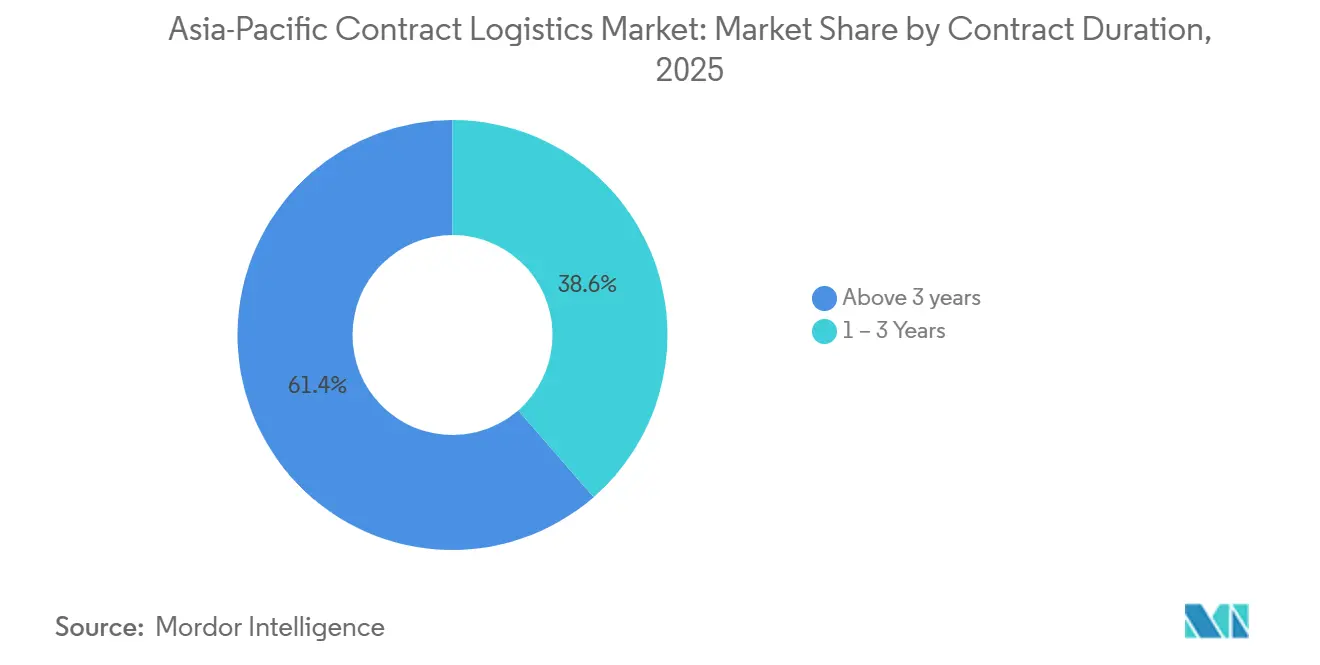
- By contract duration, agreements longer than three years held 61.4% of total engagements in 2025 and are advancing at a 5.1% CAGR to 2031.
- By end‑user industry, manufacturing and automotive accounted for 28.23% of the Asia-Pacific Contract Logistics Market share in 2025, while healthcare and pharmaceuticals are set to advance at a 5.5% CAGR through 2031.
- By country, China led with a 41.2% share in 2025; India is projected to record the fastest 5.77% CAGR through 2031.
Note: Market size and forecast figures in this report are generated using Mordor Intelligence’s proprietary estimation framework, updated with the latest available data and insights as of 2026.
Asia-Pacific Contract Logistics Market Trends and Insights
Drivers Impact Analysis*
| Driver | (~) % Impact on CAGR Forecast | Geographic Relevance | Impact Timeline |
|---|---|---|---|
| Autonomous delivery fleets require tech-integrated 3PL partnerships | +0.4% | China, Japan, South Korea, Singapore | Medium term (2-4 years) |
| Carbon-border adjustment drives low-emission networks | +0.5% | China, Japan, South Korea to EU lanes | Medium term (2-4 years) |
| RCEP-enabled trade surge fuels multi-country hubs | +0.8% | ASEAN core, China, South Korea, Japan | Medium term (2-4 years) |
| Biologic-heavy pharma build-outs need GDP-compliant logistics | +0.6% | China, India, Singapore, South Korea | Medium term (2-4 years) |
| Quick-commerce hyper-growth pushes micro-fulfillment outsourcing | +0.7% | Urban China, India, Indonesia, Philippines | Short term (≤ 2 years) |
| AI-powered control-tower visibility elevates integrated 3PLs | +0.5% | Japan, South Korea, Singapore | Long term (≥ 4 years) |
| Source: Mordor Intelligence | |||


RCEP-Enabled Surge in Intra-Asian Trade Spurring Multi-Country Consolidation Hubs
The elimination of tariffs on 92% of goods traded among RCEP’s 15 signatories lifted intra-RCEP merchandise trade to USD 2.8 trillion in 2025, an 8.3% jump. Manufacturers now distribute production steps across several RCEP economies, forcing contract logistics providers to establish bonded hubs in Haiphong, Laem Chabang, and Johor Bahru. These hubs aggregate shipments, manage rules-of-origin documentation, and defer duty payments until final clearance. Vietnam’s USD 14.3 billion port-and-logistics complex in Haiphong, announced in August 2025, underscores private-sector confidence in the consolidation-hub model. South Korea plans eight joint logistics centers by 2027 to streamline Korea–ASEAN flows, signaling government support for multi-country networks[1]“RCEP and Intra-Asian Trade Growth,” Asian Development Bank, adb.org.
Biologic-Heavy Pharma Manufacturing Build-Outs Requiring GDP-Compliant Logistics Solutions
Biologic therapies already account for more than 40% of the global drug pipeline, and APAC regulators now mandate temperature-controlled traceability across production and distribution. China’s National Medical Products Administration and India’s Central Drugs Standard Control Organisation both tightened Good Distribution Practice (GDP) rules in 2024, obliging end-to-end temperature monitoring and quarterly audits. Certified 3PL capacity remains scarce, allowing compliant providers to charge 15-20% premiums. Warehouse demand mirrored this shift; India recorded a 63% year-on-year spike in warehouse leasing during H1 2025, led by healthcare occupiers. Early investors in GDP infrastructure secure long-duration contracts and higher margins, whereas non-certified operators are relegated to ambient-temperature volumes[2]“Guidelines on Good Distribution Practices,” World Health Organization, who.int.
Hyper-Growth of Quick-Commerce Driving Micro-Fulfillment and Last-Mile Orchestration Outsourcing
Quick-commerce pledges delivery within 30 minutes by orchestrating 50-100 micro-fulfillment centers (MFCs) inside dense urban clusters. China deployed more than 6,000 autonomous delivery vehicles by end-2024, and similar rollouts are underway in India’s tier-2 cities. Operating these MFC networks in-house strains platform capital; hence, outsourcers with real-time inventory forecasting and dynamic routing are capturing contracts. Inventory turns compress to three to five days, magnifying penalties for replenishment errors. 3PLs mastering SKU-level demand sensing and intra-day restocking lock in recurring revenue, while traditional warehouse operations face volume drift toward tech-enabled rivals.
AI-Powered Control-Tower Visibility Making Integrated Contract Logistics Providers Indispensable
Shippers juggling ocean, air, warehousing, and last-mile legs struggle with fragmented data. AI-driven control towers unify these feeds, predict disruptions, and trigger mitigations such as route diversion or expedited customs. Early adopters report 20-percentage-point on-time-delivery gains. Integrated 3PLs thus elevate their role from executor to orchestrator, embedding decision support into clients’ supply-chain planning cycles. A February 2026 partnership between a global integrator and a Chinese e-commerce titan aims to leverage such control-tower visibility to accelerate European brands’ market entry. Providers are slow to invest in risk disintermediation by digital-only freight platforms offering comparable visibility without physical assets.
Restraints Impact Analysis*
| Restraint | (~) % Impact on CAGR Forecast | Geographic Relevance | Impact Timeline |
|---|---|---|---|
| Shortage of automation-skilled labor delays warehouse ramp-ups | -0.4% | China tier-2/3, India, Vietnam, Indonesia | Short term (≤ 2 years) |
| Cyber-attacks on 3PL IT platforms undercut reliability | -0.3% | Digitally advanced markets | Short term (≤ 2 years) |
| Stricter ESG audits expose Scope-3 emissions penalties | -0.3% | Japan, South Korea, Australia | Medium term (2-4 years) |
| Volatile post-IMO bunker surcharges erode margins | -0.4% | South China–Europe, ASEAN–North America lanes | Short term (≤ 2 years) |
| Source: Mordor Intelligence | |||
Acute Shortage of Automation-Skilled Labor Slowing Warehouse Ramp-Ups
Automation adoption outpaces workforce reskilling across APAC. The region faces a projected 60 million skilled-labor gap by 2030, with logistics among the hardest-hit sectors. Commissioning timelines in tier-2 Chinese and Indian cities now reach 9-12 months, up from four, as 3PLs compete for scarce robotics technicians. Wage premiums have risen 30-40%, inflating project budgets. World Bank analysis flags vocational curricula lagging behind emerging skills such as predictive maintenance and IoT sensor calibration. Providers establishing joint training programs with technical institutes mitigate ramp-up delays, whereas reliance on external hiring prolongs capacity shortages[3]“Carbon Border Adjustment Mechanism,” European Commission, ec.europa.eu.
Stricter ESG Audits Exposing 3PLs’ Scope-3 Emissions to Penalty-Laden Contracts
Shippers are embedding Scope-3 emissions reductions into logistics contracts, shifting carbon-accounting burdens onto providers. The European Union’s Carbon Border Adjustment Mechanism, effective in 2026, adds tariffs to carbon-intensive imports, pressuring APAC exporters to decarbonize freight. Mid-tier 3PLs often lack an auditable data infrastructure, jeopardizing compliance. Retrofitting a diesel tractor with an electric or hydrogen driveline costs USD 50,000–100,000, and recharging or refueling networks remain sparse in secondary cities. Governments in Japan and South Korea now require ISO 14064 certification by 2027 for public procurement, accelerating fleet electrification. Providers investing early in low-emission assets and carbon-tracking software secure ESG-conscious tenders; laggards face penalties or contract termination[4]“China Logistics Industry Statistics 2025,” National Bureau of Statistics of China, stats.gov.cn.
*Our forecasts treat driver/restraint impacts as directional, not additive. The impact forecasts reflect baseline growth, mix effects, and variable interactions.
Segment Analysis
By Service: Value-Added Modules Accelerate Shipper Differentiation
Transportation commanded 63.3% of the APAC contract logistics market size in 2025, yet value-added services are projected to advance at a 5.22% CAGR through 2031, reflecting expanded spend on kitting, labeling, and reverse logistics. Shippers use these modules to postpone final product configuration, cut obsolescence, and support mass customization. Returns management now restores up to 80% of item value when processed by 3PLs within 48 hours, compared with 40% under liquidation models. Freight-management bundles are attracting mid-sized firms seeking carrier-rate leverage without hiring in-house teams.
Kuehne + Nagel’s semiconductor air-logistics service, launched under ISO 9001:2015 quality protocols, exemplifies how specialized value-added solutions create sticky, multi-year engagements. Contract terms are evolving from per-pallet fees to outcome-based models tied to inventory turns or on-time performance, rewarding operational excellence instead of volume throughput. Providers expanding their value-added portfolios capture higher margins and stronger client lock-in, while pure-play carriers face commoditization.


By Contract Duration: Long-Term Partnerships Anchor Automation Co-Investment
Agreements exceeding three years represented 61.4% of all contracts in 2025 and are expected to grow at a 5.1% CAGR to 2031. The APAC contract logistics market share of long-tenor deals reflects scarce warehouse real estate vacancies sitting below 3% in Singapore, Tokyo, and Seoul, prompting shippers to lock capacity and hedge rental inflation. Contracts shorter than one year persist for project cargo and disaster response but carry 10-15% rate premiums because capital cannot be amortized. Co-financed automation deepens the commitment: robotics and AI inventory systems often require five-to-seven-year payback periods, encouraging multi-year partnerships.
Japanese regulation capping truck-driver hours at 960 per year from April 2024 tightened haulage capacity, making long-term contracts vital for service continuity. South Korea’s logistics workforce grew 11.4% in 2024, but throughput jumped 12.4%, absorbing new headcount instantly. Shippers signing extended agreements secure priority access to equipment and labor, whereas spot-market buyers risk service interruptions and escalating costs amid periodic crunches.
By End User: Healthcare and Pharmaceuticals Build Cold-Chain Momentum
Manufacturing and automotive controlled 28.23% of 2025 demand, yet healthcare and pharmaceuticals are the fastest-growing customers at a projected 5.5% CAGR to 2031. The APAC contract logistics market size allocated to healthcare is expanding as biologic drugs and medical devices require GDP-validated cold chains, continuous temperature telemetry, and batch-level traceability. Personalized medicine fragments SKUs and raises inventory-planning complexity, favoring 3PLs with advanced WMS and IoT sensors. Retail and e-commerce volumes mirror overall growth, buoyed by quick-commerce, though margin pressure is rising as platforms exercise buying power.
Electric-vehicle adoption modifies automotive logistics; although total component counts fall, near-term demand for battery modules offsets reductions in mechanical parts. Chemical and industrial verticals remain steady but slower, constrained by environmental regulations. Providers specializing in healthcare enjoy premium yields and contract stability, whereas those dependent on legacy manufacturing must diversify to sustain growth.
Geography Analysis
China’s leadership rests on sheer volume with 41.2% market share, but its double-digit growth era has ended, softening to 5.1% in 2025 as factories migrate southward. Autonomous delivery pilots 6,000 vehicles deployed by 2024 spotlight China’s automation prowess, yet cost advantages erode as wages climb. Japan and South Korea grapple with aging warehousing stock; 54% of Japanese facilities pre-date 1995, and truck-driver hour caps squeeze capacity. Both economies invest in digitalization to preserve competitiveness. South Korea’s KRW 4.5 trillion overseas-hub program, due by 2030, underscores ambitions to channel ASEAN cargo through Korean ports.
India posts the region’s quickest ascent with 5.77% CAGR through 2031, underpinned by political support for multimodal corridors and GST harmonization. The National Logistics Policy accelerates infra build-out, reducing dwell times and energizing e-commerce. Southeast Asia emerges as the wildcard; Vietnam’s Haiphong megaproject and fiscal incentives across ASEAN lure manufacturing relocation and boost demand for bonded logistics hubs. Island geographies in the Philippines and Indonesia complicate last-mile execution, but youthful demographics and digital adoption fuel quick-commerce experimentation.
Australia and New Zealand retain niches in resources and high-value perishables, with contract-logistics uptake focused on major metros. CBRE notes rising demand for multi-country distribution models able to straddle resilience, cost, and sustainability goals as shippers rebalance networks away from single-country concentration. Logistics providers embedding early in emerging growth corridors northern India, Vietnam’s Northern Economic Zone, Indonesia’s Java spine gain first-mover advantage, while incumbents over-weighted in coastal China and mature Northeast Asian markets must evolve service portfolios to defend margins.
Competitive Landscape
The APAC contract logistics market is moderately consolidated; the five largest integrators, DSV, DHL, Kuehne + Nagel, CEVA, and Nippon Express, hold roughly 35-40% combined share. DSV’s USD 15.8 billion acquisition of DB Schenker in April 2025 elevated it to the top-revenue slot and intensified competitive scale economics. Strategic bifurcation defines today’s playbook: global 3PLs invest in AI control towers, multi-country hubs, and regulated-vertical solutions, while regional specialists fortify positions in cold chain, aerospace spares, and lithium-ion battery compliance where local licenses and certifications outweigh scale.
Technology sets the battleground. Providers deploying autonomous mobile robots, IoT sensors, and machine-learning demand forecasting achieve 10-15% cost advantages over manual peers, translating into tender wins. Partnerships are rising: February 2026 saw a global integrator ally with a Chinese e-commerce giant to speed German brands’ China entry, bundling freight, customs, and digital marketing via a shared control-tower stack. Real-estate developers like GLP eye vertical integration, using warehouse portfolios as springboards into value-added logistics, further blurring landlord-operator boundaries.
White-space opportunities cluster around GDP-certified cold chain, MFC orchestration for quick-commerce, and RCEP-driven consolidation hubs. Digital-only freight platforms pose disruptive threats by selling visibility without owning assets, forcing traditional 3PLs to match transparency levels or risk margin erosion. Continued mergers among mid-tier providers are likely as scale becomes prerequisite for technology investment and network density.
Asia-Pacific Contract Logistics Industry Leaders
Deutsche Post DHL Group
DSV
CEVA Logistics
UPS Supply Chain Solutions
Logisteed Ltd
- *Disclaimer: Major Players sorted in no particular order

Recent Industry Developments
- February 2026: DHL Group and JD.com signed an MoU to streamline German brands’ entry into China by integrating DHL’s global network with JD.com’s e-commerce and last-mile infrastructure.
- August 2025: Vingroup announced a USD 14.3 billion port and logistics complex in Haiphong, Vietnam, to be built in three phases from 2026-2040, positioning the city as a regional transshipment hub.
- April 2025: DSV completed its USD 14.9 billion acquisition of DB Schenker, creating the world’s largest freight forwarder with expanded contract-logistics capacity across Asia-Pacific.
- November 2024: Logistics real-estate giant GLP signaled plans for a 2025 Hong Kong IPO to fund automation, renewable power, and land banks in India, Vietnam, and Indonesia.


Asia-Pacific Contract Logistics Market Report Scope
By Service Type
| Transportation | Road |
| Rail | |
| Air | |
| Sea | |
| Warehousing and Distribution | |
| Value-added Services (Assembly, Labelling, Kitting) |
By Contract Duration
| 1 – 3 Years |
| Above 3 years |
By End-user Industry
| Manufacturing and Automotive |
| Food and Beverage |
| Retail and E-commerce |
| Healthcare and Pharmaceuticals |
| Chemicals |
| Other Industries |
By Country
| China |
| India |
| Japan |
| South Korea |
| Australia |
| Singapore |
| Malaysia |
| Indonesia |
| Thailand |
| Rest of Asia-Pacific |
| By Service Type | Transportation | Road |
| Rail | ||
| Air | ||
| Sea | ||
| Warehousing and Distribution | ||
| Value-added Services (Assembly, Labelling, Kitting) | ||
| By Contract Duration | 1 – 3 Years | |
| Above 3 years | ||
| By End-user Industry | Manufacturing and Automotive | |
| Food and Beverage | ||
| Retail and E-commerce | ||
| Healthcare and Pharmaceuticals | ||
| Chemicals | ||
| Other Industries | ||
| By Country | China | |
| India | ||
| Japan | ||
| South Korea | ||
| Australia | ||
| Singapore | ||
| Malaysia | ||
| Indonesia | ||
| Thailand | ||
| Rest of Asia-Pacific |


Key Questions Answered in the Report
What is the forecast value of the APAC contract logistics market by 2031?
The market is projected to reach USD 198.32 billion by 2031.
Which service segment is expanding the fastest?
Value-added services, including kitting and reverse logistics, are forecast to grow at a 5.22% CAGR through 2031.
Why are long-term contracts gaining popularity?
Scarce warehouse real estate and the need to amortize automation investments push shippers toward agreements longer than three years.
Which end-user sector will outpace others through 2031?
Healthcare and pharmaceuticals are set to expand at a 5.5% CAGR, benefiting from stricter cold-chain regulations.
How will RCEP affect logistics networks?
Tariff reductions under RCEP are fostering multi-country consolidation hubs, enabling duty savings and shorter transit times for intra-Asian trade flows.
What poses the greatest emissions-related challenge for 3PLs?
Scope-3 emissions audits tied to customer contracts compel providers to electrify fleets and install carbon-tracking systems or risk penalties.
Page last updated on:


