Graphics Processing Unit (GPU) Market Size and Share
Market Overview
| Study Period | 2020 - 2031 |
|---|---|
| Market Size (2026) | USD 144.83 Billion |
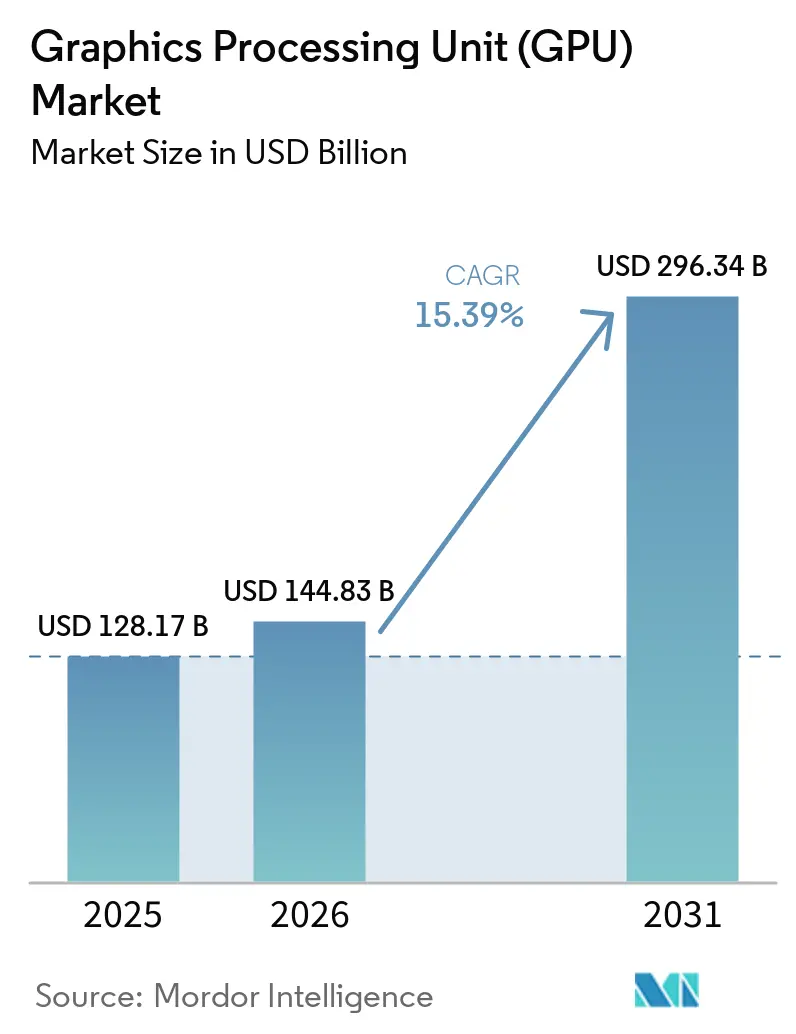
| Market Size (2031) | USD 296.34 Billion |
| Growth Rate (2026 - 2031) | 15.39% CAGR |
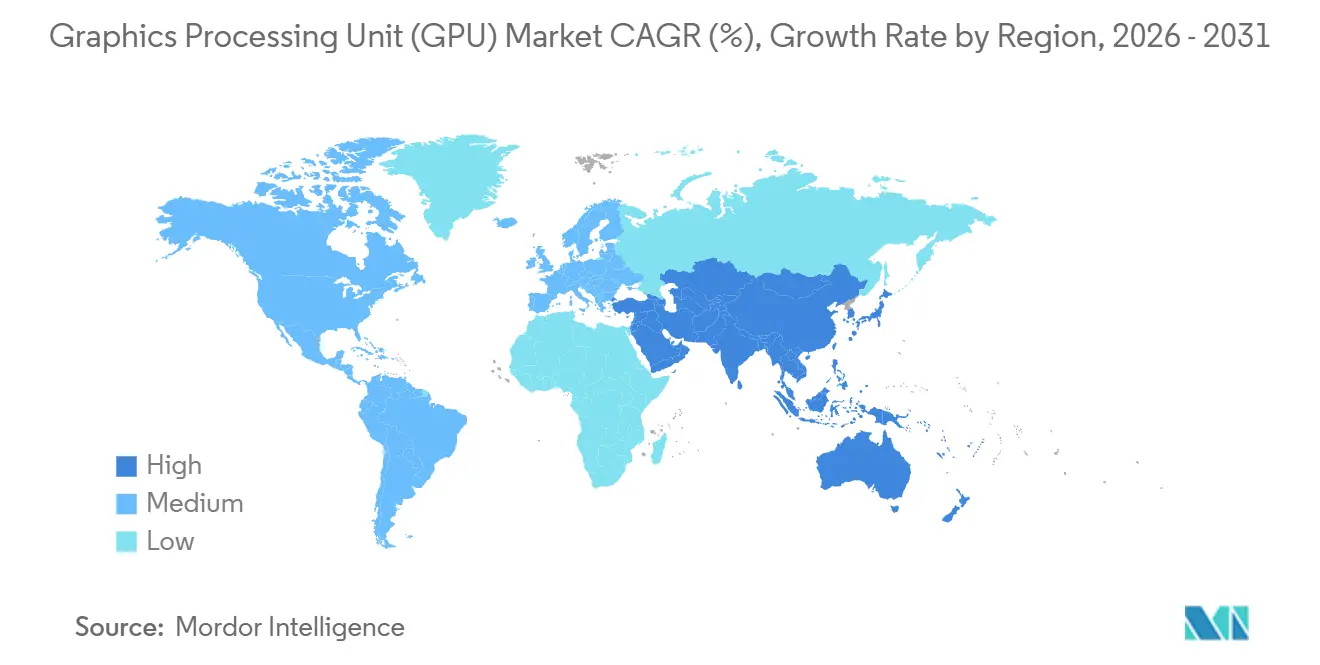
| Fastest Growing Market | Asia-Pacific |
| Largest Market | Asia Pacific |
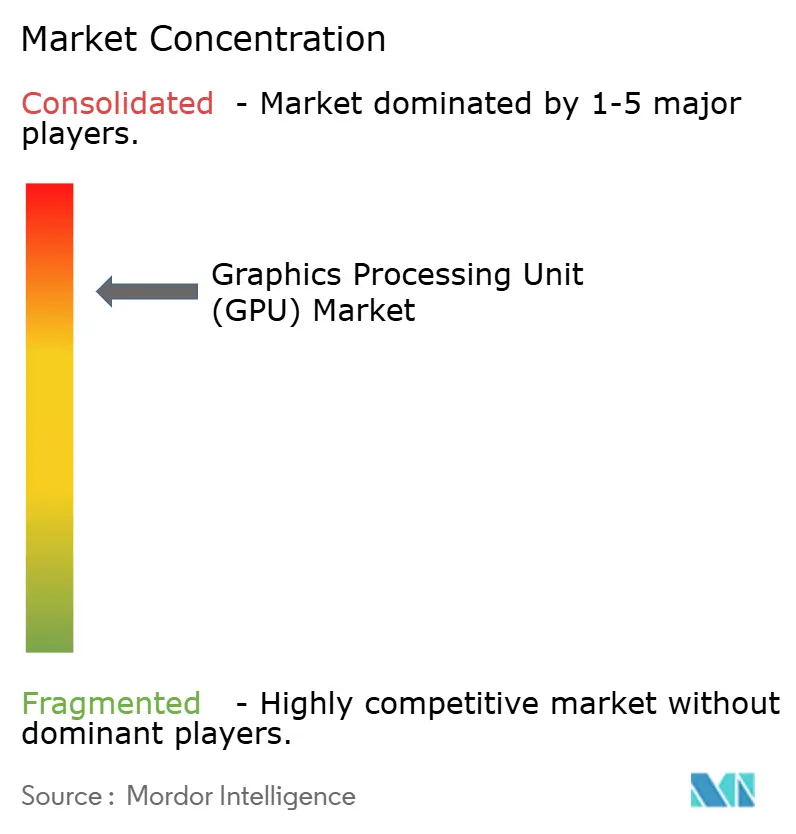
| Market Concentration | Medium |
Major Players *Disclaimer: Major Players sorted in no particular order Image © Mordor Intelligence. Reuse requires attribution under CC BY 4.0. | |
Graphics Processing Unit (GPU) Market Analysis by Mordor Intelligence
The GPU market size is expected to increase from USD 128.17 billion in 2025 to USD 144.83 billion in 2026 and reach USD 296.34 billion by 2031, growing at a CAGR of 15.39% over 2026-2031. The GPU market moved beyond its earlier niche role and became a core layer of enterprise infrastructure as AI compute turned into the main capacity constraint for the fastest-growing parts of IT spending. The sharp rise in capital spending by Amazon, Google, Meta, and Microsoft in 2026, with most of that budget directed toward AI infrastructure, showed that GPU demand is now tied to long-cycle platform investment rather than a short build phase. The GPU market also benefited from the growing weight of servers and datacenter accelerators, while Asia-Pacific stayed ahead on demand because of China’s domestic procurement push, South Korea’s HBM position, Japan’s hyperscale buildout, and Southeast Asia’s growing cloud footprint. Competitive intensity remained high, but concentration stayed pronounced at the platform layer because NVIDIA’s scale, software position, and networking stack continued to shape buying patterns even as AMD expanded. The GPU market also widened beyond hyperscalers as chiplet designs improved cost economics, and service-based access models brought more customers into the demand pool.
Key Report Takeaways
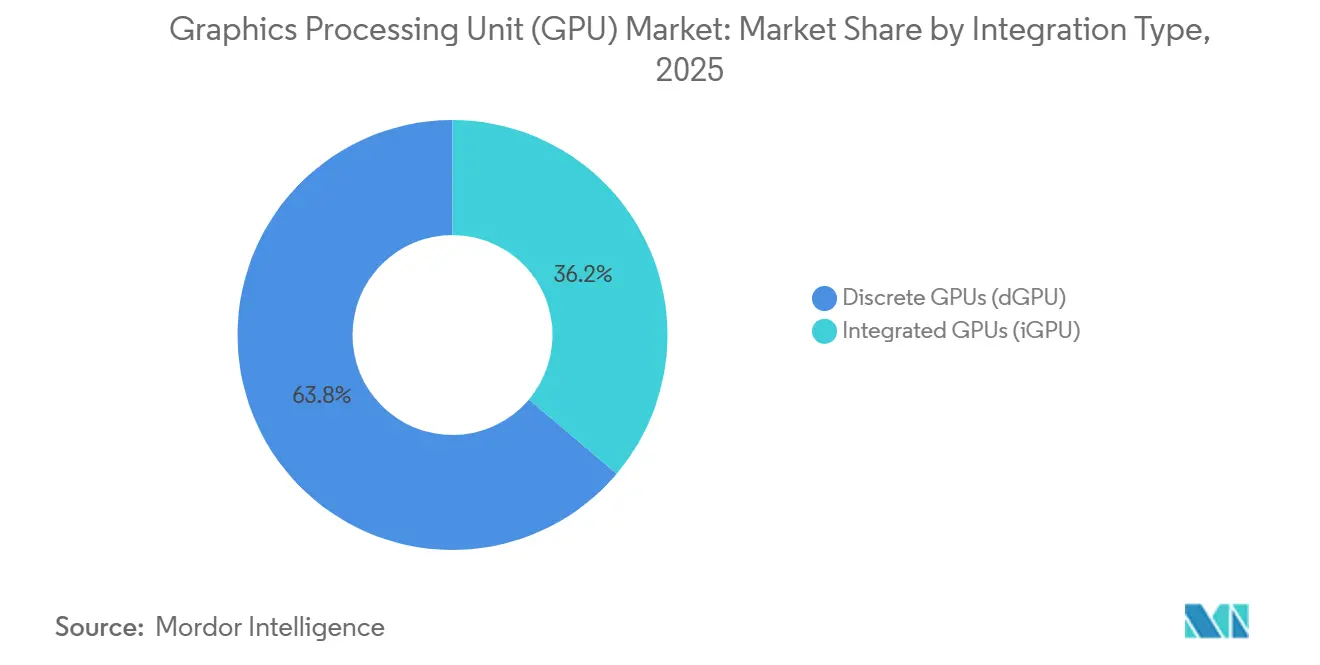
- By integration type, discrete GPUs held 63.84% of revenue in the 2025 graphics processing unit (GPU) market, and this segment is projected to expand at a 15.78% CAGR through 2031.
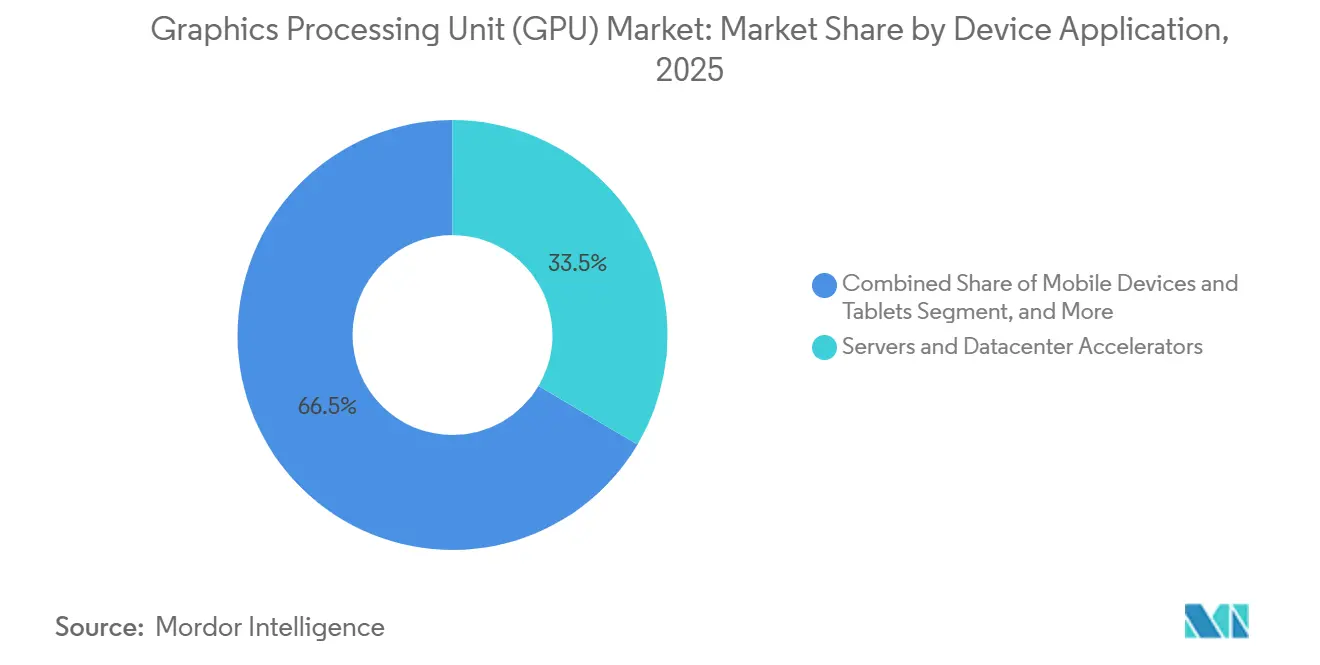
- By device application, servers and datacenter accelerators accounted for 33.51% of the GPU market size in 2025, and this segment is expected to record the fastest CAGR of 16.59% through 2031.
- By geography, Asia-Pacific held 43.16% of the GPU market share in 2025, and the regional GPU market is projected to expand at a 15.37% CAGR through 2031.
Note: Market size and forecast figures in this report are generated using Mordor Intelligence’s proprietary estimation framework, updated with the latest available data and insights as of January 2026.
Global Graphics Processing Unit (GPU) Market Trends and Insights
Driver Impact Analysis*
| Driver | (~) % Impact on CAGR Forecast | Geographic Relevance | Impact Timeline |
|---|---|---|---|
| Hyperscale AI Training and Inference Cluster Expansion | +3.8% | Global, concentrated in North America and Asia-Pacific | Short term (≤ 2 years) |
| Enterprise AI Factory and Sovereign Compute Procurement | +2.7% | Global, with early leadership in Middle East, Europe, and Southeast Asia | Medium term (2-4 years) |
| Edge AI Upgrade Cycle in PCs and Mobile Devices | +1.9% | Global, led by Asia-Pacific OEM markets and North American enterprise fleets | Medium term (2-4 years) |
| Rising ADAS and In-Cabin Compute Content per Vehicle | +1.4% | Global, anchored in Europe, China, and North America | Long term (≥ 4 years) |
| Chiplet-Based GPU Road Maps Improving Yield and Product Scaling | +1.1% | Global, with foundry concentration in Taiwan and South Korea | Medium term (2-4 years) |
| GPU-as-a-Service Broadening Access Beyond Hyperscalers | +0.9% | Global, with fastest adoption in Asia-Pacific and Europe | Medium term (2-4 years) |
| Source: Mordor Intelligence | |||
Hyperscale AI Training and Inference Cluster Expansion
The GPU market is being pushed higher by a shift from periodic model training to always-on AI factory operations that keep clusters busy across training, post-training, and inference. Amazon, Google, Meta, and Microsoft confirmed a combined 2026 capital expenditure of USD 725 billion, up from USD 410 billion in 2025, and most of that increase was directed toward AI infrastructure, where GPUs remain the main hardware cost item. Supply-side results pointed to the same pattern as NVIDIA’s data center revenue reached USD 75.2 billion in Q1 FY2027, while compute revenue reached USD 60.4 billion, and networking revenue rose to USD 14.8 billion. The GPU market is therefore expanding to meet both compute and networking demand, as larger AI factories require dense interconnect fabrics and accelerators. NVIDIA also said hyperscalers accounted for only half of its data center revenue, indicating that demand had broadened to cloud specialists, enterprise deployments, and sovereign programs. This matters for the GPU market because it reduces dependence on a single buyer group and makes current demand more durable than a narrow hyperscaler cycle.
Enterprise AI Factory and Sovereign Compute Procurement
The GPU market gained another demand stream as national compute programs and enterprise AI factories began treating GPU clusters as strategic infrastructure rather than optional technology capacity. Procurement in the Middle East and Europe added a separate customer layer that sat outside the traditional hyperscaler channel, widening the geographic spread of high-end GPU buying. The EU AI Act and tighter data residency rules in regulated sectors also pushed more compute to remain within national borders, making local accelerator procurement a compliance issue as well as a performance decision. This shifted pricing behavior because sovereign buyers often operated outside hyperscaler volume frameworks and absorbed supply at or above list pricing. The GPU market also became harder for mainstream enterprises to access because allocation queues for top-end accelerators stayed long even as cloud access expanded. As a result, sovereign and regulated enterprises demand that the market’s forward visibility be strengthened while also tightening the supply balance for smaller buyers.
Edge AI Upgrade Cycle in PCs and Mobile Devices
The GPU market is also being supported by the move toward AI PCs and more capable mobile devices, where on-device inference has become a practical requirement rather than a feature test. AMD launched the Ryzen AI 400 series at CES 2026 with up to 60 TOPS of NPU compute and integrated Radeon 800M Series graphics, and systems from Acer, ASUS, Dell, HP, GIGABYTE, and Lenovo reached commercial availability in Q1 2026. AMD also introduced the Ryzen AI Halo developer platform, featuring up to 60 TFLOPS of RDNA 3.5 graphics performance and 128 GB of unified memory, extending local AI capabilities into professional and developer systems.[1]AMD, “AMD Expands AI Leadership Across Client, Graphics, and Software With New Ryzen, Ryzen AI, and AMD ROCm Announcements at CES 2026,” AMD Newsroom, amd.com Apple’s 2026 M-series documentation showed a further increase in local model inference capability, supporting the broader move toward client devices capable of handling larger AI workloads without constant reliance on the cloud. The GPU market benefits from this cycle because integrated graphics, local memory bandwidth, and AI acceleration are now being evaluated together in commercial PC refresh decisions. Less than 10% of new PC sales met the 40 TOPS AI PC threshold in 2025, so the 2026 launch wave created a sizable runway for client-side GPU demand to widen over time.
Rising ADAS and In-Cabin Compute Content Per Vehicle
The GPU market also has a longer-cycle growth path in vehicles as ADAS perception, sensor fusion, and cockpit rendering move onto centralized compute platforms. NVIDIA’s DRIVE Thor platform was positioned at 2,000 TOPS for Level 4 applications, which showed how automotive designs are moving toward much higher compute density per vehicle. Consolidating ADAS and cockpit workloads onto fewer, more capable processors raises semiconductor content per platform and supports sustained GPU demand across model generations. The same shift also favors suppliers with validated automotive-grade software and safety capabilities, because design wins depend on compliance as much as raw performance. Regulations tied to software-defined vehicles and vehicle safety are reinforcing that direction by increasing the need for continuous real-time inference in production fleets. In the GPU market, that means automotive revenue grows more slowly than datacenter revenue, but content growth per vehicle is becoming structurally stronger.
Restraint Impact Analysis*
| Restraint | (~) % Impact on CAGR Forecast | Geographic Relevance | Impact Timeline |
|---|---|---|---|
| Export Controls and Tariff Volatility | -2.3% | Global, concentrated in US-China bilateral trade corridors | Short term (≤ 2 years) |
| Elevated GPU and Memory ASPs Slowing Mainstream Adoption | -1.8% | Global, most severe impact in emerging markets and SME segments | Medium term (2-4 years) |
| HBM and CoWoS Allocation Bias Toward AI Racks | -1.4% | Asia-Pacific core, spill-over to North America and Europe | Medium term (2-4 years) |
| Grid Interconnection Delays for High-Density GPU Campuses | -1.0% | North America and Europe, with early pressure in Southeast Asia | Long term (≥ 4 years) |
| Source: Mordor Intelligence | |||
Export Controls and Tariff Volatility
The GPU market faces a direct constraint from export controls and tariff changes that affect where advanced accelerators can be sold and how supply chains are planned. The January 2026 US licensing framework changed how H200 and MI325X shipments to China were reviewed and added tighter conditions around volume, verification, and end-use controls. Reports in May 2026 showed that the United States had cleared H200 purchases for 10 Chinese firms, but deliveries had not yet occurred, as Beijing discouraged procurement after the approvals were granted. NVIDIA then excluded data center compute revenue from China from its forward guidance, indicating that the regulatory effect had already become a commercial one.[2]NVIDIA Corporation, “First Quarter Fiscal Year 2027 CFO Commentary,” U.S. Securities and Exchange Commission, sec.gov The GPU market, therefore, loses part of its accessible demand in one of the world’s largest buying regions at the same time that local Chinese suppliers gain more room to commercialize. Export friction also adds planning uncertainty for suppliers, cloud providers, and customers because procurement decisions now depend on policy timing as much as product timing.
Elevated GPU and Memory ASPs Slowing Mainstream Adoption
The graphics processing unit (GPU) market is also constrained by high prices for accelerators, memory, and advanced packaging, limiting the number of organizations that can move from AI experimentation to direct hardware deployment. Large buyers were still able to spend through that pricing cycle, but each dollar of capital budget bought less physical compute than it did at earlier component cost levels. This had the greatest impact on mainstream enterprises, regional cloud operators, and customers in emerging markets that lack hyperscale balance sheets or sovereign backing. High-end memory and packaging remained a major issue because leading accelerators depend on a limited supply of dense HBM and scarce advanced packaging capacity. That cost structure supported revenue growth for vendors, but it also slowed the pace at which the GPU market could broaden into a wider installed base. The result was a split market in which top-tier buyers kept ordering at scale while smaller customers relied more on rented capacity and delayed direct purchases.
*Our forecasts treat driver/restraint impacts as directional, not additive. The impact forecasts reflect baseline growth, mix effects, and variable interactions.
Segment Analysis
By Integration Type: Discrete GPU Momentum Widens As AI Workloads Deepen
Discrete GPUs held 63.84% of the GPU market share in 2025, and this segment is projected to expand at a 15.78% CAGR through 2031. The segment’s lead reflected the fit between dedicated memory, high bandwidth, and intensive AI workloads that shared system resources cannot match at the top end. NVIDIA’s Blackwell generation raised on-package memory sharply, with the B200 carrying 192 GB of HBM3e versus 80 GB on the H100, underscoring how quickly memory requirements have risen within a single product cycle. NVIDIA also used a dual-die design connected via NV-HBI at 10 TB/s, demonstrating how high-end discrete designs are moving beyond monolithic limits to sustain compute density.[3]NVIDIA Corporation, “NVIDIA Kicks Off the Next Generation of AI With Rubin - Six New Chips, One Incredible AI Supercomputer,” NVIDIA Newsroom, nvidianews.nvidia.com The GPU market continued to favor discrete products in training and large-batch inference because those workloads remain constrained by memory bandwidth and local accelerator capacity.
Integrated GPUs improved materially in 2026, which widened their role in client AI systems and lower-cost inference setups. AMD’s Ryzen AI 400 Series combined up to 60 TOPS of NPU compute with integrated Radeon 800M Series graphics, and the Ryzen AI Halo platform extended that model with stronger graphics capability and large unified memory pools. That progress made local inference more practical for professional notebooks, developer systems, and workstation-class devices that need lower cost and tighter power envelopes. Even so, the GPU industry still relies on discrete products for frontier training and high-throughput inference because unified memory platforms do not yet match the bandwidth of HBM-based accelerators. The graphics processing unit (GPU) market is therefore likely to continue to see integrated products gain relevance at the edge while discrete products hold the performance frontier and most of the profit pool.


By Device Application: Servers Lead, Automotive Demand Builds From A Smaller Base
Servers and datacenter accelerators accounted for 33.51% of the GPU market size in 2025, and this segment is projected to expand at a 16.59% CAGR through 2031. That position came from the shift toward AI factories, where training, post-training, and inference clusters now run as long-duration infrastructure assets rather than occasional research systems. NVIDIA’s Q1 FY2027 results showed how large that demand became, with data center revenue at USD 75.2 billion, compute revenue at USD 60.4 billion, and networking revenue at USD 14.8 billion. The GPU market, therefore, gained not only from accelerator shipments but also from the wider server platform that linked compute nodes, fabrics, and storage acceleration. This application group is expected to remain the largest demand center, as hyperscalers, AI cloud providers, enterprises, and sovereign buyers expand deployments.
PCs and workstations remained important because AI refresh cycles began to lift demand for more capable local graphics and mixed AI processing. AMD’s CES 2026 launch put AI-capable client systems into broader commercial circulation, while Apple’s 2026 documentation showed continued gains in local inference on M-series systems. Mobile devices and tablets also moved toward stronger on-device AI, while gaming consoles and handhelds remained a steady but slower-growing part of the GPU market. Automotive and ADAS stood out for long-term content growth because centralized vehicle compute is driving higher processor requirements for perception, cockpit functions, and real-time inference. Other embedded and edge devices added a broader installed base as robotics, industrial systems, and retail inference terminals adopted purpose-built GPU modules for local processing.

Geography Analysis
Asia-Pacific held 43.16% of global revenue in 2025, and the regional GPU market is projected to expand at a 15.37% CAGR through 2031. The region led because it combined major end demand with critical supply chain positions in memory, packaging, and system manufacturing. China remained central to the GPU market as domestic vendors accelerated commercialization under a stronger local procurement push. Biren and Iluvatar CoreX both reported triple-digit revenue growth in 2025, reflecting the growing support of Chinese demand for local suppliers amid a tighter export environment. South Korea remained vital because Samsung and SK Hynix supply the HBM stacks that underpin leading-edge accelerator performance, while Japan added demand through hyperscale data centers and industrial digital twin adoption.
North America remained the second-largest center of the GPU market because it houses the largest hyperscale buyers and the primary purchasing authority for global AI cluster deployments. Amazon, Google, Meta, and Microsoft together planned USD 725 billion in 2026 capital expenditure, and that spending profile kept the United States at the center of accelerator procurement. North America also shaped the global market through policy, since the US export control framework directly affected which overseas markets advanced GPU vendors could serve. Canada’s addition of sovereign compute initiatives widened the region’s demand profile beyond private hyperscalers and supported the view that public sector procurement would matter more over time. The region, therefore, influenced both the demand and the supply sides of the GPU market more than any other geography.
Europe’s GPU market advanced as compliance, digital sovereignty, and regulated-sector AI adoption pushed local compute investment into a more structured phase. The Middle East and Africa became more important because Gulf sovereign programs started ordering high-end clusters at a scale that exceeded what population size alone would suggest. South America remained earlier in its development cycle, with Brazil serving as the primary base for colocation growth and AI demand in financial services. Across Europe, the Middle East and Africa, and South America, the GPU market expanded more through strategic need and policy alignment than through pure consumer demand, making regional growth patterns more diverse than in earlier cycles.

Competitive Landscape
The GPU market remained highly concentrated at the platform architecture layer, even though competition across client graphics, automotive compute, and embedded IP was broader. NVIDIA stayed ahead by combining hardware scale with CUDA, NVLink, and inference software assets that made switching more difficult once workloads were already in production. Q1 FY2027 results reinforced that position as NVIDIA reported USD 75.2 billion in data center revenue and strong growth in both compute and networking tied to Blackwell and fabric adoption. This meant the graphics processing unit (GPU) market was not being shaped solely by chip performance, because ecosystem depth and deployable system architecture had become equally important. That combination kept competitive pressure high while also keeping leadership concentrated.
AMD remained the clearest large-scale challenger as it expanded its ROCm software portfolio and pushed more aggressively into AI systems across client and data center categories. AMD said ROCm 7.2 support had doubled across its Ryzen and Radeon product lines in 2025, and downloads had grown tenfold year over year, demonstrating clear progress in reducing software friction for developers. Another strategic move came from its 2026 client launch cycle, which pushed AI PCs into wider OEM channels and strengthened its presence across integrated graphics and local AI compute. Intel also remained active in workstation AI inference with the Arc Pro B60 and B50 launches in 2025, helping it maintain relevance in professional graphics rather than high-end training infrastructure.[4]Intel Corporation, “Computex 2025, Intel Unveils New GPUs for AI and Workstations,” Intel Corporation Press Releases, intc.com
Chinese challengers added another competitive layer as Biren, Moore Threads, MetaX, and Iluvatar CoreX moved further into commercialization and public-market funding. Public listings clustered in late 2025 and early 2026 signaled that local investors and procurement programs were supporting a domestic alternative stack in response to tighter export controls. The GPU market, therefore, had a dominant global leader, a strengthening second-tier challenge, and an increasingly policy-backed regional challenger set in China. Packaging access, software maturity, and ecosystem control remained the main competitive filters, which is why leadership changed more slowly than product launch headlines might suggest.
Graphics Processing Unit (GPU) Industry Leaders
NVIDIA Corporation
Advanced Micro Devices Inc.
Intel Corporation
Apple Inc.
Qualcomm Incorporated
- *Disclaimer: Major Players sorted in no particular order

Recent Industry Developments
- May 2026: NVIDIA reported record Q1 FY2027 results, quarter ended April 26, 2026, total revenue of USD 81.6 billion, up 85% year over year, data center revenue of USD 75.2 billion, up 92% year over year, data center compute revenue of USD 60.4 billion, up 77%, and data center networking revenue of USD 14.8 billion, up 199%.
- May 2026: The US Commerce Department cleared 10 Chinese firms, including Alibaba, Tencent, ByteDance, and JD.com, to purchase NVIDIA H200 GPUs under the January 2026 BIS licensing framework, with each approved buyer allowed up to 75,000 chips.
- March 2026: NVIDIA’s Vera CPU, featuring 88 custom Olympus cores, full Armv9.2 compatibility, and NVLink-C2C connectivity, was hand-delivered to Anthropic, OpenAI, SpaceXAI, and Oracle Cloud Infrastructure.
- January 2026: NVIDIA officially launched the Rubin platform, comprising six new chips: the Vera CPU, Rubin GPU, 50 petaflops of NVFP4 compute, sixth-generation NVLink Switch, 3.6 TB/s per GPU, ConnectX-9 SuperNIC, BlueField-4 DPU, and Spectrum-6 Ethernet Switch.


Research Methodology Framework and Report Scope
Market Definitions and Key Coverage
Mordor Intelligence defines the graphics processing unit (GPU) market as the worldwide revenue generated from the sale of discrete, integrated, and hybrid electronic circuits engineered to accelerate parallel-processing workloads across consumer devices, data-center servers, automotive ADAS, and edge systems.
Each unit must be a new, factory-shipped GPU that is either soldered on board or packed as an add-in card; refurbished boards, ASIC miners, and FPGA accelerators fall outside this definition. Scope exclusion: refurbished cards, pure AI application-specific ASICs, and FPGA-based accelerators are not covered.
Segmentation Overview
- By Integration Type
- Integrated GPUs (iGPU)
- Discrete GPUs (dGPU)
- By Device Application
- Mobile Devices and Tablets
- PCs and Workstations
- Servers and Datacenter Accelerators
- Gaming Consoles and Handhelds
- Automotive and ADAS
- Other Embedded and Edge Devices
- By Geography
- North America
- United States
- Canada
- Mexico
- Europe
- Germany
- United Kingdom
- France
- Italy
- Rest of Europe
- Asia-Pacific
- China
- Japan
- South Korea
- India
- Southeast Asia
- Rest of Asia-Pacific
- South America
- Middle East and Africa
- North America
Detailed Research Methodology and Data Validation
Primary Research
We interview GPU designers, board manufacturers, cloud-infrastructure architects, gaming-OEM product managers, and regional distribution heads across North America, Asia-Pacific, and Europe. Their inputs on yield rates, channel inventory, cloud attach rates, and forward ASP roadmaps allow Mordor analysts to challenge desk assumptions and refine elasticity parameters before finalizing the model.
Desk Research
Our analysts begin with public datasets that map the supply chain, such as United States International Trade Commission HS-code exports, Eurostat COMEXT import flows, and China Customs electronics shipment files, which together reveal shipment volumes by device class. Semiconductor Industry Association wafer-capacity briefs, OECD ICT hardware price indices, and World Bank broadband penetration tables help us frame demand and pricing arcs. Company 10-Ks, investor decks, and earnings calls supplement these macro views, while D&B Hoovers and Dow Jones Factiva feed us firm-level revenue splits that sharpen estimated ASPs. This constellation of open and paid sources gives us the first pass at a balanced volume-value grid.
Patent landscapes from Questel, production statistics from IMTMA for board assembly lines, and traffic logs from open data-center registries further validate production ceilings and identify upcoming supply bottlenecks. Numerous additional secondary sources are reviewed; the titles above illustrate but do not exhaust our reference pool.
Market-Sizing & Forecasting
A top-down device-shipment reconstruction starts with shipments of PCs, servers, handsets, consoles, and vehicles, then applies segment-specific GPU attach ratios and average selling prices. Supplier roll-ups, selective channel checks, and sampled ASP × volume pairs act as bottom-up reasonableness tests. Key variables include gaming-PC replacement cycles, hyperscale server GPU density, memory-cost trajectories, cryptocurrency profitability indices, and regional disposable-income growth. Forecasts are generated through multivariate regression blended with scenario analysis, capturing volatility in AI server build-outs and consumer graphics demand. Data gaps, common in gray-channel console boards, are bridged by three-point estimates agreed upon during expert calls.
Data Validation & Update Cycle
Outputs pass anomaly scans, cross-metric variance checks, and a two-step peer review before sign-off. Reports refresh each year; interim re-checks trigger when material events (fab outages, new architecture launches, or steep tariff shifts) hit the market. A final analyst sweep is completed just prior to client delivery, ensuring clients receive an up-to-date baseline.
Why Mordor's Gpu Baseline Earns Trust
Published estimates often diverge because firms choose different device baskets, ASP assumptions, and forecast cadences.
Key gap drivers include whether mobile GPUs are booked at silicon or finished-device value, how aggressively AI-server demand ramps are modeled, and the currency conversion points used. Mordor publishes a unified 2025 base year and refreshes annually, whereas some publishers embed conservative GPU attach ratios or roll their forecasts forward only every two years, creating spread.
Benchmark comparison
| Market Size | Anonymized source | Primary gap driver |
|---|---|---|
| USD 82.68 B (2025) | Mordor Intelligence | - |
| USD 77.39 B (2024) | Global Consultancy A | mobile handset GPUs excluded; two-year currency average used |
| USD 101.54 B (2025) | Industry Publisher B | counts refurbished cards; assumes 45 % AI-server GPU attach by 2025 |
In sum, the disciplined scope selection, yearly refresh rhythm, and dual-path validation steps adopted by Mordor analysts deliver a transparent, repeatable baseline that decision-makers can rely on with confidence.


Key Questions Answered in the Report
What is the current and forecast size of the GPU market?
The GPU market size stands at USD 144.83 billion in 2026 and is forecast to reach USD 296.34 billion by 2031, growing at a 15.39% CAGR over 2026-2031.
Which application generates the most revenue for GPUs?
Servers and datacenter accelerators led with 33.51% of revenue in 2025 and are also projected to post the fastest growth at 16.59% through 2031.
Why are hyperscalers so important for GPU demand?
Amazon, Google, Meta, and Microsoft together confirmed USD 725 billion in 2026 capital expenditure, with most of the increase tied to AI infrastructure where GPUs remain the main hardware cost item.
Which integration type is expected to lead over the forecast period?
Discrete GPUs held 63.84% of revenue in 2025 and are projected to grow at a 15.78% CAGR, supported by higher memory capacity, bandwidth needs, and intensive AI workloads.
Which region leads global GPU demand?
Asia-Pacific held 43.16% of global revenue in 2025 and remains the leading region because of China's domestic procurement push, South Korea's HBM position, and Japan and Southeast Asia's datacenter expansion.
What are the main risks affecting GPU adoption?
Export controls, tariff changes, and high GPU and memory prices are the main constraints because they limit market access, raise landed costs, and slow direct purchases by mainstream enterprises.
Page last updated on:


