Enterprise GPU Infrastructure Market Size and Share
Market Overview
| Study Period | 2020 - 2031 |
|---|---|
| Market Size (2026) | USD 374.82 Billion |
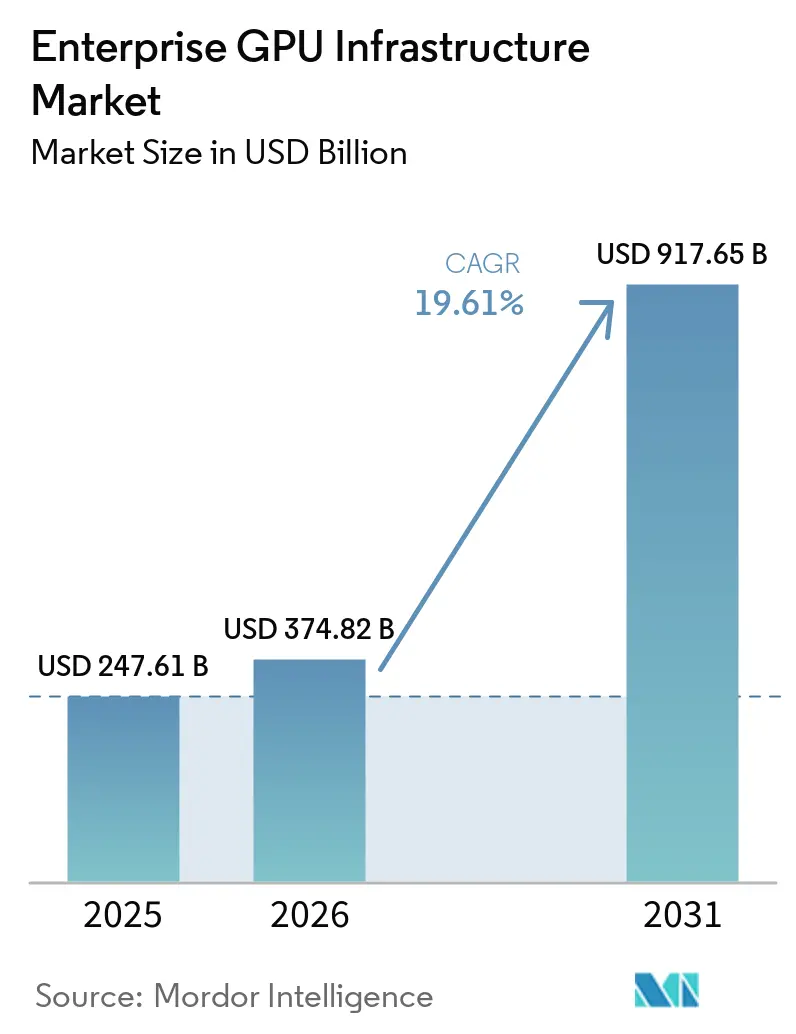
| Market Size (2031) | USD 917.65 Billion |
| Growth Rate (2026 - 2031) | 19.61% CAGR |
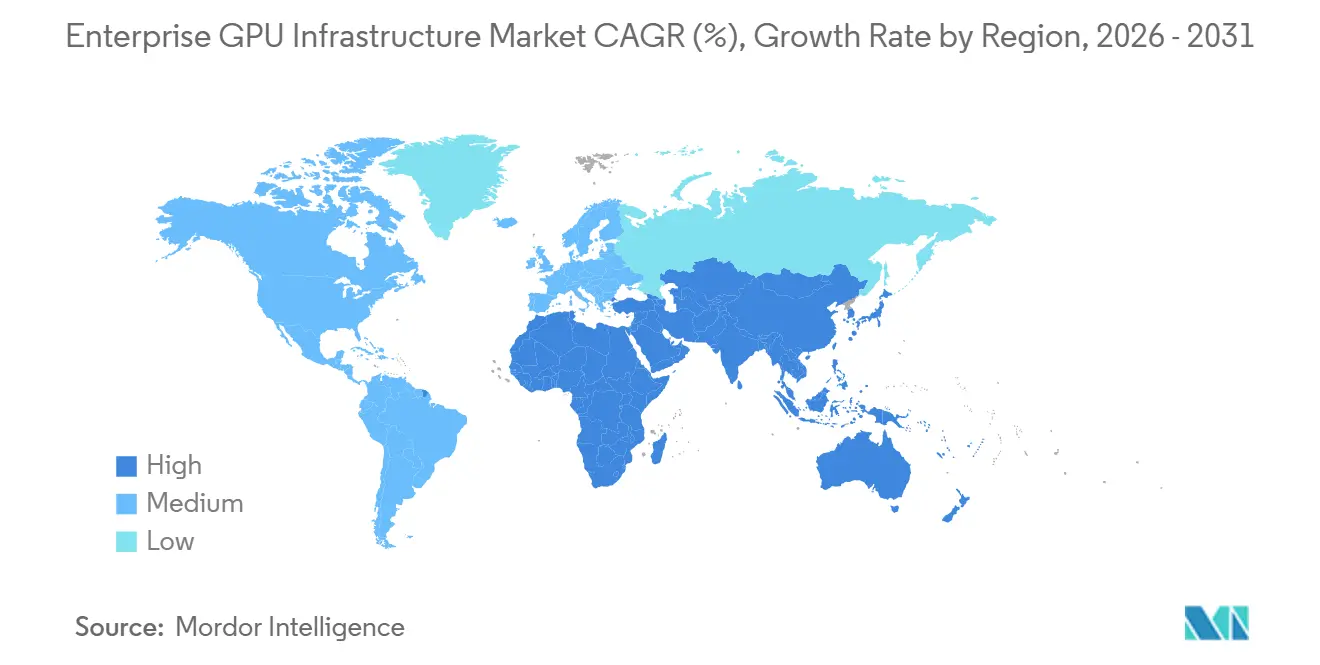
| Fastest Growing Market | Asia-Pacific |
| Largest Market | North America |
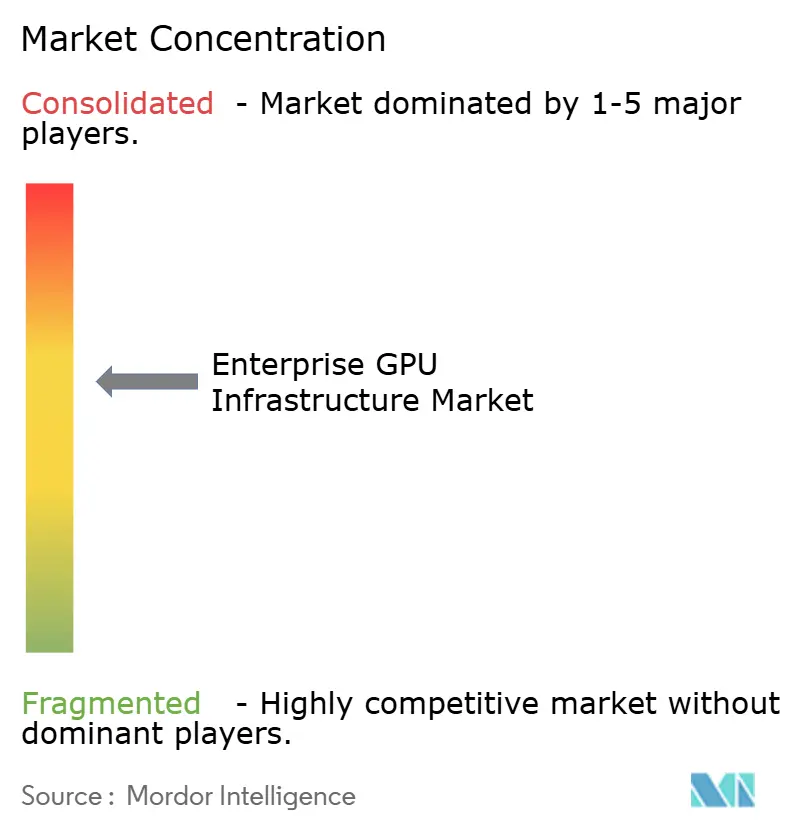
| Market Concentration | Medium |
Major Players *Disclaimer: Major Players sorted in no particular order Image © Mordor Intelligence. Reuse requires attribution under CC BY 4.0. | |
Enterprise GPU Infrastructure Market Analysis by Mordor Intelligence
The enterprise GPU infrastructure market size is projected to be USD 247.61 billion in 2025, USD 374.82 billion in 2026, and reach USD 917.65 billion by 2031, growing at a CAGR of 19.61% from 2026 to 2031. The enterprise GPU infrastructure market is moving through a period in which capital spending has become concentrated around production-scale AI capacity rather than small pilot deployments. Multi-year procurement commitments from hyperscalers, enterprises, and sovereign programs are extending the demand cycle beyond short hardware replacement decisions and into long-duration infrastructure planning. The enterprise GPU infrastructure market is also being shaped by practical constraints, because power delivery, thermal design, and operating expertise now matter as much as GPU availability. Export controls introduced on advanced architectures in 2025 added a supply-side layer to the enterprise GPU infrastructure market, while enterprise demand remained firm and increasingly tied to compliance, latency, and governance needs.
Key Report Takeaways
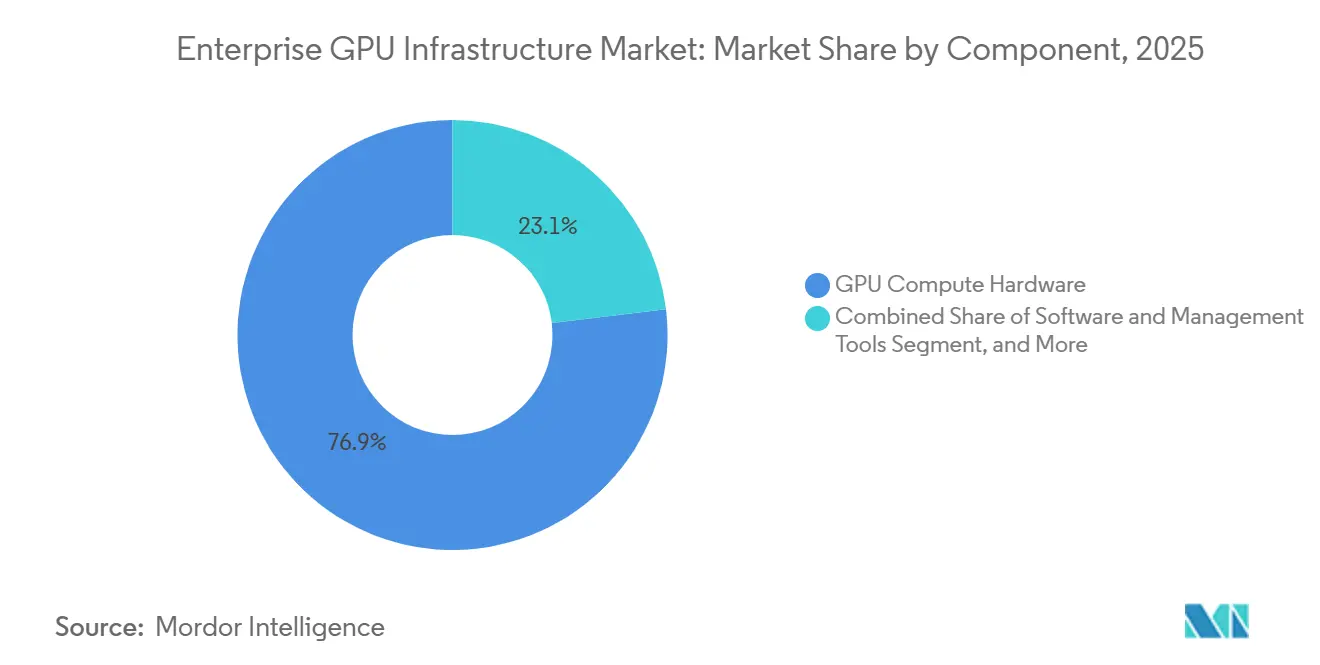
- By component, GPU Compute Hardware held 76.92% share of the enterprise GPU infrastructure market in 2025, while Software and Management Tools are projected to expand at a 20.53% CAGR through 2031.
- By deployment model, Public Cloud and Hosted GPU Infrastructure accounted for 53.28% of the market in 2025, while Hybrid and Multi-Cloud are expected to grow at a CAGR of 20.84% through 2031.
- By workload, AI Training and Fine-Tuning captured 56.37% share of the enterprise GPU infrastructure market in 2025, while AI Inference and Serving is projected to advance at a 21.16% CAGR through 2031.
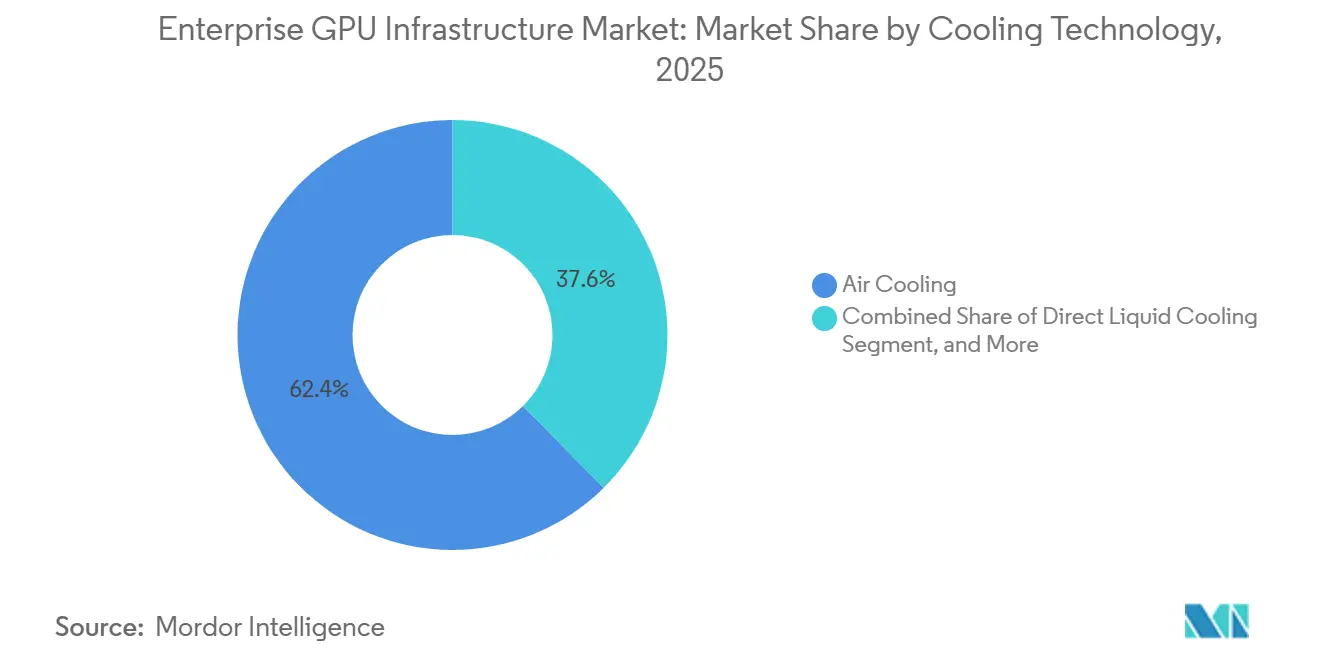
- By cooling technology, Air Cooling led with 62.43% share in 2025, while Immersion Cooling is expected to register the fastest CAGR at 20.92% through 2031.
- By end user, Hyperscalers, Cloud Service Providers, and GPU Cloud Providers controlled 62.71% share in 2025, while Commercial and Private Enterprises are projected to grow at a 20.59% CAGR through 2031.
- By geography, North America held 49.34% share of the enterprise GPU infrastructure market in 2025, while Asia-Pacific is projected to expand at a 20.76% CAGR through 2031.
Note: Market size and forecast figures in this report are generated using Mordor Intelligence’s proprietary estimation framework, updated with the latest available data and insights as of January 2026.
Global Enterprise GPU Infrastructure Market Trends and Insights
Drivers Impact Analysis*
| Driver | (~) % Impact on CAGR Forecast | Geographic Relevance | Impact Timeline |
|---|---|---|---|
| Rapid Enterprise AI Cluster Buildouts | +5.2% | Global | Short term (≤ 2 years) |
| Rising Adoption of High-Density Rack Architectures | +3.8% | Global, led by North America and the Asia-Pacific | Short term (≤ 2 years) |
| Shift Toward Liquid Cooling for Thermal Headroom | +2.9% | North America and the EU, spill-over to the Asia-Pacific | Medium term (2-4 years) |
| Growing Need for On-Premises AI Governance and Data Control | +2.4% | EU and Asia-Pacific core, spill-over to North America | Medium term (2-4 years) |
| Expansion of Multi-GPU Workloads in Simulation and Digital Twins | +2.1% | North America and the EU | Long term (≥ 4 years) |
| Replacement Cycles Driven by GPU Memory Bandwidth and Interconnect Upgrades | +1.8% | Global | Short term (≤ 2 years) |
| Source: Mordor Intelligence | |||
Rapid Enterprise AI Cluster Buildouts
The enterprise GPU infrastructure market is benefiting from a clear shift from proof-of-concept deployments to production-scale AI cluster programs. Buyers are moving from small 8-GPU test nodes toward 512-GPU-and-above environments, and that change raises requirements for networking, storage, cooling, and facility design across the full stack. The scale of hyperscaler spending shows why the enterprise GPU infrastructure market has moved into a long-cycle investment phase, with Alphabet, Amazon, Meta, and Microsoft disclosing sharply higher capital commitments tied to AI capacity in 2026. Enterprise demand is also becoming more durable, as dedicated deployments are now structured through multi-year contracts rather than short-term cloud consumption decisions. ClearML’s 2025 survey showed that 44% of organizations still manually assigned workloads to GPUs or used no formal utilization strategy, which explains why orchestration and management software are rising alongside hardware purchases.
Rising Adoption of High-Density Rack Architectures
The enterprise GPU infrastructure market is being reshaped by rack power densities that no longer fit legacy enterprise data center layouts. NVIDIA stated that modern AI racks were already reaching 120-150kW in 2025, while the Rubin Ultra platform is targeted to approach 1MW per rack in 2027. This step change forces a redesign of facility electrical systems because higher density shifts the economics of copper use, conversion losses, and rack-level distribution. NVIDIA also showed that 800 VDC architecture reduces copper use and IR losses compared with older 54 VDC rack systems, but it requires either dedicated conversion or deeper facility rewiring. As a result, operators building purpose-designed AI campuses enter the enterprise GPU infrastructure market with an advantage over facilities that were built for lower-density workloads.
Shift Toward Liquid Cooling for Thermal Headroom
The enterprise GPU infrastructure market is moving away from air-only thermal management as rack densities continue to climb. A 2025 peer-reviewed study found that liquid immersion cooling kept server temperatures at 65°C, compared with air-cooled surfaces that reached 65-120°C, while also reducing cooling power consumption and improving power usage effectiveness. Scaled direct-to-chip liquid cooling across its data center fleet in 2025, showing that liquid-based thermal control has already moved into production use rather than remaining a pilot solution. Super Micro Computer also received Intel certification for its immersion-cooling solution in June 2025, signaling that procurement standards and component compatibility are becoming more established.[1]Super Micro Computer, Inc., “Industry First, Supermicro Systems Certified by Intel for an Immersion Cooling Solution,” PRNewswire via Morningstar, morningstar.com This progression supports the enterprise GPU infrastructure market because direct liquid cooling gives operators a near-term retrofit path, while immersion is becoming more viable for the next wave of higher-density systems.
Growing Need for On-Premises AI Governance and Data Control
The enterprise GPU infrastructure market is also being driven by organizations that cannot run sensitive workloads in shared public cloud environments. HPE launched its AI Factory for Government with NVIDIA in October 2025 to support air-gapped, high-assurance on-premises deployments, reflecting demand from sectors with stricter governance and security requirements. SUSE followed in April 2026 with SUSE AI Factory with NVIDIA, and it explicitly linked the offer to EU AI Act auditability and regulated deployment needs. Lenovo said its hybrid on-premises deployments could deliver up to 8x lower cost per token than comparable cloud infrastructure, giving CFOs a stronger case for direct ownership. Dell and Palantir also introduced an on-premises AI operating system with governance and isolation features, reinforcing the private infrastructure path inside the enterprise GPU infrastructure market.
Restraints Impact Analysis*
| Restraint | (~) % Impact on CAGR Forecast | Geographic Relevance | Impact Timeline |
|---|---|---|---|
| Power Delivery and Facility Retrofit Constraints | -3.2% | Global, acute in North America and the EU | Short term (≤ 2 years) |
| High Upfront Capital Intensity for Full-Stack Deployments | -2.6% | Global, acute in South America and Middle East, and Africa | Medium term (2-4 years) |
| GPU Supply Allocation Volatility and Lead Time Risk | -1.9% | Global | Short term (≤ 2 years) |
| Enterprise Skills Gap in Cluster Orchestration and Thermal Operations | -1.4% | Global, acute in the Middle East, Africa, and South America | Medium term (2-4 years) |
| Source: Mordor Intelligence | |||
Power Delivery and Facility Retrofit Constraints
Power delivery remains the most immediate physical limit on the enterprise GPU infrastructure market. Legacy facilities designed for 20-40kW rack densities face a much harder transition as AI racks move into the 120-150kW range and beyond. A 2026 peer-reviewed study in Renewable and Sustainable Energy Reviews found that grid interconnection queues for new data center power connections often stretch to 4-5 years, which means electrical readiness can lag hardware demand by several years. NVIDIA’s 800 VDC guidance adds to that constraint because next-generation rack-scale systems will require facilities built or heavily retrofitted for higher-voltage distribution. This bottleneck limits how quickly the enterprise GPU infrastructure market can convert demand into installed capacity, especially in established campuses with older electrical layouts.
High Upfront Capital Intensity For Full-Stack Deployments
Capital intensity is another major restraint in the enterprise GPU infrastructure market because full-stack deployments now extend well beyond the cost of accelerators alone. Axe Compute’s April 2026 contract for a dedicated 2,304-GPU NVIDIA B300 cluster was valued at USD 260 million, underscoring the financial threshold for production-grade enterprise buildouts. NVIDIA’s strategic partnership with IREN, including up to USD 2.1 billion of investment support tied to as much as 5GW of AI infrastructure, points to the same scale effect at the campus level. Lenovo’s on-premises cost argument strengthens the ownership case over time, but the upfront costs for compute, networking, cooling, software, and facility integration still narrow the buyer pool. That challenge is sharper in markets where financing channels, specialist integrators, and high-density operating expertise are still developing.
*Our forecasts treat driver/restraint impacts as directional, not additive. The impact forecasts reflect baseline growth, mix effects, and variable interactions.
Segment Analysis
By Component: Hardware Leads While Software Expands the Value Layer
GPU Compute Hardware held 76.92% of the enterprise GPU infrastructure market share in 2025, while Software and Management Tools are projected to grow at a 20.53% CAGR through 2031. This balance shows that the enterprise GPU infrastructure market is still in a hardware-heavy build phase, because raw compute capacity is usually procured before utilization can be fully optimized. Enterprises are still securing GPU inventory, power, and thermal capability before they standardize fleet scheduling and policy layers. That sequence keeps hardware dominant in current revenue, even though the software layer is beginning to influence purchasing decisions much earlier in the deployment cycle.
The component mix is also shifting because many buyers now recognize that hardware spending alone does not guarantee usable output. ClearML reported in 2025 that 44% of surveyed organizations either manually assigned workloads to GPUs or lacked a formal utilization strategy, indicating clear inefficiencies within deployed estates. Supporting infrastructure is gaining importance as interconnect, storage, and power design become harder to separate from compute planning in the enterprise GPU infrastructure industry. Services are also expanding because deployment timelines, system integration, and digital design work have become more complex, and NVIDIA’s DSX Air gives partners a way to simulate AI factory layouts before equipment goes live.


By Deployment Model: Hybrid Designs Balance Governance and Elasticity
Public Cloud and Hosted GPU Infrastructure accounted for 53.28% of the enterprise GPU infrastructure market in 2025, while Hybrid and Multi-Cloud are expected to advance at a 20.84% CAGR through 2031. The public cloud lead reflects how organizations initially chose speed and access when production AI demand accelerated faster than internal build capacity could keep pace. Hosted models provided buyers with a faster path into training and early inference workloads, especially when GPU availability was limited or internal facilities were not ready. Even so, the fastest growth is now shifting into architectures that divide workloads by latency, cost, and compliance.
That shift is becoming more visible as regulated enterprises separate sensitive inference from burst training and experimentation. SUSE linked its 2026 launch directly to EU AI Act auditability, which shows that compliance is shaping deployment design rather than sitting outside infrastructure decisions.[2]SUSE, “SUSE Launches SUSE AI Factory with NVIDIA,” GlobeNewswire, globenewswire.com Lenovo said hybrid on-premises deployments can deliver up to 8x lower cost per token than comparable cloud infrastructure, which gives hybrid models a stronger financial argument as inference volumes rise. The enterprise GPU infrastructure market is therefore moving toward a split model in which public resources remain useful for elasticity, while private environments host workloads that require tighter control, predictable economics, or local data residency.
By Workload: Inference Growth Broadens Infrastructure Footprints
AI Training and Fine-Tuning accounted for 56.37% of the enterprise GPU infrastructure market size in 2025, while AI Inference and Serving is projected to rise at a 21.16% CAGR through 2031. Training held the larger share because the first wave of spending was concentrated in fewer, larger, capital-intensive environments. Those deployments required substantial GPU clusters, fast networking fabrics, and specialized thermal infrastructure, which lifted training revenue early in the cycle. The enterprise GPU infrastructure market is now broadening because inference scales across many more sites, applications, and operating conditions.
Inference growth matters because production models must run closer to users, data sources, and operating systems than centralized training clusters do. That pushes GPU demand into enterprise campuses, colocation sites, and edge-adjacent environments where latency and control matter more. High-performance computing and simulation remain an important workload class, and NVIDIA said JLR had moved 95% of its aero-thermal workloads onto GPU-based simulation by 2025. Visualization, rendering, and digital twin use cases are also becoming increasingly relevant, with NVIDIA’s Omniverse DSX Blueprint supporting simulation-first planning for AI factory infrastructure before physical deployment.
By Cooling Technology: Air Still Holds the Base While Immersion Gains Momentum
Air Cooling held 62.43% of the enterprise GPU infrastructure market share in 2025, while Immersion Cooling is projected to register the highest CAGR at 20.92% through 2031. Air retained the leading share because most installed facilities were originally designed around conventional server layouts and lower rack densities. Many operators are still extending the useful life of those assets through containment, airflow tuning, and selective upgrades rather than immediate full cooling redesigns. That installed base effect keeps air systems relevant in the near term, even as new GPU generations place much greater stress on thermal envelopes.
The growth outlook is strongest for immersion because the density curve is moving faster than air-based thermal control can reasonably support. The 2025 Springer Nature study showed that liquid cooling kept server temperatures materially lower than air cooling and sharply reduced cooling-related power draw. AWS also scaled direct-to-chip liquid cooling in production during 2025, which supports the role of direct liquid cooling as a practical bridge for operators retrofitting existing sites. Super Micro Computer’s June 2025 immersion certification further indicates that immersion is moving from niche adoption toward a more procurement-ready position within the enterprise GPU infrastructure market.
By End User: Hyperscalers Lead Today While Enterprises Expand Faster
Hyperscalers, Cloud Service Providers, and GPU Cloud Providers controlled 62.71% of the market in 2025, while Commercial and Private Enterprises are projected to grow at a 20.59% CAGR through 2031. That split reflects the capital concentration that defined the early expansion phase of the enterprise GPU infrastructure market. The largest cloud operators had the balance sheets, power access, and engineering resources needed to secure accelerated capacity before most other buyers. Their scale also helped set the pace for supply commitments, network design, liquid cooling adoption, and next-generation campus planning.
The enterprise buyer base is expanding as more organizations seek dedicated capacity for governed inference, internal model development, and lower-latency production workloads. Alphabet, Amazon, Meta, and Microsoft filings show that the United States strongly influenced global AI infrastructure spending in 2025 and 2026, which explains why hyperscalers remained the largest customer group. At the same time, HPE’s AI Factory for Government shows that public sector, defense, academic, and research institutions need deployment patterns that differ from those of commercial cloud buyers. Telecom, edge, and colocation operators are also becoming more relevant as inference workloads move toward sites that can support real-time response and local traffic handling.
Geography Analysis
North America held 49.34% of the enterprise GPU infrastructure market share in 2025, and that lead reflected the financial and operating scale of the largest hyperscalers. Alphabet, Amazon, Meta, and Microsoft disclosed major AI-linked capital programs for 2026, and those filings support North America’s position as the center of current large-scale capacity buildout. NVIDIA’s strategic partnership with IREN, including up to 5GW of AI infrastructure deployment and the Sweetwater campus in Texas as a flagship reference site, adds to the region’s advantage in campus-scale execution.[3]NVIDIA Corporation and IREN Limited, “NVIDIA and IREN Announce Strategic Partnership to Accelerate Deployment of up to 5 Gigawatts of AI Infrastructure,” GlobeNewswire, globenewswire.com Europe remains a meaningful part of the enterprise GPU infrastructure market because compliance frameworks and sovereign computing priorities support on-premises deployment. SUSE’s 2026 launch tied AI factory demand to EU AI Act auditability, a link particularly relevant to financial, industrial, and public-sector users.
Asia-Pacific is projected to grow at a 20.76% CAGR from 2026 to 2031, making it the fastest-growing regional segment of the enterprise GPU infrastructure market. That growth points to a broader wave of domestic AI capacity development across several countries rather than a single national story. Regional demand is being supported by sovereign AI goals, local infrastructure planning, and the push to retain more strategic compute capacity within domestic borders. This mix gives Asia-Pacific a strong expansion profile even though installed capacity remains less concentrated than North America.
South America and the Middle East and Africa represent smaller shares today, and deployment progress is more closely tied to site-level financing, grid readiness, and selective enterprise or sovereign programs. These regions face the same demand drivers seen elsewhere, but they have fewer mature domestic supply chains for high-density GPU infrastructure. They also tend to face tighter constraints around power availability, retrofit economics, and specialized operating talent. The enterprise GPU infrastructure market therefore shows a clear geographic pattern in which growth is strongest where capital access, compliance needs, power infrastructure, and execution capacity align most effectively.

Competitive Landscape
The enterprise GPU infrastructure market has a concentrated upstream layer and a far more fragmented downstream layer. NVIDIA remains the central platform provider for advanced GPU silicon, and its position is reinforced by CUDA, NIM microservices, AI Enterprise software, and the broader developer ecosystem that sits around its hardware stack. Downstream competition spans ODMs, system builders, server vendors, cloud operators, and integration specialists, competing on delivery speed, cooling design, operational reliability, and service depth. This structure means buyers often choose among deployment partners while still remaining tied to a common GPU and software platform. The enterprise GPU infrastructure market is therefore competitive in execution, but much less open in the foundational accelerator layer.
Competitive white space remains strongest in software and services, where many organizations still need help with scheduling, observability, governance, and cost attribution. ClearML’s 2025 findings on underused GPU capacity showed why the management layer is becoming harder to separate from infrastructure procurement. NVIDIA is well placed to capture part of that layer through orchestration, communications, and model-management tools that sit above silicon but still deepen platform dependency. That leaves server OEMs, integrators, and hosted infrastructure providers competing more heavily on packaging, operations, and time-to-production than on the core accelerator environment itself.
Several strategic moves from leading vendors show how the enterprise GPU infrastructure market is being contested. NVIDIA’s partnership with IREN tied capital support directly to AI campus deployment, which strengthens its influence over reference infrastructure at scale. Lenovo introduced its AI Cloud Gigafactory with NVIDIA in January 2026, while HPE expanded its AI Factory for Government in October 2025, showing how vendors are targeting both commercial and regulated buyers with full-stack offerings.[4]Lenovo Group Limited, “Lenovo Teams with NVIDIA on Gigawatt AI Factories Program to Accelerate Enterprise AI,” BusinessWire, businesswire.com Super Micro Computer also expanded its DCBBS portfolio around NVIDIA Vera Rubin platforms and separately pushed an AMD-based Helios path, which shows that system vendors are trying to widen design options even while NVIDIA remains the central standard.
Enterprise GPU Infrastructure Industry Leaders
NVIDIA Corporation
Super Micro Computer, Inc.
ASUSTeK Computer Inc.
GIGA-BYTE Technology Co., Ltd.
Quanta Computer Inc.
- *Disclaimer: Major Players sorted in no particular order

Recent Industry Developments
- June 2026: Super Micro Computer introduced the DCBBS Blueprint for HPC based on the NVIDIA Vera Rubin NVL4 platform at ISC 2026, enabling converged HPC and AI workloads with native FP64 performance. The blueprint scales across computer, networking, advanced liquid cooling, and site infrastructure in a single deployment framework, targeting research institutions and supercomputing centers.
- May 2026: NVIDIA and IREN announced a strategic partnership targeting deployment of up to 5 gigawatts of AI infrastructure globally. NVIDIA invested up to USD 2.1 billion in IREN through a five-year share purchase right, with the flagship IREN 2-gigawatt Sweetwater campus in Texas designated as the primary reference deployment for NVIDIA's DSX architecture.
- April 2026: Axe Compute secured a USD 260 million, 36-month enterprise GPU infrastructure contract to deploy a dedicated cluster of 2,304 NVIDIA B300 GPUs in a US Tier 3 data center, the company's largest enterprise engagement. The contract structure, combining dedicated GPU compute with AI-focused storage, serves as a model for long-term enterprise AI infrastructure financing.
- March 2026: Palantir and NVIDIA announced a Sovereign AI Operating System reference architecture enabling enterprises with existing GPU infrastructure to operate AI workloads under full data sovereignty, targeting latency-sensitive and data-resident enterprise environments globally.


Global Enterprise GPU Infrastructure Market Report Scope
The enterprise GPU infrastructure market covers the hardware, software, and services that enable organizations to deploy, manage, and scale graphics processing unit (GPU)-based computing environments for workloads such as artificial intelligence, machine learning, data analytics, visualization, simulation, and high-performance computing. The scope of the report includes an analysis of market trends, growth drivers, restraints, opportunities, competitive landscape, and key developments across major enterprise end-user industries and geographic regions.
The Enterprise GPU Infrastructure Market Report is Segmented by Component (GPU Compute Hardware, Supporting Infrastructure, Software and Tools, and Services), Deployment (On-Premises / Private Cloud, Public Cloud / Hosted GPU Infrastructure, and Hybrid and Multi-Cloud), Workload (AI Training and Fine-Tuning, AI Inference and Serving, High-Performance Computing and Simulation, Data Analytics and Machine Learning, and Visualization, Rendering, and Digital Twins), Cooling (Air Cooling, Direct Liquid Cooling, and Immersion Cooling), End User (Commercial and Private Enterprises, Hyperscalers, Cloud Service Providers, and GPU Cloud Providers, Government, Defense, Academia, and Research Institutions, and Telecom, Edge, and Colocation Operators), and Geography (North America, Europe, Asia-Pacific, South America, and Middle East and Africa). The Market Forecasts are Provided in Terms of Value (USD).
| GPU Compute Hardware |
| Supporting Infrastructure |
| Software and Management Tools |
| Services |
| On-Premises / Private Cloud |
| Public Cloud / Hosted GPU Infrastructure |
| Hybrid and Multi-Cloud |
| AI Training and Fine-Tuning |
| AI Inference and Serving |
| High-Performance Computing and Simulation |
| Data Analytics and Machine Learning |
| Visualization, Rendering, and Digital Twins |
| Air Cooling |
| Direct Liquid Cooling |
| Immersion Cooling |
| Commercial and Private Enterprises |
| Hyperscalers, Cloud Service Providers, and GPU Cloud Providers |
| Government, Defense, Academia, and Research Institutions |
| Telecom, Edge, and Colocation Operators |
| North America | United States |
| Canada | |
| Mexico | |
| Europe | Germany |
| United Kingdom | |
| France | |
| Italy | |
| Rest of Europe | |
| Asia-Pacific | China |
| Japan | |
| South Korea | |
| India | |
| Southeast Asia | |
| Rest of Asia-Pacific | |
| South America | |
| Middle East and Africa |
| By Component | GPU Compute Hardware | |
| Supporting Infrastructure | ||
| Software and Management Tools | ||
| Services | ||
| By Deployment Model | On-Premises / Private Cloud | |
| Public Cloud / Hosted GPU Infrastructure | ||
| Hybrid and Multi-Cloud | ||
| By Workload | AI Training and Fine-Tuning | |
| AI Inference and Serving | ||
| High-Performance Computing and Simulation | ||
| Data Analytics and Machine Learning | ||
| Visualization, Rendering, and Digital Twins | ||
| By Cooling Technology | Air Cooling | |
| Direct Liquid Cooling | ||
| Immersion Cooling | ||
| By End User | Commercial and Private Enterprises | |
| Hyperscalers, Cloud Service Providers, and GPU Cloud Providers | ||
| Government, Defense, Academia, and Research Institutions | ||
| Telecom, Edge, and Colocation Operators | ||
| By Geography | North America | United States |
| Canada | ||
| Mexico | ||
| Europe | Germany | |
| United Kingdom | ||
| France | ||
| Italy | ||
| Rest of Europe | ||
| Asia-Pacific | China | |
| Japan | ||
| South Korea | ||
| India | ||
| Southeast Asia | ||
| Rest of Asia-Pacific | ||
| South America | ||
| Middle East and Africa | ||


Key Questions Answered in the Report
What is the 2026 size of the enterprise GPU infrastructure market?
The enterprise GPU infrastructure market size is estimated at USD 374.82 billion in 2026 and is projected to reach USD 917.65 billion by 2031 at a 19.61% CAGR.
Which component leads current spending in enterprise GPU infrastructure?
GPU Compute Hardware led current spending with 76.92% share in 2025, reflecting the early buildout phase in which buyers secured raw compute capacity before broader optimization.
Which workload is expanding fastest across enterprise GPU deployments?
AI Inference and Serving is the fastest-growing workload, with a projected 21.16% CAGR through 2031, as production AI needs move closer to users and operating environments.
Why are hybrid deployment models gaining traction for enterprise AI systems?
Hybrid and Multi-Cloud is projected to grow at a 20.84% CAGR because enterprises want cloud elasticity for burst workloads and private control for sensitive inference and governed data.
How is cooling strategy changing in high-density GPU environments?
Air Cooling still held 62.43% share in 2025, but Immersion Cooling is projected to grow fastest at 20.92% CAGR as higher rack densities push operators toward liquid-based thermal control.
Which region is growing fastest for enterprise GPU capacity additions?
Asia-Pacific is projected to expand at a 20.76% CAGR through 2031, while North America remained the largest region in 2025 with a 49.34% share.
Page last updated on:


