GPU Middleware Market Size and Share
Market Overview
| Study Period | 2020 - 2031 |
|---|---|
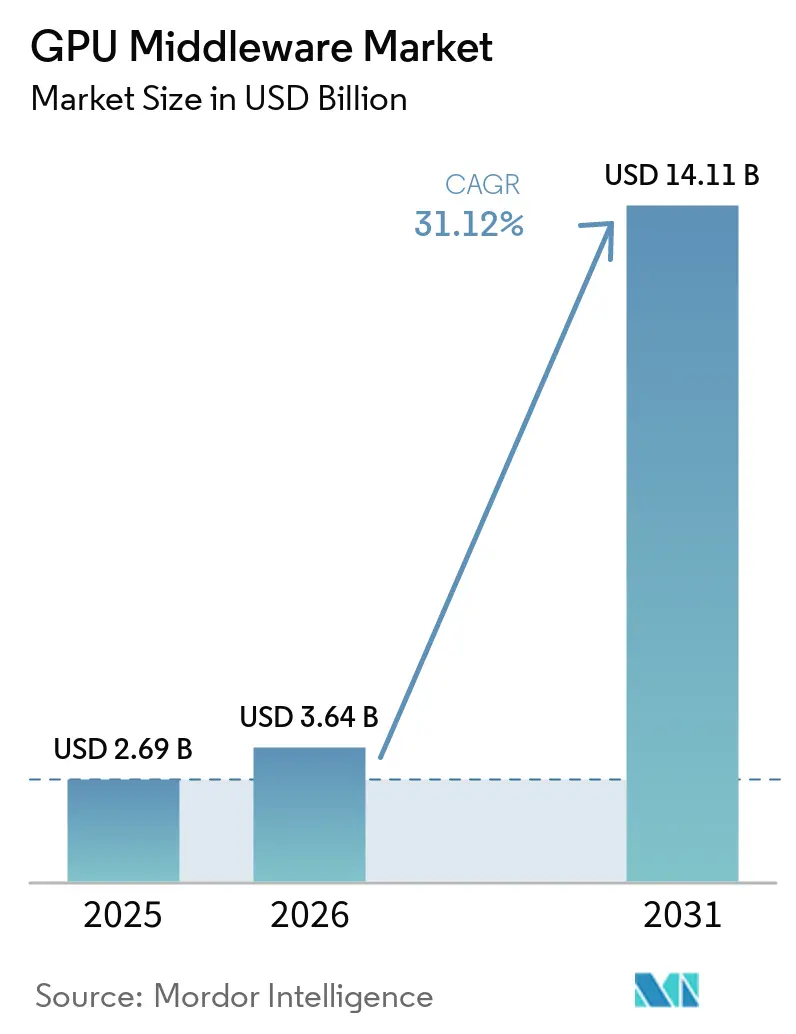
| Market Size (2026) | USD 3.64 Billion |
| Market Size (2031) | USD 14.11 Billion |
| Growth Rate (2026 - 2031) | 31.12% CAGR |
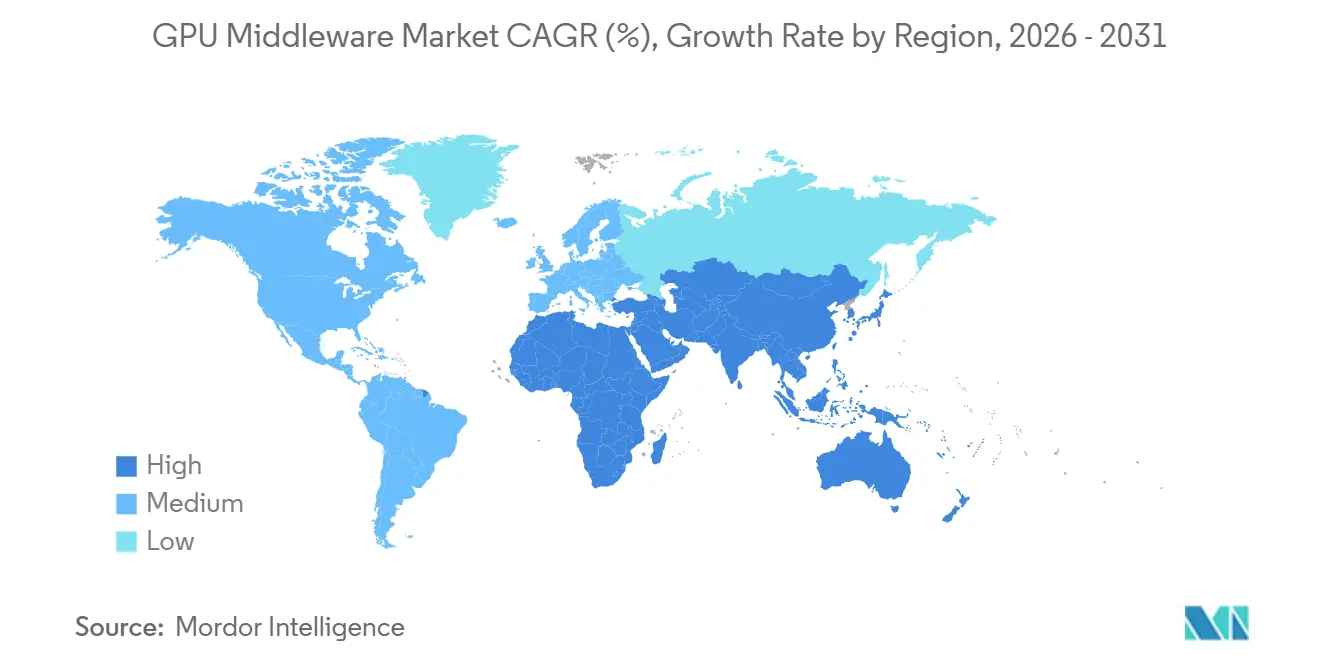
| Fastest Growing Market | Asia-Pacific |
| Largest Market | North America |
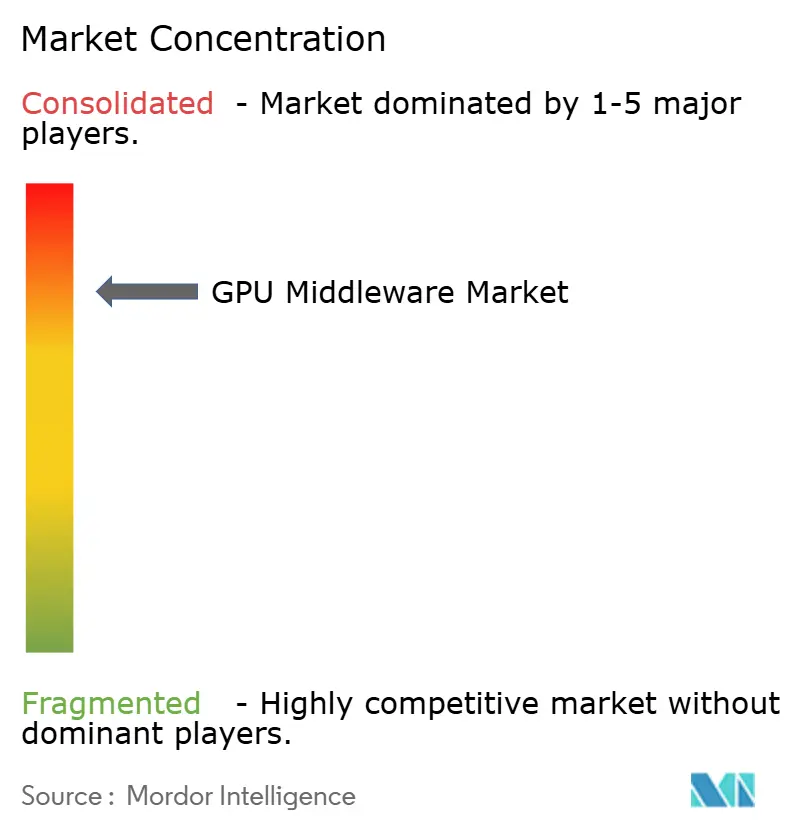
| Market Concentration | High |
Major Players *Disclaimer: Major Players sorted in no particular order Image © Mordor Intelligence. Reuse requires attribution under CC BY 4.0. | |
GPU Middleware Market Analysis by Mordor Intelligence
The GPU middleware market size is expected to increase from USD 2.69 billion in 2025 to USD 3.64 billion in 2026 and reach USD 14.11 billion by 2031, growing at a CAGR of 31.12% over 2026-2031. The GPU middleware market is expanding because large AI compute deployments now need dedicated scheduling, orchestration, and runtime control before clusters can be used efficiently at scale. Demand remains tied closely to hyperscaler and cloud-led infrastructure rollouts, which keeps procurement cycles concentrated among buyers that can deploy GPU capacity quickly. The revenue mix still favors software today, but implementation and optimization work is taking a larger role as clusters become more complex and more distributed across cloud, on-premises, and hybrid environments. Regional growth is strongest where sovereign AI investment, enterprise modernization, and data residency needs are pushing organizations to build or manage larger GPU estates. Competition in the GPU middleware market is shaped by vendors that combine hardware alignment, orchestration depth, and enterprise integration support, while growth still faces pressure from hardware availability, power constraints, and the specialized expertise needed to run GPU environments well.
Key Report Takeaways
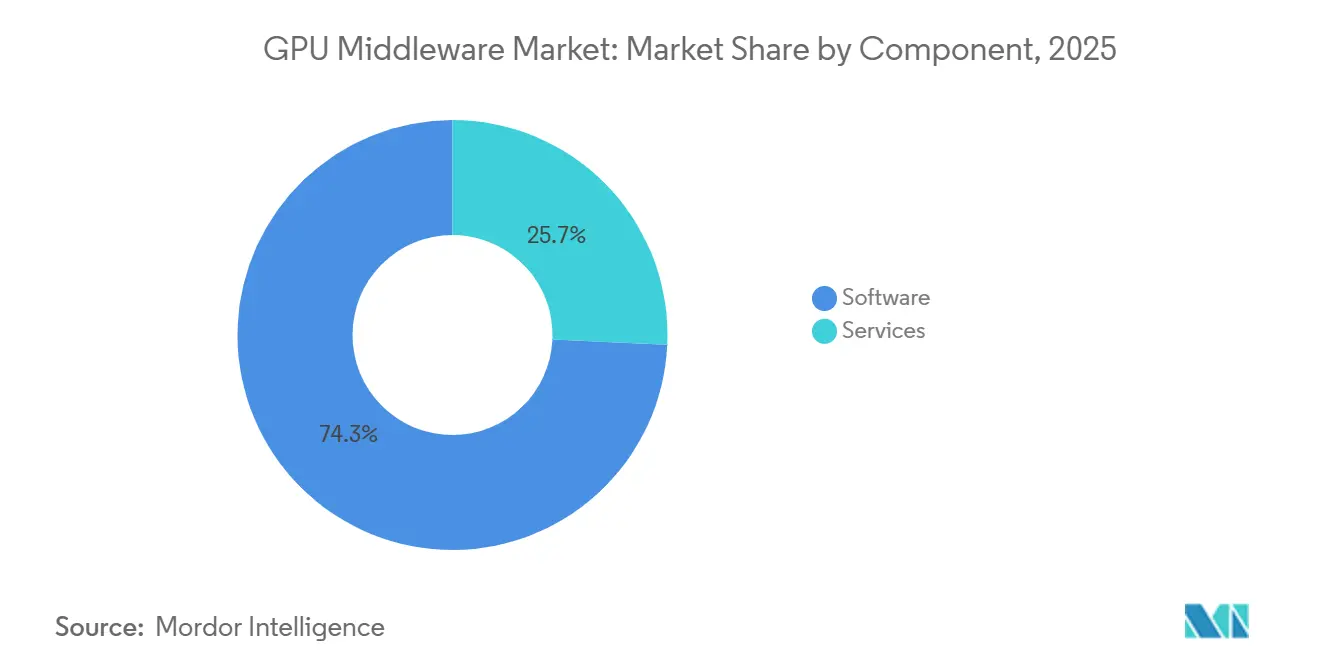
- By component, software accounted for 74.28% of the the GPU Middleware Market share in 2025, while services are projected to expand at a 32.56% CAGR through 2031.
- By deployment mode, cloud accounted for 52.41% of the GPU middleware market in 2025, while hybrid is expected to grow at a 31.96% CAGR through 2031.
- By enterprise size, large enterprises represented 81.34% of revenue in 2025, while small and medium enterprises are projected to grow at a 31.63% CAGR through 2031.
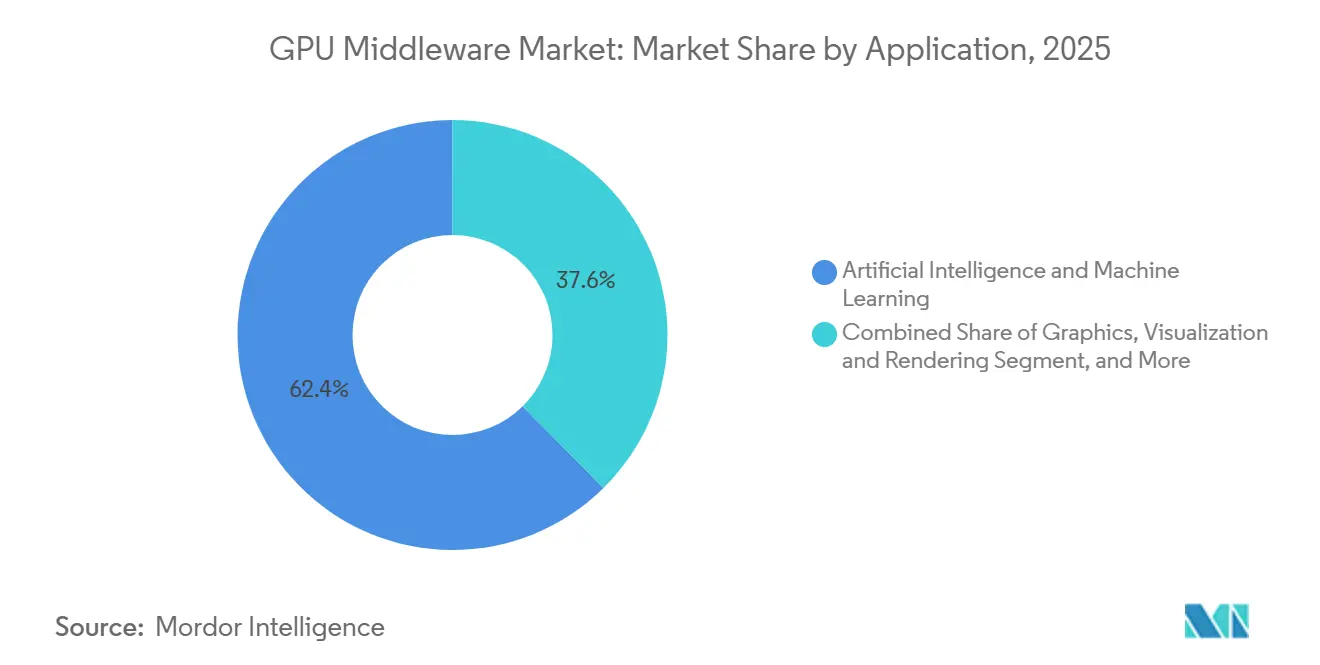
- By application, artificial intelligence and machine learning accounted for 62.39% of the market in 2025 and are projected to grow at a 32.14% CAGR through 2031.
- By end-user industry, cloud service providers, hyperscalers, and data center operators held 62.51% of revenue in 2025, while automotive is projected to expand at a 31.87% CAGR through 2031.
- By geography, North America led with 43.72% share of global GPU middleware market revenue in 2025, while Asia-Pacific is expected to advance at a 32.15% CAGR through 2031.
Note: Market size and forecast figures in this report are generated using Mordor Intelligence’s proprietary estimation framework, updated with the latest available data and insights as of January 2026.
Global GPU Middleware Market Trends and Insights
Drivers Impact Analysis*
| Driver | (~) % Impact on CAGR Forecast | Geographic Relevance | Impact Timeline |
|---|---|---|---|
| Rising AI Model Training and Inference GPU Density | +9.2% | Global, concentrated in North America and APAC | Short term (≤ 2 years) |
| Growing Enterprise Demand for Multi-Tenant GPU Resource Sharing | +7.5% | Global, with North America and Europe leading enterprise adoption | Short term (≤ 2 years) |
| Increasing Need for GPU Utilization Optimization in Cloud and On-Premises Environments | +5.8% | Global, with strongest pull in North America, Germany, and Japan | Medium term (2-4 years) |
| Expansion of High-Performance Computing Workloads Across Industries | +3.6% | North America, Europe, and APAC research institutions | Medium term (2-4 years) |
| Rising Adoption of Containerized AI and MLOps Workflows | +2.4% | North America and Europe, with spillover to APAC | Medium term (2-4 years) |
| Greater Use of Hybrid and Multi-Cloud GPU Infrastructure | +1.8% | Global, with early gains in regulated industries in Europe and APAC | Long term (≥ 4 years) |
| Source: Mordor Intelligence | |||
Rising AI Model Training and Inference GPU Density
The GPU middleware market is rising as AI model development increasingly depends on larger, denser compute environments. NVIDIA presented the Vera Rubin platform in June 2026 as a rack-scale system that combines CPU, GPU, networking, and software for science and AI workloads, which shows how tightly integrated next-generation deployments are becoming. Microsoft also announced a new datacenter campus in Pecos, Texas, in June 2026 to add around 2 gigawatts of AI and cloud capacity, reflecting how quickly infrastructure expansion continues in the core buyer base. NVIDIA and Eli Lilly also formed a co-innovation AI lab in January 2026, with up to USD 1 billion in planned investment over 5 years, indicating that large model workloads are spreading into highly regulated commercial settings.[1]NVIDIA, “NVIDIA and Eli Lilly Announce Co-Innovation AI Lab with Up to USD 1 Billion Investment,” NVIDIA Newsroom, nvidianews.nvidia.com As these clusters grow, the operational load on schedulers, memory control layers, and resource allocation tools also rises. That pattern keeps the GPU middleware market closely tied to every new wave of AI training and scale-up in inference.
Growing Enterprise Demand for Multi-Tenant GPU Resource Sharing
The GPU middleware market is also gaining from the need to share limited GPU resources across teams, models, and workloads without losing control. IBM Research, Red Hat, and NxtGen Cloud reported in June 2026 that the open-source llm-d framework delivered 3 to 5 times faster inference and doubled throughput on mixed GPU hardware, while indicating potential annual savings of up to USD 5.25 million per large deployment. NVIDIA also moved its Dynamic Resource Allocation driver for GPUs into the Kubernetes community and onboarded the KAI Scheduler as a CNCF Sandbox project in March 2026, enabling wider use of shared, policy-driven GPU scheduling. Red Hat is built in the same direction as its AI Factory with NVIDIA, which offers pooled access, intelligent orchestration, and automatic checkpointing for long-running jobs. These moves reduce the need for a single application or team to reserve entire clusters for long periods. That supports the GPU middleware market because multi-tenant control becomes a central buying criterion rather than an optional feature.
Increasing Need for GPU Utilization Optimization in Cloud and On-Premises Environments
The GPU middleware market benefits when organizations focus on improving output from existing GPU estates instead of adding hardware first. NVIDIA open-sourced the KAI Scheduler and donated the Dynamic Resource Allocation driver for GPUs in 2026, which helps standardize how Kubernetes-native environments assign and manage accelerators. Red Hat OpenShift 4.21 also moved Dynamic Resource Allocation to general availability in March 2026, replacing the older device plugin model with more detailed, attribute-aware scheduling. HPE also expanded its AI Factory portfolio with Mission Control integration and Red Hat OpenShift support, which showed that enterprise buyers want orchestration layers that can manage hybrid AI environments with less manual intervention. When utilization becomes the main economic question, buyers place more value on scheduling quality, policy enforcement, and workload placement logic. That shifts spending toward the GPU middleware market because software becomes the tool that determines whether expensive GPU capacity is actually productive.
Expansion of High-Performance Computing Workloads Across Industries
The GPU middleware market is also supported by the growing use of high-performance computing beyond traditional research environments. NVIDIA positioned Vera Rubin for both scientific computing and AI workloads, suggesting a closer connection between simulation- and model-heavy infrastructure. AMD also previewed the Instinct MI430X GPU in June 2026, with more than 200 teraflops of native FP64 performance, indicating that vendors continue to target compute-intensive industrial and scientific use cases. NVIDIA and Eli Lilly’s January 2026 lab showed the same convergence in practice, with biomedical foundation models being applied to drug discovery and manufacturing optimization. MORAI’s June 2026 launch of a next-generation digital twin simulation platform also pointed to rising demand from validation-heavy automotive workflows. As more industries adopt simulation, digital twins, and AI within a single operating environment, the GPU middleware market benefits from the need to coordinate mixed workloads across shared clusters.
Restraints Impact Analysis*
| Restraint | (~) % Impact on CAGR Forecast | Geographic Relevance | Impact Timeline |
|---|---|---|---|
| High GPU Infrastructure Cost and Integration Complexity | -6.2% | Global, most acute in emerging APAC and South America | Short term (≤ 2 years) |
| Limited Talent for GPU Orchestration, CUDA Tuning, and Cluster Optimization | -4.1% | Global, with critical shortfalls in Europe and South America | Medium term (2-4 years) |
| Power, Cooling, and Rack Density Constraints in Legacy Data Centers | -2.8% | North America, Europe, and South America | Medium term (2-4 years) |
| Export Controls and Hardware Allocation Volatility for Advanced GPUs | -1.9% | APAC, Middle East and Africa | Short term (≤ 2 years) |
| Source: Mordor Intelligence | |||
High GPU Infrastructure Cost and Integration Complexity
The GPU middleware market still faces a clear barrier: scaling GPU infrastructure requires significant upfront investment and careful integration. CoreWeave closed a USD 8.5 billion financing facility in March 2026, followed by a further USD 3.1 billion loan facility in May 2026, underscoring how capital-intensive GPU platform expansion has become, even for specialized providers. Microsoft’s June 2026 Pecos announcement also underlined that major AI capacity additions now happen at a very large scale, which smaller buyers cannot easily match. On the deployment side, Red Hat’s AI Factory with NVIDIA was validated across hardware from Cisco, Dell Technologies, Lenovo, and Supermicro, which shows that real-world implementation often requires tested combinations across multiple layers. HPE’s AI Factory portfolio follows the same logic by packaging orchestration, tenancy, and enterprise software into certified systems. Until these deployments become easier and cheaper to stand up, the GPU middleware market will continue to face slower adoption.
Limited Talent for GPU Orchestration, CUDA Tuning, and Cluster Optimization
The GPU middleware market also faces a talent problem because strong results depend on correct setup, tuning, and scheduling rather than hardware alone. A 2026 study in The Journal of Supercomputing found that MPS can improve co-execution performance by up to 30% and reduce energy use by 20% under favorable workloads, but it can also worsen performance by 30% under memory contention. That range shows how sensitive outcomes can be when teams do not configure sharing and placement policies well. Red Hat’s move to general availability for Dynamic Resource Allocation gives administrators more control over GPU attributes, but it also raises the technical bar for teams that must define and govern those policies. NVIDIA’s open-source scheduler work helps standardize the stack, yet it does not remove the need for specialist knowledge in cluster operations and workload tuning. This slows direct adoption in parts of the GPU middleware market where organizations want production AI capability but still lack experienced infrastructure teams.
*Our forecasts treat driver/restraint impacts as directional, not additive. The impact forecasts reflect baseline growth, mix effects, and variable interactions.
Segment Analysis
By Component: Services Demand Reflects Infrastructure Complexity Inflection
Software accounted for 74.28% of revenue in 2025, while services are forecast to grow at a 32.56% CAGR through 2031. This revenue split shows that buyers still spend most heavily on schedulers, virtualization tools, and runtime software when they first build out GPU environments. The current mix also reflects how the GPU middleware market developed around platform control, cluster management, and container-ready software layers. NVIDIA’s decision to open-source the KAI Scheduler and donate the Dynamic Resource Allocation driver for GPUs in 2026 reinforced software’s central position in the stack. Red Hat’s general availability release of Dynamic Resource Allocation in OpenShift 4.21 also highlighted a maturing software layer that is becoming more standardized across enterprise deployments.
Services, however, are expanding faster because deployment complexity is now harder to absorb solely through software. Red Hat AI Factory with NVIDIA includes GPU-as-a-Service orchestration, pooled access, and automatic checkpointing, and that kind of rollout usually requires structured implementation support and operating guidance. HPE also pushed the same direction through its AI Factory portfolio, where Mission Control software and hybrid deployment support are packaged with enterprise infrastructure services.[2]HPE, “HPE Unveils Next-Generation AI Factory and Supercomputing Advancements with NVIDIA,” HPE Newsroom, hpe.com Anyscale’s June 2026 release of Ray Data with NVIDIA cuDF support showed that even cost and performance gains at the workload layer still depend on strong integration into broader operating environments. In practice, the faster growth of services suggests that the GPU middleware market is moving from software purchase decisions toward software plus deployment outcomes. That shift should keep service-heavy engagements important as organizations move from pilot clusters to production-scale estates.


By Deployment Mode: Hybrid Momentum Reshapes the Cloud-First Default
Cloud represented 52.41% of revenue in 2025, while hybrid is projected to record the fastest growth at a 31.96% CAGR through 2031. That split shows that the largest share of current spending still goes to managed GPU access, which lets enterprises get started quickly without building dedicated infrastructure first. At the same time, the faster hybrid growth rate indicates that the GPU middleware market is moving toward mixed operating models rather than a cloud-only default. This pattern meets enterprise needs by combining burst training, internal data control, and varying latency requirements across workloads. It also reflects the fact that cloud and on-premises environments are being treated less as alternatives and more as interconnected parts of a single operating stack.
Vendor moves support that direction. Red Hat’s AI Factory with NVIDIA was built around pooled access and orchestration across enterprise environments, which fits organizations that want internal control without giving up flexible resource sharing. HPE’s March 2026 AI Factory updates also highlighted multi-scale tenancy, Mission Control integration, and Red Hat OpenShift support for hybrid AI deployments. Microsoft’s April 2026 announcement on Japan showed how in-country AI infrastructure and local compute services remain important where data residency matters. The GPU middleware market is therefore seeing hybrid gain traction because it gives buyers policy control, workload flexibility, and more room to align infrastructure with internal governance. Edge and embedded deployments remain smaller, but the same hybrid logic is starting to influence real-time use cases in automotive and industrial settings.
By Enterprise Size: Demand Beyond Large-Enterprise Core Accelerates
Large enterprises held 81.34% of revenue in 2025, while small and medium enterprises are expected to grow at a 31.63% CAGR through 2031. The current revenue concentration reflects the cost and operational demands of building and managing GPU clusters at scale. In 2025, large organizations still led the GPU middleware market because they had stronger budgets, internal engineering teams, and clearer AI production road maps. Their early demand also helped shape product design around multi-cluster governance, quota management, and enterprise integration. That is why much of the installed base still sits with buyers that can support more customized deployment and operating models.
The faster SME growth rate points to a different phase of expansion. A 2025 study in Applied Sciences found that shared infrastructure models and public-private AI computation centers can lower barriers for smaller firms seeking AI capabilities without heavy capital investment. That finding aligns with the broader shift toward managed, pooled, and consumption-oriented GPU access in the GPU middleware market. Red Hat and HPE have both emphasized packaged AI factory approaches that reduce setup friction, while Anyscale’s GPU-native data processing release shows that developers increasingly want simpler paths to production performance. As smaller firms adopt AI more seriously, they are likely to favor delivery models that hide infrastructure complexity while preserving access to advanced GPU scheduling and orchestration. That keeps SME growth meaningful for the GPU middleware market even though revenue remains anchored in the large-enterprise base today.
By Application: AI and ML Workloads Set the Pace Across All Segments
Artificial intelligence and machine learning accounted for 62.39% of demand in 2025, making it the largest application area in the GPU middleware market. The same category also remains the fastest-growing application group throughout the forecast period, keeping product development focused on training, inference, and model-serving efficiency. This dual role matters because vendors can justify feature investment when the largest workload class is also the fastest-expanding one. It also means that allocation logic, memory handling, and distributed execution remain the most commercially important capabilities in the current cycle. The GPU middleware market is therefore being shaped first by AI and ML workload behavior and only second by adjacent use cases.
That lead does not limit expansion into other applications. NVIDIA and Eli Lilly launched a co-innovation AI lab in January 2026 to apply large-scale models to drug discovery and manufacturing optimization, which showed how quickly AI-centric GPU workflows are moving into life sciences. NVIDIA’s Vera Rubin announcement in June 2026 also showed that AI and scientific computing are being positioned on the same rack-scale architecture. MORAI’s June 2026 platform launch added another signal, with digital twin simulation being used for ADAS validation, virtual homologation, and autonomous systems testing. Those examples show that adjacent workloads are still growing, but they increasingly connect back to AI-centered infrastructure patterns. As a result, the GPU middleware market continues to treat AI and ML as the anchor use case that influences platform design across the rest of the application mix.

By End-User Industry: Automotive Disrupts a CSP-Dominated Revenue Mix
Cloud service providers, hyperscalers, and data center operators held 62.51% of end-user revenue in 2025, while automotive is projected to expand at a 31.87% CAGR through 2031. That concentration shows how heavily the GPU middleware market still depends on organizations that can deploy compute at scale and monetize shared infrastructure quickly. In the current cycle, these buyers remain the main source of large contracts, platform standardization, and rapid capacity additions. Their lead also explains why cloud readiness, orchestration depth, and control over mixed tenancy remain central product requirements. This part of the GPU middleware market is stable because it ties directly to the largest ongoing AI infrastructure build-out programs.
Automotive, however, is growing faster because software-defined vehicle systems require continuous simulation, validation, and iterative testing. MORAI’s next-generation digital twin simulation platform, launched in June 2026, directly targeted ADAS validation and regulator-aligned autonomous systems testing, which supports that shift. The same pattern appears in the life sciences, where NVIDIA and Eli Lilly’s AI lab demonstrated that industry-specific GPU workflows are becoming more persistent and operational. CoreWeave’s expanding collaboration with NVIDIA also underlined how purpose-built GPU supply remains important for service-heavy end users that want reliable access at scale. The result is a GPU middleware market where hyperscalers still dominate revenue, but new vertical growth is becoming more durable and more specialized. That should gradually reduce the risk of overdependence on one buyer group, even if cloud-led demand remains the core revenue base through the near term.
Geography Analysis
North America accounted for 43.72% of global revenue in 2025, making it the largest regional contributor to the GPU middleware market. This lead reflects the region’s dense concentration of hyperscaler campuses, AI software vendors, and enterprise GPU deployments. Microsoft announced a new datacenter campus in Pecos, Texas, in June 2026, adding around 2 gigawatts of AI and cloud capacity, which reinforced North America’s role as the largest infrastructure build zone in the current cycle. NVIDIA also invested USD 2 billion in CoreWeave in January 2026 as part of an expanded collaboration to accelerate more than 5 gigawatts of AI factory capacity by 2030.[3]Microsoft, “Powering the Next Wave of AI, Expanding Capacity with Our New Datacenter in Pecos,” The Official Microsoft Blog, blogs.microsoft.com These moves support the region’s scale advantage because infrastructure, software, and service layers are being expanded together. South America remained smaller, but demand continued to build through managed cloud access and regional enterprise modernization programs. In practical terms, North America still sets the pace for product maturity, deployment scale, and vendor alignment in the GPU middleware market.
Europe is developing the GPU middleware market through a different path that places more weight on governance, sovereignty, and enterprise control. The region’s demand pattern favors cloud-agnostic and on-premises deployment models in workloads that involve compliance-sensitive data. France’s national AI strategy identified GPU middleware innovation as a priority area for support, which showed that the software coordination layer is being treated as strategically important rather than secondary. This policy backdrop supports steady demand for orchestration tools that can fit localized deployment choices and stricter operating requirements. As a result, Europe contributes to the GPU middleware market less through sheer scale and more through the push for controllable and sovereign operating models.
Asia-Pacific is the fastest-growing region, with the GPU middleware market size in this geography projected to advance at a 32.15% CAGR through 2031. The region is benefiting from sovereign AI investment, expanding enterprise demand, and a wider push for in-country compute capability. Microsoft announced a USD 10 billion investment in Japan in April 2026, including work with Sakura Internet and SoftBank to provide GPU-based AI compute services with domestic data residency. That example captures the regional theme clearly, because growth is being driven not only by capacity additions but also by local control requirements. Asia-Pacific’s faster pace means it is becoming a more important source of new contracts, especially where enterprises and public institutions want AI infrastructure within national boundaries. This momentum should keep the GPU middleware market geographically more balanced over time, even though North America still leads in current revenue.

Competitive Landscape
The GPU middleware market is highly consolidated, with NVIDIA holding the strongest structural position because its software strategy is closely tied to its hardware. NVIDIA closed the acquisition of Run AI at the end of 2024 and then open-sourced the KAI Scheduler in 2025, which turned a proprietary scheduling asset into a community-facing control point. In March 2026, NVIDIA also donated the Dynamic Resource Allocation driver for GPUs to the Kubernetes community and moved the KAI Scheduler into the CNCF Sandbox, helping extend its influence across the broader orchestration layer. These steps give NVIDIA more than product visibility, because they place the company close to the standards and interfaces that many deployments will use. In the GPU middleware market, that is an advantage that pure software vendors struggle to match.
Large systems vendors are competing by packaging orchestration with infrastructure and enterprise support. Red Hat launched AI Factory with NVIDIA in early 2026 to provide GPU-as-a-Service orchestration, pooled infrastructure access, and checkpointing in a more standardized enterprise format. HPE followed with AI Factory portfolio updates in March 2026 that added multi-scale tenancy, Mission Control integration, and Red Hat OpenShift support for hybrid deployments. CoreWeave and NVIDIA also expanded their collaboration in January 2026 around future AI factory capacity and early platform access, which showed how infrastructure specialists are using close vendor alignment as a competitive lever. These strategic moves suggest that the GPU middleware market is rewarding vendors that can reduce integration friction while preserving performance and scale.
There is still room for specialists, but the openings are narrower and more targeted. Anyscale’s June 2026 Ray Data release with NVIDIA cuDF support focused on cost reduction and workflow unification, which showed how developer-oriented players can compete by simplifying execution paths rather than by owning the full stack. IBM Research’s llm-d results also showed that mixed-hardware optimization and inference efficiency remain active areas for differentiation.[4]IBM Research, “Running AI on Mixed Hardware for Speed and Affordability,” IBM Research Blog, research.ibm.com The GPU middleware market therefore remains open to vendors that solve specific workload, cost, or usability problems. Even so, the strongest positions still sit with companies that can tie orchestration to broader infrastructure ecosystems. That balance supports a moderately concentrated structure rather than a fully fragmented one.
GPU Middleware Industry Leaders
NVIDIA Corporation
Amazon Web Services, Inc.
Microsoft Corporation
International Business Machines Corporation
Oracle Corporation
- *Disclaimer: Major Players sorted in no particular order

Recent Industry Developments
- June 2026: Microsoft announced a new datacenter campus in Pecos, Texas, adding approximately 2 gigawatts of AI and cloud compute capacity, one of the company's largest single infrastructure additions, expected to support over 6,000 construction jobs at peak build-out. The investment reflects sustained enterprise demand for GPU-accelerated AI services across industries.
- June 2026: Anyscale launched Ray Data with NVIDIA cuDF support, enabling GPU-native multimodal data processing that reduces cost by 80% compared with equivalent CPU-only pipelines on NVIDIA RTX PRO 4500 Blackwell hardware. The capability positions Ray as a unified distributed system combining data preparation and model training, reducing infrastructure fragmentation for AI platform teams.
- June 2026: IBM Research, Red Hat, and NxtGen Cloud published results for llm-d, demonstrating 3 to 5 times faster inference and doubled throughput on mixed GPU hardware compared with standard Kubernetes deployments, with potential cost savings of up to USD 5.25 million annually per large model deployment.
- June 2026: MORAI launched a next-generation digital twin simulation platform targeting ADAS validation, virtual homologation, and regulator-aligned autonomous systems testing, with initial deployment focused on automotive domains and expanding toward defense applications.


Global GPU Middleware Market Report Scope
GPU middleware refers to the software layer that enables applications to access, manage, and optimize graphics processing unit (GPU) resources for tasks such as rendering, parallel computing, artificial intelligence, machine learning, simulation, visualization, and high-performance computing. The scope of the report covers GPU middleware solutions used across industries, including gaming and entertainment, automotive, healthcare, manufacturing, data centers, and other end-user applications, and analyzes market trends, growth drivers, challenges, competitive landscape, and opportunities during the forecast period.
The GPU Middleware Market Report is Segmented by Component (Software, and Services), Deployment Mode (Cloud, On-Premises, Hybrid, and Edge/Embedded), Enterprise Size (Large Enterprises, and Small and Medium Enterprises), Application (Artificial Intelligence and Machine Learning, High-Performance Computing and Scientific/Engineering Simulation, Data Analytics, Databases and Graph Processing, Graphics, Visualization and Rendering, Virtual Desktop Infrastructure and Remote Workstations, and Digital Twins and Industrial Simulation), End-User Industry (Cloud Service Providers, Hyperscalers and Data Center Operators, Information Technology and Telecommunications, Banking, Financial Services and Insurance, Healthcare and Life Sciences, Media and Entertainment, Automotive, Manufacturing, and Other End-User Industries), and Geography (North America, Europe, Asia-Pacific, South America, and Middle East and Africa). The Market Forecasts are Provided in Terms of Value (USD).
| Software |
| Services |
| Cloud |
| On-Premises |
| Hybrid |
| Edge/Embedded |
| Large Enterprises |
| Small and Medium Enterprises |
| Artificial Intelligence and Machine Learning |
| High-Performance Computing and Scientific/Engineering Simulation |
| Data Analytics, Databases and Graph Processing |
| Graphics, Visualization and Rendering |
| Virtual Desktop Infrastructure and Remote Workstations |
| Digital Twins and Industrial Simulation |
| Cloud Service Providers, Hyperscalers and Data Center Operators |
| Information Technology and Telecommunications |
| Banking, Financial Services and Insurance |
| Healthcare and Life Sciences |
| Media and Entertainment |
| Automotive |
| Manufacturing |
| Other End-User Industries |
| North America | United States |
| Canada | |
| Mexico | |
| Europe | Germany |
| United Kingdom | |
| France | |
| Italy | |
| Rest of Europe | |
| Asia-Pacific | China |
| Japan | |
| South Korea | |
| India | |
| Southeast Asia | |
| Rest of Asia-Pacific | |
| South America | |
| Middle East and Africa |
| By Component | Software | |
| Services | ||
| By Deployment Mode | Cloud | |
| On-Premises | ||
| Hybrid | ||
| Edge/Embedded | ||
| By Enterprise Size | Large Enterprises | |
| Small and Medium Enterprises | ||
| By Application | Artificial Intelligence and Machine Learning | |
| High-Performance Computing and Scientific/Engineering Simulation | ||
| Data Analytics, Databases and Graph Processing | ||
| Graphics, Visualization and Rendering | ||
| Virtual Desktop Infrastructure and Remote Workstations | ||
| Digital Twins and Industrial Simulation | ||
| By End-User Industry | Cloud Service Providers, Hyperscalers and Data Center Operators | |
| Information Technology and Telecommunications | ||
| Banking, Financial Services and Insurance | ||
| Healthcare and Life Sciences | ||
| Media and Entertainment | ||
| Automotive | ||
| Manufacturing | ||
| Other End-User Industries | ||
| By Geography | North America | United States |
| Canada | ||
| Mexico | ||
| Europe | Germany | |
| United Kingdom | ||
| France | ||
| Italy | ||
| Rest of Europe | ||
| Asia-Pacific | China | |
| Japan | ||
| South Korea | ||
| India | ||
| Southeast Asia | ||
| Rest of Asia-Pacific | ||
| South America | ||
| Middle East and Africa | ||


Key Questions Answered in the Report
What is the current and forecast size of the GPU middleware space?
The GPU middleware market size stood at USD 2.69 billion in 2025, reached USD 3.64 billion in 2026, and is forecast to reach USD 14.11 billion by 2031 at a 31.12% CAGR.
Which component category leads revenue in this space?
Software led with 74.28% of revenue in 2025, reflecting strong demand for scheduling, orchestration, virtualization, and runtime control layers.
Why is hybrid deployment gaining traction for GPU orchestration?
Hybrid is projected to grow at a 31.96% CAGR because enterprises want cloud flexibility together with on-premises control for data residency, latency, and governance needs.
Which application area drives the strongest demand for GPU middleware?
Artificial intelligence and machine learning accounted for 62.39% of demand in 2025 and remained the fastest-growing application category through the forecast period.
Which end-user group currently spends the most on GPU middleware?
Cloud service providers, hyperscalers, and data center operators led with 62.51% of end-user revenue in 2025 due to their large-scale infrastructure buildouts.
Which region is growing the fastest, and which region is the largest?
North America was the largest region, accounting for 43.72% of revenue in 2025, while Asia-Pacific is forecast to grow the fastest at a 32.15% CAGR through 2031.
Page last updated on:


