
Market Overview
| Study Period | 2020 - 2031 |
|---|---|
| Market Size (2026) | USD 49.62 Billion |
| Market Size (2031) | USD 64.23 Billion |
| Growth Rate (2026 - 2031) | 5.30 % |
| Fastest Growing Market | Asia Pacific |
| Largest Market | Asia Pacific |
| Market Concentration | Medium |
Major Players
*Disclaimer: Major Players sorted in no particular order Image © Mordor Intelligence. Reuse requires attribution under CC BY 4.0. |
|
Computer Monitor Market Analysis by Mordor Intelligence
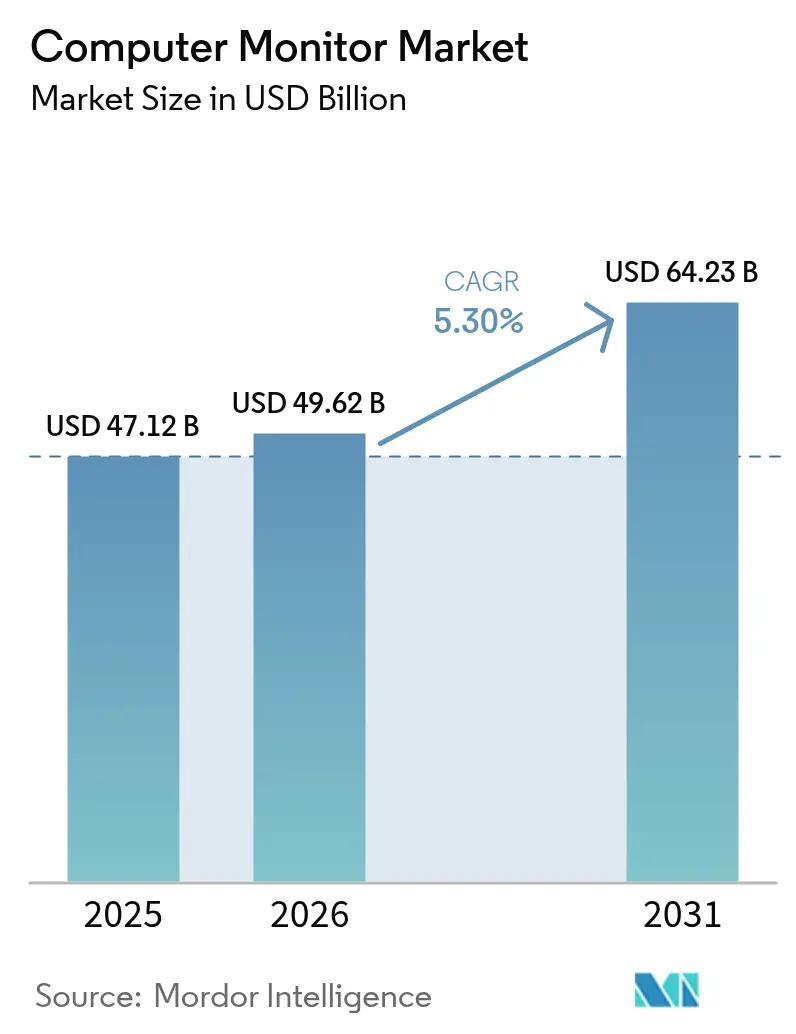
The computer monitor market size was valued at USD 47.12 billion in 2025 and estimated to grow from USD 49.62 billion in 2026 to reach USD 64.23 billion by 2031, at a CAGR of 5.30% during the forecast period (2026-2031). Resilient demand persists as hybrid work expands multi-monitor deployments, gaming ecosystems press for ultra-high refresh rates, and enterprises accelerate digital transformation. Manufacturers lift average selling prices by pairing 4K resolution with USB-C single-cable connectivity that streamlines desk setups. OLED and mini-LED technologies outpace LCD growth because corporate buyers value energy efficiency and color fidelity, while EU energy-efficiency rules compel continuous power-saving innovation. Intensifying competition encourages scale players such as Dell Technologies and HP Inc. to bundle services, leaving specialist brands to differentiate through panel breakthroughs and carbon-neutral designs.
Key Report Takeaways
- By product type, standard office monitors led with 47.65% revenue share in 2025, while gaming monitors are projected to expand at a 13.58% CAGR through 2031.
- By panel technology, IPS held 45.90% of the 2025 computer monitor market share, whereas OLED and mini-LED panels are advancing at an 17.85% CAGR to 2031.
- By screen size, 21-24 inch models commanded 41.62% of the computer monitor market size in 2025; displays ≥30 inches are forecast to grow at 11.92% CAGR.
- By resolution, Full HD accounted for 53.70% of 2025 revenue, yet 4K units are accelerating at a 15.62% CAGR through 2031.
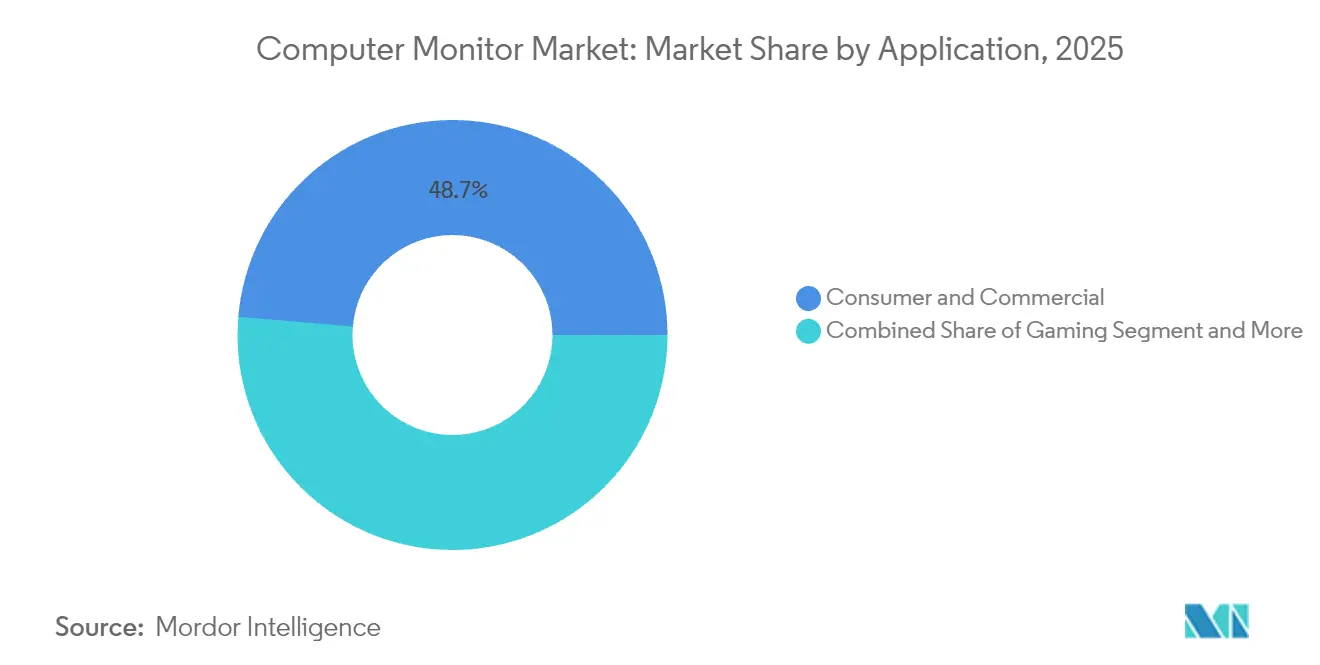
- By application, consumer and commercial uses captured 48.65% share in 2025, while gaming applications register the fastest 12.76% CAGR.
- By distribution channel, online sales represented 56.05% of 2025 value and are expected to progress at 13.74% CAGR.
- By geography, Asia Pacific dominated with 39.10% share in 2025 and is predicted to post an 10.95% CAGR, the highest among all regions.
Note: Market size and forecast figures in this report are generated using Mordor Intelligence’s proprietary estimation framework, updated with the latest available data and insights as of 2026.
Global Computer Monitor Market Trends and Insights
Drivers Impact Analysis*
| Driver | (~) % Impact on CAGR Forecast | Geographic Relevance | Impact Timeline |
|---|---|---|---|
| Gaming and e-sports proliferation | +2.1% | North America and Asia Pacific | Medium term (2-4 years) |
| Rapid adoption of 4K, HDR, OLED and mini-LED | +1.8% | North America and Europe expanding to Asia Pacific | Long term (≥4 years) |
| Hybrid/remote work multi-monitor demand | +1.3% | Global | Short term (≤2 years) |
| Falling ASP of high-resolution panels | +0.9% | Global | Medium term (2-4 years) |
| Enterprise shift to USB-C monitors | +0.7% | North America and Europe | Medium term (2-4 years) |
| ESG-driven demand for carbon-neutral displays | +0.4% | Europe expanding globally | Long term (≥4 years) |
| Source: Mordor Intelligence | |||
Gaming and e-sports proliferation
Global gaming-monitor shipments climbed sharply in 2024 as professional leagues standardized 240 Hz to 480 Hz refresh rates, prompting vendors to launch OLED panels with ultra-low latency[1]ASUS Republic of Gamers. "ASUS Republic of Gamers Unveils Three Premium 1440p Gaming Monitors during Gamescom 2024." August 21, 2024. . Hardware once confined to enthusiasts now permeates content-creator studios and financial-trading floors, widening the addressable base for premium displays. Tournament sponsors heighten visibility, encouraging mainstream consumers to view high-performance monitors as essential gear. Hardware companies also partner with e-sports organizations, converting brand affinity into steady volume contracts. Strong fan-driven demand underpins a double-digit growth runway even as broader PC sales level off.
Rapid adoption of 4K, HDR, OLED and mini-LED
OLED monitor volumes rose triple digits in 2024, supported by Samsung Display’s quantum-dot OLED capacity expansion that captured 34.7% of the premium segment. Mini-LED backlights bridge OLED-class contrast and LCD reliability, attracting medical-imaging and broadcast-editing buyers. HDR10 and Dolby Vision certifications transition from niche to baseline features, spurred by rising 4K video production. Suppliers leverage premium pricing to offset capital-intensive fabs while enterprises accept higher costs to secure energy savings and color precision. As factories reach scale, 4K panels displace 1440p in mainstream price tiers, reinforcing a virtuous upgrade cycle.
Hybrid/remote work multi-monitor demand
Portable and 27-inch monitors experienced triple-digit unit gains in 2024 as enterprises equipped distributed teams with standardized dual-screen kits[2]Owler. "ViewSonic's Competitors, Revenue, Number of Employees, Funding, Acquisitions & News - Owler Company Profile." April 24, 2025. . USB-C connectivity simplifies cabling, while embedded webcams and microphones support unified communications platforms. Employers justify higher budgets by correlating additional screen real estate with productivity upticks documented in internal time-and-motion studies. Vendors add ergonomic stands and blue-light filters to meet occupational-health mandates, further lifting bill-of-materials value. Momentum persists because hybrid work is now codified in corporate policy rather than treated as a stopgap.
Falling ASP of high-resolution panels
Panel oversupply in Asia Pacific pushed 4K LCD module prices below historic 1440p levels during 2024, enabling mass-market PCs to ship with UHD displays[3]TrendForce. "Global Monitor Market Set for Recovery in 2024, with Shipments Projected to Increase by 2%, Says TrendForce." February 5, 2024. . Manufacturers redeploy cost savings toward firmware that unlocks adaptive-sync and color-calibration features. Channel partners bundle monitors with mid-range GPUs, spurring whole-system upgrades and accelerating refresh cycles. Lower entry prices erode differentiation for basic 1080p models, pressuring suppliers to innovate beyond resolution. The pricing curve also compresses margins, prompting horizontal consolidation and OEM-ODM partnerships that share tooling expenses.
Restraints Impact Analysis*
| Restraint | (~) % Impact on CAGR Forecast | Geographic Relevance | Impact Timeline |
|---|---|---|---|
| Smartphones and tablets as PC substitutes | –1.4% | Emerging markets | Long term (≥4 years) |
| Panel-price volatility and supply shocks | –0.8% | Global | Short term (≤ 2 years) |
| EU energy-efficiency limits on high-spec models | –0.6% | Europe | Medium term (2-4 years) |
| Rising e-waste compliance costs | –0.3% | Developed markets | Long term (≥4 years) |
| Source: Mordor Intelligence | |||
Smartphones and tablets as PC substitutes
Enhanced mobile silicon and desktop-class productivity suites let budget-conscious users in Latin America, Southeast Asia, and Africa bypass stand-alone displays for everyday tasks. Keyboard docks and casting protocols extend mobile screens onto TVs, narrowing performance gaps with entry PCs. Monitor upgrades thus defer until use-cases demand pixel density or multi-window efficiency that handhelds cannot deliver. Brands counter by positioning low-cost monitors as console companions and study aids, but attach rates remain lower than in developed regions. Over time, emerging-market penetration hinges on aspirational gaming and creator aspirations that stretch beyond handheld ergonomics.
EU energy-efficiency limits on high-spec models
Regulation 2023/826 caps standby power at 0.5 W in 2025 and 0.3 W by 2027, constraining RGB lighting arrays, high-speed USB hubs, and fast-charging ports common in enthusiast displays. Research and development budgets divert to new power-management chipsets, elongating product-launch roadmaps and raising bill-of-materials costs. Some vendors opt to limit European SKU availability, shrinking assortment breadth for gamers and professionals seeking bleeding-edge features. Firms capable of firmware-level power gating secure compliance at lower cost, carving competitive moats. Over the medium term, power ceilings tighten further, compelling panel technologies with inherently lower draw such as OLED and micro-LED.
*Our forecasts treat driver/restraint impacts as directional, not additive. The impact forecasts reflect baseline growth, mix effects, and variable interactions.
Segment Analysis
By Product Type: Gaming Drives Premium Growth
The standard office monitors sub-segment accounted for 47.65% of the global market, while gaming segment is projected to expand at a 13.58% CAGR, outpacing every other category within the computer monitor market. Gamers increasingly demand 240 Hz-plus refresh rates paired with adaptive-sync, propelling OEMs to prioritize response-time optimization and OLED burn-in mitigation. Commercial decision-makers, meanwhile, pivot toward ergonomic stands, integrated docks, and blue-light reduction, trading raw pixel density for user-wellness features. The computer monitor market size tied to gaming posts the widest gross-margin premium because enthusiast buyers accept frequent upgrades to stay competitive. Manufacturers leverage e-sports sponsorships to stimulate aspirational purchases in mainstream communities. Live-streaming adoption further reinforces the cycle, as content creators emulate professional setups. Commodity office units risk commoditization unless bundled with cloud-based management tools that simplify fleet monitoring. Over the forecast horizon, vertical integration between GPU makers and display vendors may accelerate feature adoption by aligning refresh-rate roadmaps with silicon capability.
Gaming innovations also spill into adjacent sectors, with CAD engineers and video editors specifying high-refresh panels to minimize cursor latency. Hospitals pilot curved ultrawide monitors in radiology suites to enhance anatomical visualization, borrowing lessons from immersive gaming layouts. As workloads transition to GPU-accelerated pipelines, monitor interconnects such as DisplayPort 2.1 and HDMI 2.1 gain relevance, cementing gaming technology as a bellwether for broader market evolution. The result is a virtuous loop in which research and development funded by entertainment usage ultimately benefits enterprise productivity and clinical outcomes.




By Panel Technology: OLED Revolution Accelerates
IPS continues to anchor 45.90% of 2025 shipments thanks to mature supply chains and balanced cost-performance ratios. Yet OLED and mini-LED shipments are climbing 17.85% annually, drawing premium buyers who prize infinite contrast and localized dimming. The computer monitor market size for OLED panels will likely double by 2027 as fabs achieve higher glass yields and drive down per-unit cost. Quantum-dot OLED marries wide-gamut color to high peak brightness, letting corporate graphic-arts departments justify capital expenditure through reduced proof errors. VA panels maintain a niche among gamers seeking deep blacks without OLED price tags, while TN rapidly recedes due to inferior viewing angles. The supply side tilts increasingly toward vertically integrated Korean and Chinese conglomerates that operate captive OLED fabs, constraining smaller assemblers to source panels at market rates.
Energy regulations reinforce the shift because OLED’s per-pixel driving scheme lowers average power draw during mixed content, easing compliance burdens. However, burn-in fears remain for static-content use cases such as trading dashboards. Manufacturers respond with pixel-shifting algorithms and extended warranty terms that assuage enterprise risk managers. Mini-LED backplanes, with thousands of zones, claim space in medical imaging where near-HDR grayscale gradation matters more than absolute black. Competitive dynamics hinge on securing long-term wafer allocations; firms lacking upstream leverage face rising panel costs as global capacity fills. Consequently, technological leadership will remain concentrated among a handful of panel makers holding >70% combined share, even as downstream brands proliferate.
By Screen Size: Larger Displays Gain Momentum
Models between 21 and 24 inches captured 41.62% of 2025 demand, but units ≥30 inches grow at a 11.92% CAGR as enterprises correlate larger canvases with multi-tasking efficiency. Margins widen because bigger screens command higher attachment rates for ergonomic arms and calibration services. The computer monitor market share for ultra-wide curved formats remains small yet lucrative, catering to immersive gamers and quantitative analysts tracking multi-asset feeds. Bulk purchasers in education shift from ≤20-inch to 24-inch because price delta has narrowed to single-digit percentages.
Portable 16-inch monitors stimulate a complementary demand curve by extending laptop screen real estate during travel. Vendors exploit cross-selling, offering bundle discounts that pair a primary 27-inch display with a foldable second screen. Meanwhile, home offices invest in 32-inch 4K units that double as streaming hubs outside working hours. Forthcoming 42-inch OLEDs blur the line between monitors and televisions, encouraging room-scale productivity setups. As screen sizes expand, pixel density must scale in lockstep to avoid perceptible aliasing, accelerating the move toward 5K and 6K resolutions in creative studios.
By Resolution: 4K Adoption Accelerates
Full HD still covers 53.70% of units thanks to cost-sensitive education and SMB buyers, but 4K panels clock a 15.62% CAGR, propelled by content-creation workflows that demand native UHD editing. The computer monitor market size tied to 4K models will exceed one-third of total revenue before 2031, underscoring a rapid shift in buyer expectations. Designers seek pixel-perfect zoom while coders appreciate denser text rendering, broadening appeal beyond video professionals. QHD maintains relevance as a gaming sweet spot when paired with ultra-high frame rates that GPUs can render without exorbitant cost. Legacy 1366 × 768 quickly exits corporate procurement catalogs, relegated to replacement markets only.
Adoption gains pace as GPU vendors bundle 4K-ready cards and as operating systems refine scaling algorithms that keep UI elements readable. HDMI 2.1 ubiquity eliminates bandwidth bottlenecks, letting 4K screens hit 144 Hz without chroma subsampling. Enterprises use 4K density to replace dual-monitor setups, citing energy and space savings in sustainability audits. Display makers integrate adaptive-sync at the factory, making 4K viable for casual gamers. Over time, 8K may remain confined to specialized niches such as medical imaging and digital cinema mastering until compression standards and interface speeds mature.
By Application: Gaming Segment Leads Growth
Consumer and office applications accounted for 48.65% revenue in 2025, a share expected to erode modestly as gaming posts a 12.76% CAGR. Professional and enterprise segments rely on monitors for mission-critical color and data integrity, preserving a steady demand baseline. Esports influences cross-segment design language, with RGB accents and aggressive curves migrating into mainstream SKUs. The computer monitor market size associated with professional color-accurate displays benefits from media-production growth on platforms demanding 4K HDR output. Hospitals and trading floors diversify the client mix, requiring 24/7 uptime and precise calibration that fetch premium service contracts.
Mobility also reshapes application splits as field engineers adopt rugged portable monitors, enabling dual-screen productivity on site. Software vendors embed telemetry into monitor firmware, supplying IT admins with health analytics that pre-empt downtime. Content creators favor 10-bit panels with factory DCI-P3 calibration, minimizing setup delays. Meanwhile, universities upgrade lecture halls with large-format interactive monitors that double as digital whiteboards. Each application’s distinct KPI latency for gaming, Delta-E for graphics, luminance uniformity for medical drives granular specification options, ensuring product-line breadth.
By Distribution Channel: Online Dominance Continues
Online outlets generated 56.05% of 2025 sales and should grow 13.74% annually as B2B portals mature. Direct-to-consumer storefronts let brands retain margin, personalize bundles, and harvest user telemetry for iterative design. Brick-and-mortar stores pivot to experiential zones where buyers test HDR brightness or curved-screen immersion before purchasing digitally. E-marketplaces build augmented-reality apps that visualize desk fit, reducing return rates.
Corporate procurement digitizes through API-linked platforms that auto-validate energy-efficiency certificates and warranty SLAs, simplifying bulk ordering. The computer monitor market size transacted via subscription models rises, with manufacturers offering hardware-as-a-service that swaps displays every three years for a fixed fee. Logistics partners invest in reinforced packaging to curb panel breakage, lowering warranty reserves. Point-of-sale financing further accelerates conversion for premium monitors, smoothing cash-flow for freelancers and small firms.
Geography Analysis
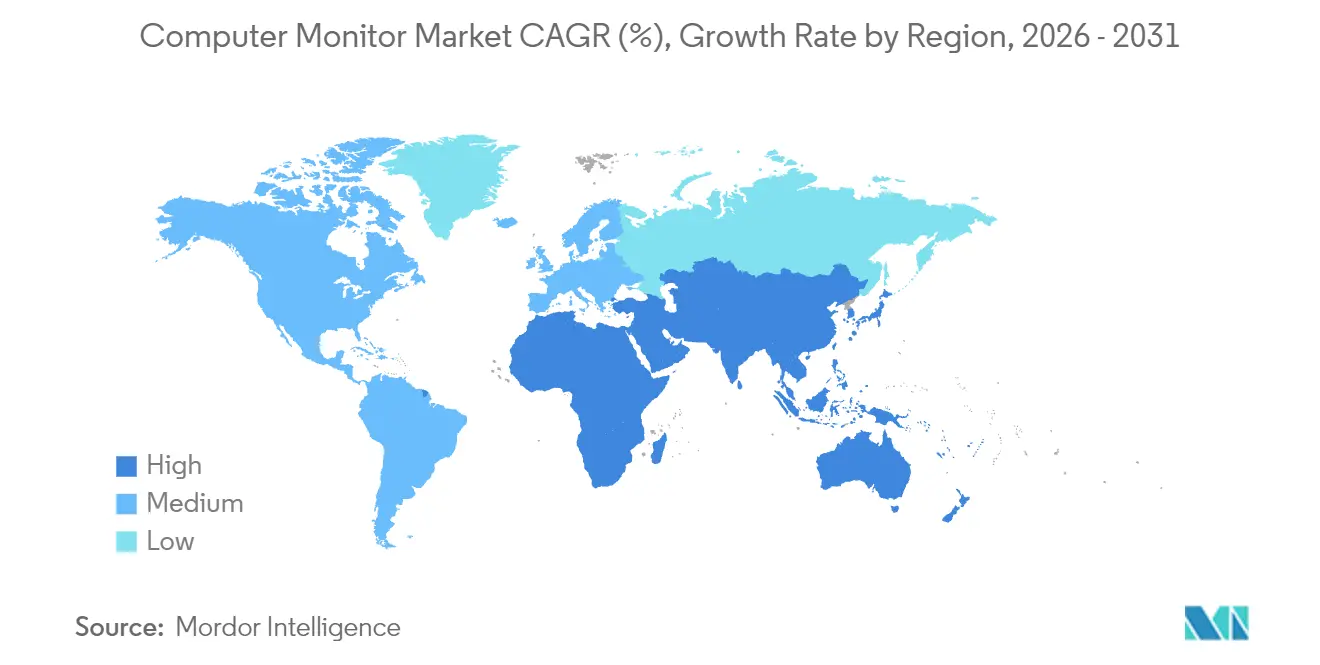
Asia Pacific retained a 39.10% share in 2025 and will record the fastest 10.95% CAGR as China, India, and Southeast Asia upgrade consumer electronics alongside rapid urbanization. Shipments in China reached 27 million units in 2024 despite macro-economic headwinds, supported by strong local brand loyalty and state incentives for domestic production. Manufacturing clusters in Taiwan and South Korea provide panel and PCB capacity, shortening lead times for regional assemblers. Government grants for semiconductor and display ventures attract capital that further entrenches regional leadership. Rising disposable incomes among middle-class households amplify gaming and streaming adoption, reinforcing demand for high-refresh models.
North America shows robust replacement demand driven by mandated hybrid-work policies that standardize dual 27-inch USB-C setups. High-refresh gaming monitors generated USD 500 million in 2022 and will hit USD 1.5 billion by 2030 as console and PC upgrades align. Enterprises emphasize sustainability, awarding contracts to vendors meeting Energy Star 8.0 targets. Distribution favors e-commerce giants that can fulfill fleet-wide rollouts within days, curbing downtime during hardware refreshes. Venture funding flows into peripheral ecosystems such as monitor arms and calibration software, signaling ancillary growth.
Europe balances strong premium uptake with stringent environmental policies. Regulation 2023/826 lowers standby power ceilings, forcing redesign of feature-rich gaming displays and reinforcing purchase preference for energy-efficient OLED or mini-LED models. Corporate procurement accords extended warranties and recyclability scores high weight, supporting circular-economy objectives. Although shipment volumes trail Asia, average selling prices exceed global norms due to sustainability and ergonomics add-ons. Supply chains remain vulnerable to logistics disruptions at key North Sea ports, prompting brands to build regional stock buffers.

Regulatory Landscape
Energy-efficiency and ecodesign rules are a primary compliance driver for computer monitors, particularly in Europe. The EU framework for electronic displays (notably Commission Regulation (EU) 2019/2021) is reinforced by Regulation (EU) 2023/826, which took effect on 9 May 2025 and tightens requirements for off-mode, standby, and networked-standby energy consumption. The regulation also sets stepped standby power ceilings (0.5 W in 2025 and 0.3 W by 2027), which affects feature-rich models that include always-on hubs, fast charging, and RGB lighting.
Labeling and market-access requirements further shape product configuration and channel documentation. EU energy labeling for electronic displays uses a mandatory A-G scale that incorporates screen area and HDR-related performance factors, influencing how vendors position high-brightness HDR SKUs. In Great Britain, the Ecodesign for Energy-Related Products and Energy Information (Amendment) Regulations 2026 updated the recognition approach for CE-marked products aligned to the EU sustainable product ecodesign framework, easing certain dual-marking burdens for qualifying products. On trade, the U.S. Customs and Border Protection tariff overview (February 2026) highlights that import classification and tariff structures remain a planning variable for monitor brands relying on cross-border panel and finished-goods flows.
Value Chain Analysis
The monitor value chain starts upstream with display panel manufacturing, including LCD, OLED, and mini-LED backlit architectures, concentrated in East Asia. This is supported by an integrated component ecosystem covering glass substrates, color filters, polarizers, LED backlight units, and display driver ICs (DDICs). Panel makers and their supply ecosystems, including BOE, CSOT, HKC, Samsung Display, LG Display, and AUO, shape cost, availability, and technology cadence. Controller and interface components, such as USB-C docking, DisplayPort/HDMI, and power-management ICs, also influence feature differentiation and compliance performance.
In the midstream, monitor brands and ODM/EMS partners handle mechanical design, firmware, calibration, and final assembly, then route products through distributors, e-commerce marketplaces, and enterprise procurement channels. After-sales service and warranty logistics act as a value lever for commercial fleets. Supply-side concentration has also been visible in large-generation LCD capacity shifts, including LG Display completing the transfer of its Guangzhou Gen 8.5 LCD plant to China Star Optoelectronics Technology (CSOT) in April 2025, which increased CSOTs share of global large-generation LCD capacity to 22.9%. Such capacity consolidation affects downstream panel sourcing options, pricing negotiations, and the ability of brands to secure allocations for fast-refresh and higher-resolution monitor SKUs.
Competitive Landscape
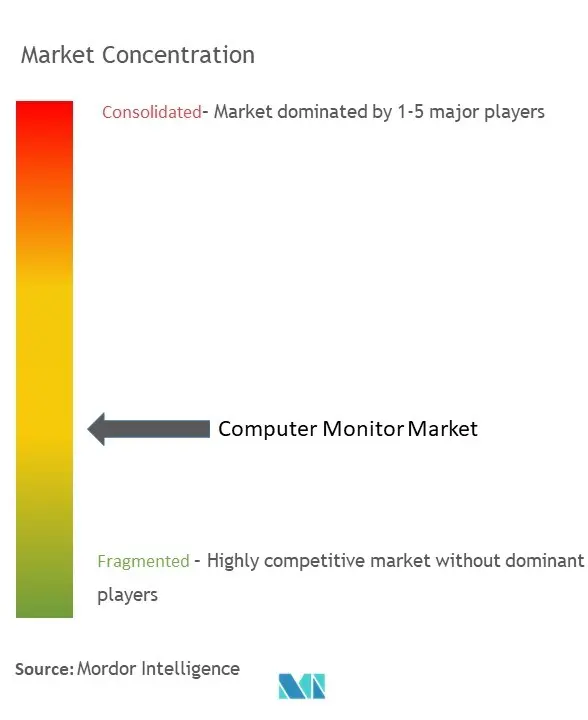
The computer monitor market features moderate fragmentation; the top five vendors control an estimated 62% of global revenue, leaving room for niche entrants to address specialized use-cases. Dell Technologies leverages USD 95.6 billion in FY 2025 revenue to bundle monitors with endpoint-management software, reinforcing stickiness in Fortune 500 accounts. HP Inc., with a USD 53.6 billion FY 2024 turnover, adds device-as-a-service plans that rotate displays every 36 months, smoothing enterprise cash flow. Samsung Display and LG Display dominate OLED and mini-LED panel supply; their downstream brands capture premium-segment margins by touting proprietary pixel-shift algorithms that mitigate burn-in risks.
Gaming-centric firms like ASUS Republic of Gamers and MSI differentiate through 480 Hz refresh-rate leadership and community engagement programs that cultivate brand evangelists. ViewSonic secures a 26.4% share in portable monitors by emphasizing macOS compatibility and factory color calibration. Component innovations such as DisplayPort 2.1 retimers and micro-LED backplanes drive patent races; firms lacking research and development heft enter licensing deals or risk obsolescence. M&A activity centers on software assets that add calibration, remote-management, or collaboration value, echoing a broader hardware-plus-services convergence.
Cost competition persists at lower tiers, where Chinese ODMs flood the channel with aggressively priced IPS models. Brand owners protect margin by stressing extended warranties and responsive after-sales support. Supply-chain resilience becomes a differentiator; multinationals dual-source panels from Korea and China to hedge geopolitical shocks. Sustainability credentials gain importance as ESG disclosure rules tighten; manufacturers publish lifecycle-carbon data and adopt recyclable packaging to win institutional buyers, reinforcing a non-price competitive dimension.
Computer Monitor Industry Leaders
-
Dell Technologies Inc.
-
HP Inc
-
Lenovo Group Limited
-
Samsung Group
-
Acer Inc
- *Disclaimer: Major Players sorted in no particular order

Market Opportunities and Future Outlook
A near-term whitespace is forming around premium IT panels and monitor designs that balance higher refresh rates and higher resolution with tighter power and sustainability constraints. Regulation (EU) 2023/826, effective 9 May 2025, pressures vendors to deliver feature-rich hubs and gaming-centric electronics within tighter standby limits. That creates room for differentiated power-management silicon, firmware-level power gating, and panel choices with lower average draw, notably OLED. Enterprise procurement practices reinforce this regulatory pull, with buyers increasingly weighting energy-efficiency certifications and lifecycle sustainability attributes when standardizing multi-monitor deployments.
Upstream investments in OLED capacity and larger-generation IT-oriented lines are widening the design space for monitor OEMs seeking stable supply of QD-OLED and other OLED variants. In June 2026, BOE began mass production of OLED panels on its Chengdu Gen 8.6 line, with total investment reported at 63 billion yuan. Samsung Display also announced an expansion of 6th-generation OLED capacity at its Asan campus A4 plant by about 15,000 substrates per month, while LG Display disclosed OLED-focused investment steps in 2026, including an April 2026 plan for a 1.1 trillion won investment at Paju to add a 6th-generation OLED line. Together, these moves support more monitor-grade OLED panel availability and encourage brands to broaden portfolios beyond IPS-heavy lineups, but they also increase the need for tighter calibration, warranty programs, and burn-in mitigation in professional and enterprise channels.
Recent Industry Developments
- June 2026: HP Inc. introduced AI-powered collaboration solutions at InfoComm 2026, including Poly Studio Room Compute and deeper integration of Poly Lens into the HP Workforce Experience Platform (WXP). HP strengthened its hardware-plus-software approach for managed meeting rooms and enterprise deployments, positioning monitors as part of an administered collaboration stack rather than a standalone peripheral.
- January 2026: Dell Technologies introduced new UltraSharp models at CES 2026, including the Dell UltraSharp 52 Thunderbolt Hub Monitor and the Dell UltraSharp 32 4K QD-OLED Monitor. Dell paired premium panels with high-bandwidth single-cable docking to support hybrid-work desk standardization and higher ASP configurations that combine display, connectivity, and peripheral management.
- January 2026: Acer unveiled new gaming and creator-focused monitors, including the Predator XB273U F6 gaming monitor positioned around ultra-high refresh performance, alongside additional Predator and Nitro gaming models and the ProDesigner PE320QX for creators. The mix underscores the market segmentation toward specialized use cases, with gaming refresh-rate leadership and creator calibration features helping defend margins against commoditized office monitor tiers.


Research Methodology Framework and Report Scope
Market Definition and Coverage
This market covers revenues generated from the sale of computer monitors used with desktops, laptops, and other computing devices in homes and workplaces, including professional and gaming use. Sizing is expressed in USD value and is built to track demand across major regions.
Scope exclusions: TVs, mobile device displays, and embedded screens sold as part of complete devices are excluded (for example, laptop panels and all-in-one PC screens).
Segmentation Overview
-
By Product Type
- Standard Office Monitors
- Gaming Monitors
- Professional/Color-Accurate Monitors
- Curved and Ultrawide Monitors
-
By Panel Technology
- IPS
- VA
- TN
- OLED / mini-LED
-
By Screen Size (Inches)
- ≤20''
- 21''–24''
- 25''–29''
- ≥30''
-
By Resolution
- 1366×768
- 1920×1080 (FHD)
- 2560×1440 (QHD)
- 3840×2160 (4K)
- Other Resolutions
-
By Application
- Consumer and Commercial
- Gaming
- Professional and Enterprise
-
By Distribution Channel
- Online
- Offline (Specialty and Mass-Retail)
-
By Geography
-
North America
- United States
- Canada
- Mexico
-
South America
- Brazil
- Argentina
- Rest of South America
-
Europe
- Germany
- United Kingdom
- France
- Italy
- Spain
- Russia
- Rest of Europe
-
Asia Pacific
- China
- Japan
- India
- South Korea
- Australia and New Zealand
- Rest of Asia Pacific
-
Middle East and Africa
-
Middle East
- United Arab Emirates
- Saudi Arabia
- Rest of Middle East
-
Africa
- South Africa
- Nigeria
- Rest of Africa
-
Middle East
-
North America
Data Sources, Market Sizing, and Validation
Desk Research
Desk research starts by mapping the computer monitor ecosystem and the measurable signals that can be checked year over year. For trade and macro inputs, we use public sources such as US Census trade statistics, UN Comtrade import and export data, International Telecommunication Union (ITU) ICT indicators, OECD macro and household spending series, and energy efficiency and labeling programs published by regulators.
To convert those signals into model inputs, we also rely on company annual reports, SEC filings, investor presentations, reputable press coverage, and trade association updates. Where needed, paid subscription data for company financials and news intelligence helps cross-check revenue mix statements and major shipment shifts. We also review patent database records to gauge technology direction, such as panel feature changes and connectivity updates. The sources listed here are illustrative, and additional public references were used for data collection, validation, and clarification.
Primary Interviews and Surveys
Primary interviews are used to stress-test assumptions that are not directly observable in public data, especially pricing movement, channel mix, and how gaming and commercial refresh cycles change demand. We speak with monitor brands, component and assembly participants, distributors and retailers, and large buyers across APAC, EMEA, and the Americas so the model reflects how demand and ASPs behave across regions.
Distribution of primary research fieldwork respondents
| Company type | Respondent position | Region |
|---|---|---|
| Top tier: 31% | CXOs: 14% | APAC: 38% |
| Mid tier: 53% | Functional/Unit leaders: 38% | EMEA: 36% |
| Smaller Players: 16% | Managers: 48% | Americas: 26% |
Market-Sizing & Forecasting
Sizing is built by reconstructing the demand pool from region-level unit indicators and product mix, and then translating it into value using monitored price points, following a top-down approach to keep geography totals consistent. These results are also cross-checked with selective bottom-up approximations, such as sampling representative monitor ASPs by resolution and screen size and validating implied revenues against publicly discussed business lines and channel checks.
Key inputs for this market include office and home monitor replacement cycles, the gaming monitor mix within total shipments, and screen size and resolution shifts (for example, FHD to QHD and 4K). We also track panel technology adoption patterns, such as IPS share changes, and the online versus offline channel weight that affects realized pricing. When data is missing for smaller countries, we bridge gaps using proxy indicators such as PC installed base direction, income bands, and import intensity, and then revisit the split using primary feedback.
For forecasting, we use scenario analysis supported by simple multivariate regression, where variables such as PC refresh timing, price erosion trends, and regional macro indicators are tested together. Assumptions are kept explicit so that if pricing or refresh behavior changes, the model can be updated without rebuilding it from scratch.
Data Validation & Update Cycle
Model outputs are checked against independent signals, including trade flows, reported category momentum from large channels, and the implied unit and price mix derived from expert feedback. If a country or segment shows a sharp jump, the drivers are rechecked to determine whether it reflects real demand, a one-time stocking effect, or a pricing artifact.
Before sign-off, the full workbook goes through multi-step analyst review to ensure formulas, currency conversions, and growth paths are internally consistent. Reports are refreshed annually, and interim updates are completed when major events materially change monitor demand or pricing. Right before delivery, a final update pass is run so clients receive the latest view available at that point.
Mordor Intelligence's Computer Monitor Market Size Measured Against Other Published Estimates
Published market values for computer monitors often differ because each publisher sets its own product boundary and timing, then builds forecasts with different price and mix assumptions. The spread can also be driven by whether the estimate is anchored on unit demand signals or broader display spending.
Key gaps usually come from what is counted as a monitor, for example whether portable monitors, signage style displays, or bundled screens are included, how online pricing and promotions are reflected in ASPs, and which year is used as the starting point for the growth curve. Some sources project faster premium mix expansion into gaming and professional use, while others keep the mix more stable and produce lower or higher totals depending on the price path and currency conversion timing.
Benchmark comparison
| Source | Market Size | Gaps in Research Methodology |
|---|---|---|
| Mordor Intelligence | USD 49.62 B (2026) | |
| Global Consultancy A | USD 58.08 B (2024) | Uses an earlier base year and a broader technology list, and the higher total can reflect adjacent display uses and a different ASP curve that is not clearly tied back to unit and mix checks. |
| Regional Consultancy B | USD 38.63 B (2024) | Leans on a narrower product interpretation and longer-dated historical anchors, which can suppress the value estimate when premium gaming and higher-resolution mix shifts are treated conservatively. |
The table shows that the biggest differences come from the year chosen for the headline number and from how far the product scope stretches beyond traditional PC monitors. By tying value to resolution and size mix, channel pricing behavior, and refresh-cycle reality, the market total stays traceable to repeatable inputs, a modeling choice applied by Mordor Intelligence.


Key Questions Answered in the Report
How large is the computer monitor market in 2026?
The computer monitor market size is USD 49.62 billion in 2026, with a forecast CAGR of 5.30%.
Which product category is growing fastest?
Gaming monitors lead growth at 13.58% CAGR as e-sports and streaming expand display-performance requirements.
What technology shift is most significant?
OLED and mini-LED panels are advancing 17.85% annually, rapidly eroding IPS dominance within premium tiers.
Why is Asia Pacific so important?
Asia Pacific holds 39.10% share and posts the highest 10.95% CAGR thanks to large consumer bases and integrated manufacturing hubs.
How are EU regulations affecting vendors?
Regulation 2023/826 forces standby power below 0.5 W, driving redesigns of high-spec models and favoring energy-efficient technologies.
Which sales channel dominates today?
Online platforms account for 56.05% of 2025 revenue and are growing 13.74% annually as B2B procurement moves to digital portals.
Page last updated on:


 Your data is secure and never sold or shared.


