
Financial Analytics Market Size and Share
Market Overview
| Study Period | 2020 - 2031 |
|---|---|
| Market Size (2026) | USD 13.87 Billion |
| Market Size (2031) | USD 23.42 Billion |
| Growth Rate (2026 - 2031) | 11.05 % |
| Fastest Growing Market | Asia Pacific |
| Largest Market | North America |
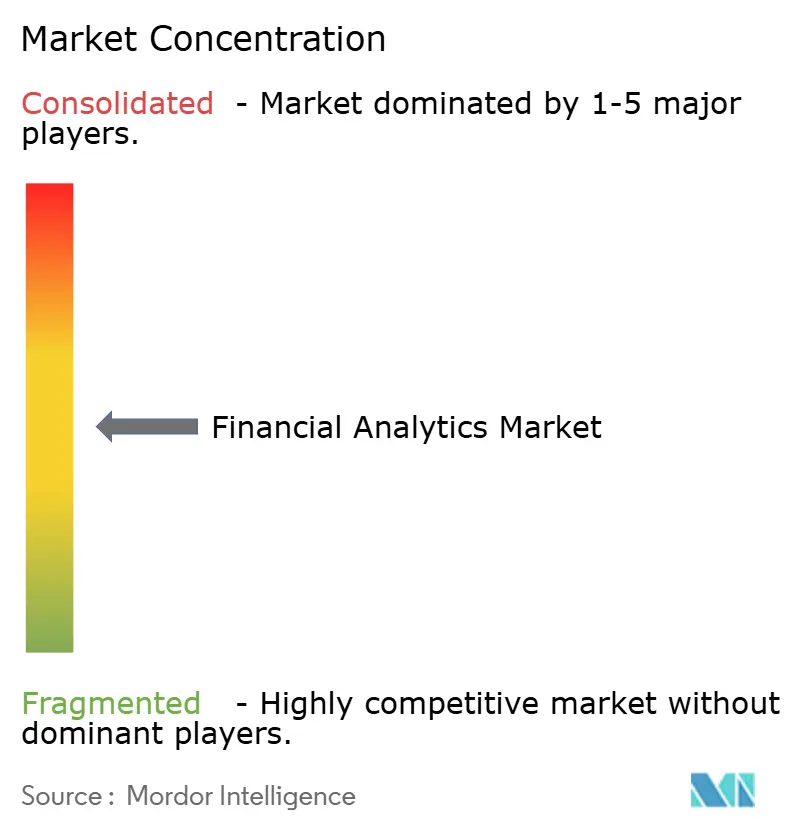
| Market Concentration | Medium |
Major Players *Disclaimer: Major Players sorted in no particular order Image © Mordor Intelligence. Reuse requires attribution under CC BY 4.0. | |
Financial Analytics Market Analysis by Mordor Intelligence
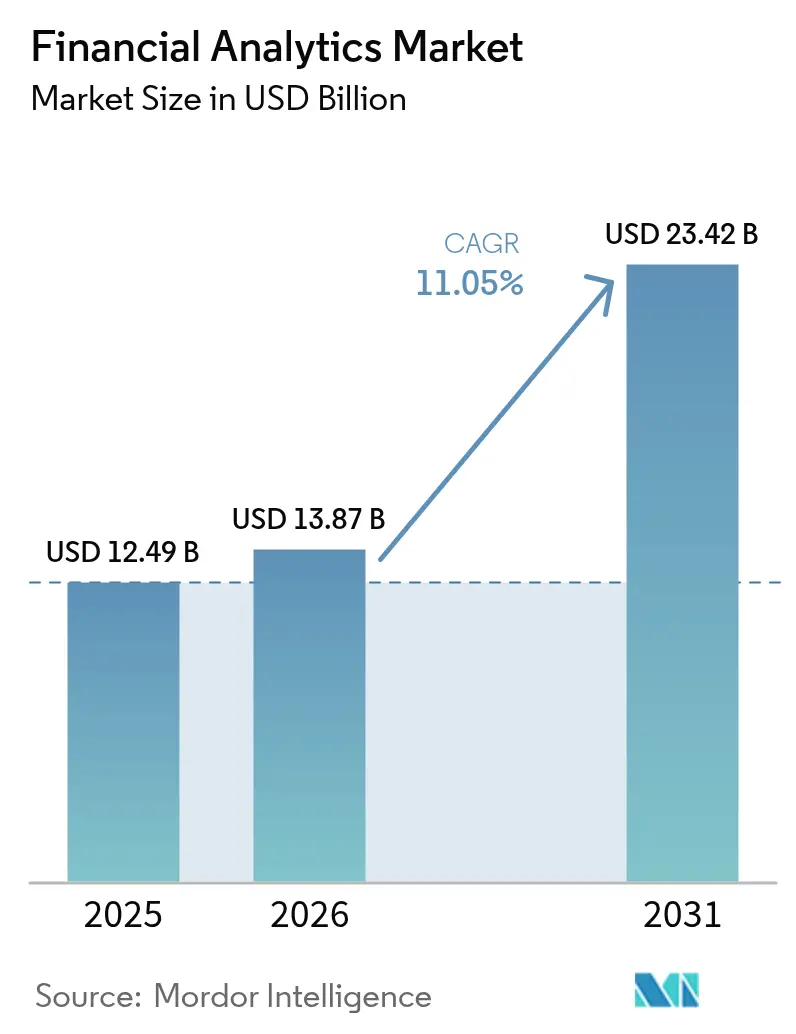
The financial analytics market size was valued at USD 12.49 billion in 2025 and estimated to grow from USD 13.87 billion in 2026 to reach USD 23.42 billion by 2031, at a CAGR of 11.05% during the forecast period (2026-2031). Rapid cloud‐native core conversions, real-time risk mandates, and AI-enabled decision systems are pushing adoption across banking, insurance, and corporate finance teams. North American institutions continue to optimize mature data estates, while Asia-Pacific banks leap from legacy systems to cloud stacks that deliver nanosecond transaction insights. On-premise deployments remain prevalent among risk-averse tier-1 banks, yet accelerating cloud migrations are reshaping vendor strategies as CIOs align capital outlays with operational pay-as-you-go models. Intensifying cyber resiliency requirements, multimillion-dollar breach exposures, and a shortage of data scientists are restraining the pace, but heavy investment in embedded AI is lowering the total cost of ownership and opening the financial analytics market to small and midsize enterprises.
Key Report Takeaways
- By deployment mode, on-premise solutions held 60.65% of the financial analytics market share in 2025, while cloud deployment is expanding at 13.04% CAGR to 2031.
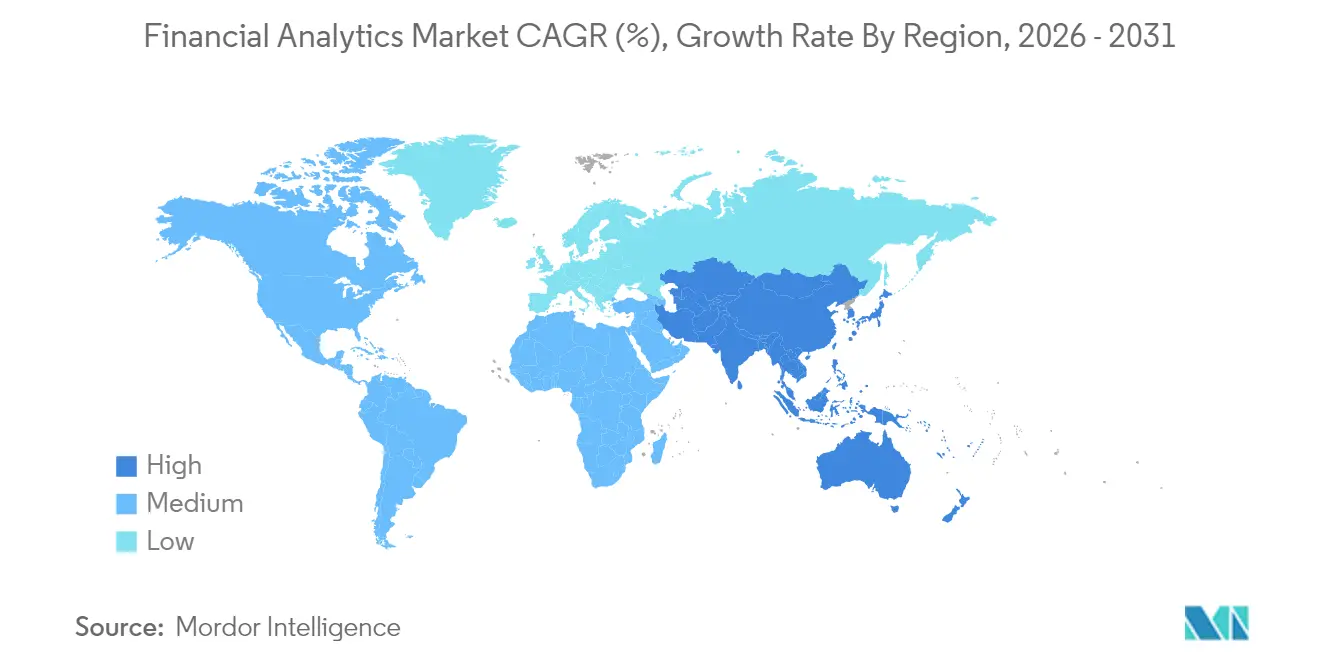
- By geography, North America accounted for 38.45% revenue share of the financial analytics market in 2025; Asia-Pacific is projected to register the fastest 12.32% CAGR through 2031.
- By solution type, analysis and reporting led with 33.12% share in 2025, whereas financial consolidation is poised to grow at 12.46% CAGR to 2031.
- By application, risk management captured 27.15% of the financial analytics market size in 2025 and fraud detection is advancing at an 11.45% CAGR to 2031.
- By analytics type, descriptive analytics retained the dominant position with 42.55% share in 2025; prescriptive analytics is set to climb at 12.55% CAGR over the forecast horizon.
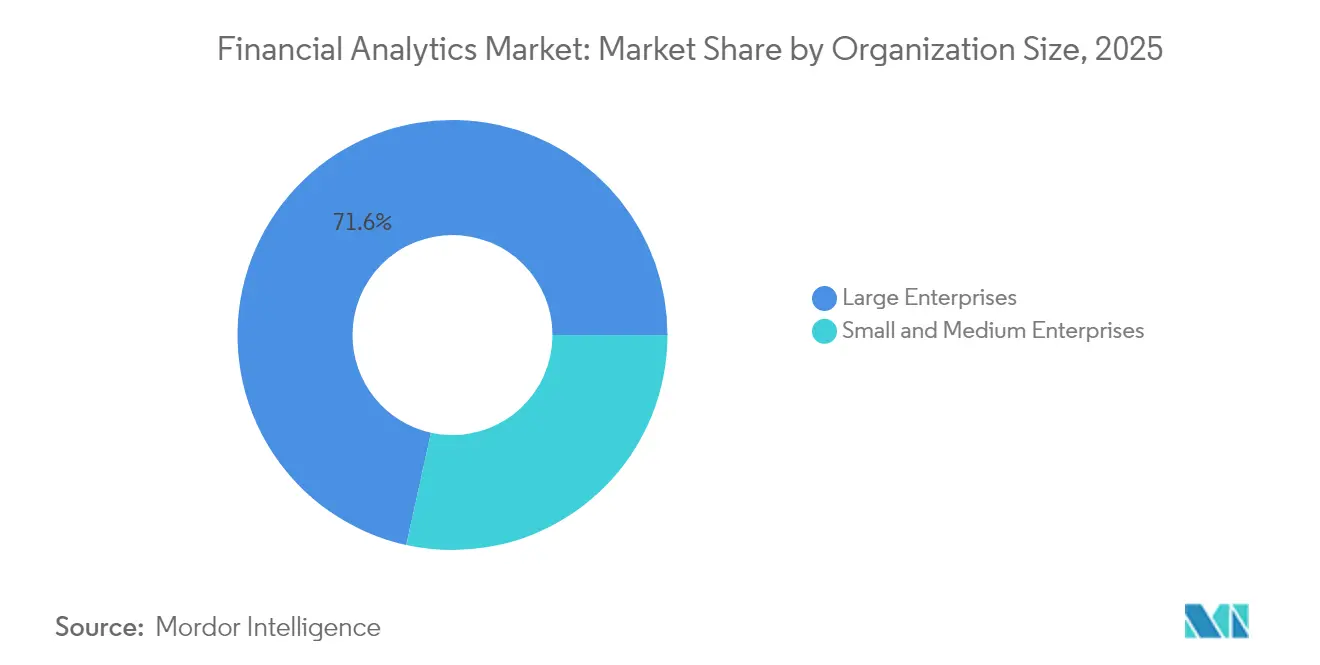
- By organization size, large enterprises controlled 71.55% share in 2025, yet the SME segment is projected to rise at 12.82% CAGR to 2031.
- By end-user industry, BFSI contributed 33.05% of 2025 revenues while healthcare is forecast to expand at 11.71% CAGR and emerge as the fastest-growing vertical.
Note: Market size and forecast figures in this report are generated using Mordor Intelligence’s proprietary estimation framework, updated with the latest available data and insights as of 2026.
Market Trends and Insights
Drivers Impact Analysis of Financial Analytics Market*
| Driver | (~) % Impact on CAGR Forecast | Geographic Relevance | Impact Timeline |
|---|---|---|---|
| Explosion in cloud-first core-banking modernizations | +2.1% | Global – North America and Asia-Pacific lead | Medium term (2-4 years) |
| AI/ML embedded in finance suites lowers TCO | +1.8% | Global, concentrated in developed markets | Short term (≤ 2 years) |
| Regulatory push for real-time risk and capital reporting | +1.5% | North America and EU, expanding to Asia-Pacific | Long term (≥ 4 years) |
| Surge in data-driven financial planning and analysis across SMBs | +1.3% | Global with strong growth in emerging markets | Medium term (2-4 years) |
| ESG-score-linked debt issuance analytics | +0.9% | EU leads, North America follows, Asia-Pacific emerging | Long term (≥ 4 years) |
| Quantum-ready Monte-Carlo engines for VAR | +0.6% | Tier-1 financial institutions worldwide | Long term (≥ 4 years) |
| Source: Mordor Intelligence | |||
Explosion in Cloud-First Core-Banking Modernizations
Financial institutions that migrate from monolithic cores to cloud-native architectures record 45% jumps in operational efficiency and up to 40% cost savings within the first year[1]. The shift frees budgets historically consumed by maintenance and enables microservices that stream data into analytics engines in real time. North American tier-1 banks are executing hybrid moves, while mid-tier lenders in India and Indonesia leap directly to public cloud cores. Vendor roadmaps now center on containerized analytics modules that scale elastically with intraday transaction volumes. Regulators acknowledge the resilience benefit because cloud grids allow faster disaster recovery and near-zero downtime. This momentum greatly enlarges addressable demand in the financial analytics market.
AI/ML Embedded in Finance Suites Lowers TCO
Embedding AI engines inside treasury, lending, and portfolio tools removes the need for separate data science stacks. Institutions deploying AI-infused platforms save an average of USD 1.9 million annually through automated reconciliations, hyper-accurate cash forecasts, and fewer false-positive alerts. Modern suites come pre-configured with predictive models that pull data from ERP and CRM pipes, shrinking implementation cycles for regional banks lacking deep analytics talent. Applications such as AI-guided working capital optimization reduce forecast errors by 50%, unlocking liquidity that can be redeployed into revenue-generating products. The resulting lower total cost of ownership accelerates penetration of the financial analytics market into cost-sensitive segments.
Regulatory Push for Real-Time Risk and Capital Reporting
Supervisors now expect intraday exposure dashboards instead of overnight batch files. The United States Federal Reserve’s Risk Officer Survey highlighted a surge in ACH and instant-payment fraud, prompting updated guidance on continuous monitoring. The European Banking Authority similarly mandates granular reporting for climate stress tests. Institutions that cannot demonstrate on-demand calculations face capital surcharges and reputational penalties. Real-time value-at-risk engines, powered by in-memory analytics, therefore move from discretionary to compulsory spend. Vendors respond with regulatory-ready modules that ingest feeds from market data providers and generate capital adequacy metrics within seconds.
Surge in Data-Driven Financial Planning and Analysis Across SMBs
Cloud subscriptions make advanced planning tools accessible to businesses with fewer than 500 employees. Alternative lenders harness behavioral analytics to underwrite loans in minutes, attracting 73% of small firms that demand faster financing than traditional banks offer. AI-based cashflow dashboards help shop owners predict liquidity gaps and negotiate better supplier terms. Lower price points and templated deployments cut onboarding time from months to days. As emerging markets digitize bookkeeping, vendors deliver localized modules that comply with regional tax rules. The SMB wave broadens the customer base of the financial analytics market beyond the historical domain of large enterprises.
Restraints Impact Analysis of Financial Analytics Market*
| Restraint | (~) % Impact on CAGR Forecast | Geographic Relevance | Impact Timeline |
|---|---|---|---|
| Escalating cyber-breach liabilities | -1.4% | Global, highest in North America and EU | Short term (≤ 2 years) |
| Shortage of advanced analytics talent | -1.1% | Global, acute in Asia-Pacific and emerging markets | Medium term (2-4 years) |
| Rising cloud egress fees and vendor lock-in | -0.8% | Global, affecting multi-cloud strategies | Medium term (2-4 years) |
| Algorithmic bias compliance investigations | -0.5% | North America and EU lead, expanding globally | Long term (≥ 4 years) |
| Source: Mordor Intelligence | |||
Escalating Cyber-Breach Liabilities
Banks average USD 6.08 million in loss per breach, nearly 25% above cross-sector norms[2]. Attack dwell time often exceeds five months, amplifying theft of credentials and customer records. The 2024 ransomware strike on a leading U.S. health insurer showed how a single breach can trigger USD 22 million in payouts. Boards now divert capital from analytics upgrades to security hardening, slowing refresh cycles. Cyber insurance premiums also rise by double digits, squeezing IT budgets further. Vendors must therefore embed zero-trust controls inside analytics platforms to assuage buyer concerns and sustain growth in the financial analytics market.
Shortage of Advanced Analytics Talent
Vacancies for data engineers and model validators remain open for a median of 10 months in financial hubs. The Financial Services Skills Commission reports 71% of member firms launching reskilling programs to fill machine-learning roles. Asia-Pacific banks face steeper hurdles because regional universities graduate fewer specialized candidates. To cope, vendors offer auto-ML toolkits with visual model builders that reduce code lines by 80%. While these accelerators democratize basic modeling, complex risk scenarios still require seasoned quants, limiting how fast institutions can climb from descriptive to prescriptive analytics maturity.
*Our forecasts treat driver/restraint impacts as directional, not additive. The impact forecasts reflect baseline growth, mix effects, and variable interactions.
Financial Analytics Market Segment Analysis
By Deployment Mode:
Cloud Acceleration Despite On-Premise DominanceOn-premise setups retained 60.65% of the financial analytics market share in 2025, underscoring the sector’s cautious stance on data residency and latency control. However, public and private cloud deployments are advancing at 13.04% CAGR and will narrow the gap as regulators formalize shared-responsibility frameworks. Institutions weigh staged migrations beginning with non-core applications, such as budgeting sandboxes, before moving real-time risk engines. The financial analytics market size attributed to cloud platforms is forecast to climb markedly as vendors build sovereign cloud regions to satisfy local compliance. Banks also adopt container orchestration that allows workloads to swing between on-premise and cloud nodes based on cost or latency. Although data-egress fees and vendor lock-in fears linger, multicloud connectivity tools and portable licensing help alleviate these restraints and propel broader cloud adoption.
Once workloads shift, operating models change. Site-reliability engineers replace hardware teams, and consumption pricing aligns IT spend with transaction volumes. Smaller lenders exploit the pay-as-you-go model to access machine-learning libraries previously limited to global banks. Cloud platforms integrate threat analytics that monitor network traffic across tenants, strengthening cyber resilience. Scalable compute further enables Monte Carlo simulations for portfolio risk without large fixed investments. The resulting agility places added pressure on incumbents still anchored to mainframes, encouraging an accelerated reallocation of budgets toward cloud-based financial analytics market solutions.


By Solution Type:
Consolidation Drives Financial IntegrationAnalysis and reporting suites led the 2025 landscape with 33.12% revenue share as finance teams demanded unified dashboards for faster close cycles. Financial consolidation suites exhibit 12.46% CAGR because multi-entity corporations require single-version-of-truth ledgers to meet complex IFRS and GAAP obligations. These modules automate currency translation and intercompany eliminations, reducing manual journal entries by 70%. Vendors embed AI that flags anomalous variances during group close and recommends corrective actions, shaving days off reporting timelines. The financial analytics market size associated with consolidation is projected to expand significantly as regulators intensify disclosure demands for climate and tax transparency.
Database management and planning tools form the substrate on which analytical engines run, while risk and compliance modules integrate scenario modeling with regulatory taxonomy. ESG-score analytics and quantum-ready derivatives platforms occupy the emerging “other solutions” niche. As corporations seek end-to-end financial transformation, vendors bundle adjacent capabilities such as account reconciliation and disclosure management into larger platforms. The convergence trend fuels mergers and acquisitions as providers race to offer full-stack coverage, amplifying competition within the financial analytics market.
By Application:
Risk Management Leads amid Fraud Detection SurgeRisk management held 27.15% of the financial analytics market size in 2025 due to Basel and Solvency mandates that require continuous capital monitoring. Value-at-risk engines run tens of thousands of price paths each night, relying on in-memory grids to deliver compliance reports before markets open. Fraud detection applications, expanding at 11.45% CAGR, tap deep-learning models trained on billions of card and payment records. The latest systems identify deepfake voices and synthetic IDs with 97% accuracy, closing loopholes exploited in recent USD 25 million scams. Institutions also overlay social-network graphs that trace mule accounts in real time, cutting downstream loss recovery costs.
As real-time payments proliferate, the distinction between fraud prevention and risk analytics blurs. Banks deploy unified platforms that score transactions for counterparty risk and AML breaches simultaneously. Budgeting and forecasting modules gain traction among corporates seeking rolling forecasts that update daily based on order flows. Treasury teams adopt AI-guided liquidity analytics that recommend optimal funding mixes across currencies. The breadth of application scenarios emphasizes the expansive scope of the financial analytics market and its role in enterprise decision architectures.
By Analytics Type:
Prescriptive Analytics Gains MomentumDescriptive analytics retained a 42.55% share in 2025 because statutory reporting and audit trails require backward-looking precision. However, prescriptive analytics is registering a 12.55% CAGR as institutions pivot toward action-oriented insights. Reinforcement learning models now optimize hedging strategies by continuously adjusting based on market moves. Early adopters record a 60 basis-point uplift in portfolio returns compared with static rule sets. The financial analytics market share commanded by diagnostic and predictive layers remains significant, acting as feeders that cleanse and contextualize data before prescriptive engines generate recommendations.
Quantum research laboratories within global banks experiment with quantum Monte Carlo to accelerate exotic option pricing. While commercial deployment is years away, proofs of concept demonstrate 40x speedups versus classical counterparts. Vendors arm platforms with quantum-safe cryptography modules to future-proof data pipelines. This ongoing innovation ensures the financial analytics market evolves beyond incremental dashboarding into a realm of automated, algorithmically derived decisions.
By Organization Size:
SME Adoption AcceleratesLarge enterprises accounted for 71.55% of 2025 revenues because multinational banks, insurers, and corporates run complex consolidation, risk, and compliance workloads. Nevertheless, SMEs are growing at a 12.82% CAGR as subscription pricing and plug-and-play APIs remove entry barriers. Regional fintech lenders embed analytics directly into loan origination workflows, offering instant credit decisions to micro merchants. Cloud starter kits bundle bookkeeping integrations and AI chatbots that surface receivables anomalies, slashing days-sales-outstanding by double digits. These capabilities expand the total reachable base of the financial analytics market and foster competition among vendors targeting fast-moving startups.
SMEs in Southeast Asia and Latin America adopt mobile-first dashboards, reflecting the high smartphone penetration. Vendors localize tax codes, language packs, and compliance rules to accelerate uptake. Training packages delivered through online academies bridge capability gaps. As SMEs mature, they demand more advanced forecasting and scenario analysis, providing a runway for upsell from entry-level dashboards to full-stack suites.
By End-User Industry:
Healthcare Emerges as Growth DriverBFSI retained a 33.05% share in 2025 because core banking, insurance, actuarial, and capital-markets operations depend on granular analytics. Healthcare, posting 11.71% CAGR, adopts financial analytics to rein in revenue-cycle leakage and comply with evolving reimbursement codes. AI algorithms flag claim-denial patterns and recommend pre-emptive corrections, boosting collection rates for hospitals. Pharmaceutical manufacturers apply predictive analytics to optimize trial budgets and forecast cash flow spikes tied to milestone payments. The diversification underscores the horizontal relevance of the financial analytics market.
Government treasuries deploy risk dashboards to monitor public-sector borrowing and manage contingent liabilities. Retail and e-commerce players integrate payment analytics to detect fraud across omnichannel checkouts. Manufacturing firms use scenario simulations to hedge commodity exposure. Each vertical brings distinct data structures, spurring vendors to ship industry accelerators that shorten time to value.
Geography Analysis
North America Financial Analytics Market
North America led with 38.45% revenue share in 2025 as well-capitalized banks invested early in AI cores, cloud resilience, and integrated compliance workbenches. U.S. regulators provide clear guidance on model risk management, allowing institutions to experiment within well-defined guardrails. Canadian banks pioneer open-banking APIs that stream enriched transaction data into third-party analytics layers. Capital markets firms in New York and Toronto deploy low-latency grids that price derivatives in microseconds. The presence of hyperscale cloud regions reduces data-sovereignty friction, sustaining dominance of the financial analytics market across the region.
APAC Financial Analytics Market
Asia-Pacific is expected to post a 12.32% CAGR through 2031 on the back of aggressive digitization, supportive policy, and expanding middle-class demand for financial services. China’s megabanks commit multi-billion-dollar cloud budgets, while India’s public-sector banks join account-aggregator networks that unleash new data sets for credit scoring. Japan’s financial giants explore quantum computing consortiums to mitigate interest-rate volatility. Southeast Asian fintechs unlock credit access for the unbanked, pushing real-time analytics workloads to the edge. Regional AI spend is forecast to hit USD 110 billion by 2028, reinforcing long-term momentum.
EMEA and South America Financial Analytics Market
Europe maintains a sizeable footprint with advanced ESG reporting norms and sophisticated wholesale markets. French banks integrate carbon accounting into credit models, while German insurers deploy actuarial engines that factor climate risk. The EU Data Act elevates privacy compliance, prompting wider adoption of privacy-preserving analytics such as secure enclaves. Meanwhile, quantum readiness gains traction after the European Central Bank explored post-quantum cryptography to safeguard payment rails. South America, and Middle East, and Africa contribute smaller shares today but register double-digit growth as mobile money, digital ID, and open banking initiatives mature.
Regulatory Landscape
Financial analytics deployments are increasingly shaped by requirements for machine-readable, interoperable regulatory data and tighter governance of automated decisioning. In the United States, regulators finalized joint data standards under the Financial Data Transparency Act (FDTA) of 2022 in June 2026, with the joint final rule taking effect on October 1, 2026. This pushes banks, broker-dealers, and other regulated entities to align internal data models, metadata, and reporting pipelines to common standards.
In Europe, the Commission updated the Single Electronic Reporting Format (ESEF) taxonomy via an applied delegated regulation dated April 7, 2026, affecting financial years beginning on or after January 1, 2026. The change reinforces structured digital filing practices that feed into consolidation, disclosure management, and audit-trail features in financial analytics suites. Alongside these reporting-format shifts, supervisory expectations for real-time risk and capital reporting, including those referenced by the U.S. Federal Reserve and the European Banking Authority in the report context, increase the need for data lineage, model governance, and continuous monitoring controls within analytics platforms.
Value Chain Analysis
The financial analytics value chain begins with data generation and sourcing across ledgers and subledgers (ERP, core banking, payments), third-party market and reference data, identity and fraud signals, and risk and credit data. It then moves into ingestion and integration (connectors, APIs, streaming), storage and compute (cloud data platforms, in-memory grids), and analytics and decision layers (reporting, consolidation, risk and compliance, fraud models, and AI copilots).
Delivery and commercialization typically run through enterprise software channels (ERP and finance suite vendors), hyperscaler marketplaces, system integrators, and managed service providers that implement controls for auditability, security, and regulatory reporting. Ecosystem convergence is visible where analytics is embedded inside operational finance workflows instead of being treated as a separate layer. For example, in July 2025, J.P. Morgan Payments announced a supply chain finance solution natively integrated with Oracle Fusion Cloud ERP and cited usage by FedEx, illustrating how banking products, ERP workflows, and analytics-driven working-capital decisioning are distributed together. Adjacent partnerships, such as ThroughPut and Aankhen (July 2025) around SKU-level tariff management decision acceleration, show how external risk and cost shocks are pulled into finance analytics inputs, increasing the value of prebuilt data models and packaged integrations across procurement, logistics, and treasury teams.
Competitive Landscape
The financial analytics market features a moderately fragmented structure where technology giants, niche specialists, and AI-native start-ups compete for wallet share. IBM, Microsoft, Oracle, and SAP anchor the top tier with end-to-end platforms that combine data warehousing, visualization, and embedded AI. Oracle’s cloud services climbed to 32% of company revenue in fiscal 2024, signalling a decisive shift toward subscription delivery models[5]. SAP leverages its ERP footprint to cross-sell analytics extensions into treasury and consolidation modules. IBM strengthens its consulting arm through targeted acquisitions such as Hakkoda, enhancing Snowflake, and multi-cloud implementation depth.
Specialists focus on high-growth niches. FICO reinforces fraud analytics leadership with behavior-based transaction scoring, driving 30% annual recurring revenue growth for the FICO Platform. Palantir partners with Fannie Mae on AI-driven mortgage fraud surveillance that combs through billions of structured and unstructured records. New entrants build AI co-pilots that auto-generate board packs, while quantum start-ups prototype accelerated Monte Carlo engines for derivatives desks. Venture capital funds back solutions that layer vertical-specific ML models on cloud data warehouses, putting pressure on incumbents to innovate quickly.
Strategic themes include vertical integration, open ecosystem playbooks, and joint innovation labs with tier-1 banks. Vendors embed generative AI to automate narrative commentary that explains numbers in plain language. Platform roadmaps prioritize low-code interfaces, data lineage traceability, and federated learning to facilitate cross-border collaborations. Competitive intensity is expected to rise as cloud hyperscalers bundle native financial data services, potentially capturing a larger slice of the financial analytics market by 2030.
Financial Analytics Industry Leaders
-
IBM Corporation
-
Microsoft Corporation
-
Oracle Corporation
-
SAP SE
-
SAS Institute
- *Disclaimer: Major Players sorted in no particular order
Financial Analytics Market Companies Covered in this Report
- FICO
- Hitachi Vantara
- SAS Institute
- IBM Corporation
- Microsoft Corporation
- Oracle Corporation
- SAP SE
- Teradata Corporation
- Salesforce (Tableau)
- Qlik Tech
- TIBCO Software
- Alteryx
- ThoughtSpot
- Domo
- MicroStrategy
- Sisense
- Anaplan
- Workday Adaptive Planning
- Moody's Analytics
- SandP Global Market Intelligence
- BlackLine
- Infor
- Wolters Kluwer
- Datarails
Market Opportunities and Future Outlook
Mandated data standardization and digital reporting formats create whitespace for vendors that can provide regulatory-ready, machine-readable reporting, mapping, and lineage capabilities that reduce manual reconciliation across risk, capital, and disclosure workflows. The FDTA joint data standards finalized by U.S. regulators in June 2026 (effective October 1, 2026) and the EU update to ESEF taxonomy applied on April 7, 2026 for financial years beginning on or after January 1, 2026, point to concrete demand for taxonomy management, data quality controls, and automated report generation embedded in finance suites and risk platforms.
Platform investment is also concentrating around AI-enabled finance operations and enterprise data foundations, which expands opportunity for embedded AI analytics, automated close and consolidation, and cross-domain decisioning that connects finance, risk, and operational datasets. In June 2026, Permira and Warburg Pincus completed Clearwater Analytics' USD 8.4 billion take-private acquisition, framed around accelerating product and AI roadmap execution. In July 2026, SAP completed the acquisition of Dremio to unify SAP and non-SAP data for agentic AI, and it completed Reltio in May 2026 to strengthen master data management for its Business Data Cloud. Taken together, these moves reflect buyer preference for data plumbing, including integration, master data, and governance, that makes prescriptive and agentic finance analytics deployable at scale, including for SMEs using subscription-based tools and organizations prioritizing cyber-resilient, auditable deployments.
Recent Industry Developments in Financial Analytics Market
- July 2026: SAP completed its acquisition of Dremio, adding data lakehouse and query capabilities intended to unify SAP and non-SAP data for agentic AI use cases. The deal strengthens SAPs ability to deliver finance analytics that span heterogeneous enterprise estates, improving access to governed datasets needed for consolidation, reporting, and risk analytics workflows.
- May 2026: SAP completed the acquisition of Reltio to enhance master data management capabilities within SAP Business Data Cloud. Bringing MDM closer to analytics and AI layers supports higher-quality entity, customer, and product hierarchies, which are critical inputs for accurate financial consolidation, compliance reporting, and fraud and risk models.
- April 2026: Oracle introduced Fusion Agentic Applications for finance and supply chain, adding new agentic capabilities within Oracle Fusion Cloud ERP and SCM. Packaging coordinated AI agents inside core finance workflows accelerates automation of planning, reconciliation, and decision support, reinforcing the shift toward embedded analytics rather than standalone reporting tools.
Financial Analytics Market Report Scope and Research Methodology
Market Definition and Coverage
For this methodology, the financial analytics market is defined as enterprise spending on software and cloud tools that turn finance data into dashboards, forecasts, and alerts used for planning, treasury, and compliance work.
Scope exclusions: We exclude personal finance apps, generic business intelligence tools without finance-specific workflows, and hardware-only data warehouse products.
Segments Covered in This Report
- By Deployment Mode
- On-premise
- Cloud
- By Solution Type
- Database Management and Planning
- Analysis and Reporting
- Financial Consolidation
- Risk and Compliance
- Other Solutions
- By Application
- Risk Management
- Budgeting and Forecasting
- Revenue Management
- Fraud Detection
- Cash-flow and Treasury Analytics
- Compliance and Reporting
- Wealth and Portfolio Analytics
- By Analytics Type
- Descriptive Analytics
- Diagnostic Analytics
- Predictive Analytics
- Prescriptive Analytics
- By Organisation Size
- Large Enterprises
- Small and Medium Enterprises
- By End-user Industry
- BFSI
- Healthcare
- Manufacturing
- Government
- IT and Telecom
- Retail and eCommerce
- Others
- By Geography
- North America
- United States
- Canada
- Mexico
- Europe
- Germany
- United Kingdom
- France
- Italy
- Spain
- Russia
- Rest of Europe
- Asia-Pacific
- China
- Japan
- India
- South Korea
- ASEAN
- Australia and New Zealand
- Rest of Asia-Pacific
- South America
- Brazil
- Argentina
- Rest of South America
- Middle East and Africa
- Middle East
- Saudi Arabia
- UAE
- Turkey
- Rest of Middle East
- Africa
- South Africa
- Nigeria
- Rest of Africa
- Middle East
- North America
Data Sources, Market Sizing, and Validation
Desk Research
Desk research was used to build the starting structure of the model and keep assumptions realistic across regions and industries. We referenced public sources such as the US SEC filings database for revenue disclosures, US Bureau of Economic Analysis data for macro context, World Bank indicators for cross-country normalization, and OECD digital economy publications for adoption signals.
To translate market demand into measurable inputs, we also reviewed sources such as ISO and NIST publications for governance language, peer-reviewed journals for analytics adoption patterns, and reputable company reports like 10-Ks, annual reports, and investor decks for product positioning and customer mix. A paid subscription for company financials and another for patent databases were used to check vendor exposure and innovation intensity where public disclosure was thin. These are illustrative examples only, and many other sources were also consulted to collect data, validate assumptions, and clarify gaps during the study.
Primary Interviews and Surveys
Primary interviews and surveys were used to sanity-check scope boundaries and to test key assumptions that are difficult to infer from public material, including typical pricing motions and how finance teams deploy analytics in production. Interviews included a mix of software providers, system integrators, and enterprise finance users across major regions, so adoption levels, upgrade cycles, and budget priorities could be compared and then fed back into the model.
Distribution of primary research fieldwork respondents
| Company type | Respondent position | Region |
|---|---|---|
| Top tier: 31% | CXOs: 17% | APAC: 44% |
| Mid tier: 47% | Functional/Unit leaders: 26% | EMEA: 30% |
| Smaller Players: 22% | Managers: 57% | Americas: 26% |
Market-Sizing & Forecasting
Sizing starts with a top-down build where enterprise software and analytics spend is reconstructed into a finance-specific demand pool using adoption and use-case penetration, and then allocated by region based on observable enterprise digitization signals. Once that frame is set, selective bottom-up approximations are used to corroborate totals, mainly through sampled vendor revenue exposure to financial analytics, channel checks with implementers, and typical price-per-user or price-per-workload ranges multiplied by reasonable usage volumes.
In the model, a few practical inputs do most of the work, including enterprise IT and software spending trends, finance function digitization and automation levels, cloud migration pace for analytics workloads, compliance and reporting intensity in regulated industries, and upgrade or replacement cycles for analytics platforms. When gaps show up in a region or vertical, the missing pieces are handled through proxy indicators and then adjusted after expert feedback, rather than forcing an artificial full vendor roll-up.
For forecasting, scenario analysis is used with a main case that is anchored to budget growth expectations and cloud adoption curves, followed by conservative and aggressive cases that flex pricing progression and rollout speed. Assumptions on adoption and average contract values are reviewed with practitioners, and the final forecast is the one that stays consistent with the most repeatable signals available year over year.
Data Validation & Update Cycle
Outputs are checked in several steps so obvious mistakes do not flow into the final market value. We compare the model against independent signals such as enterprise software spending direction, cloud analytics growth, and reported exposure of relevant product lines, and then investigate large variances before sign-off.
If an assumption moves the market size more than expected, respondents are re-contacted and the input is revisited. We then run a separate analyst review to confirm the change is applied consistently across regions. Reports are refreshed annually, and interim updates are made when material events occur that can shift pricing, adoption, or buying cycles. Before delivery, a final pass is completed so clients receive the latest updated view.
Mordor Intelligence's Financial Analytics Market Size Compared Against Other Published Estimates
Published market sizes for financial analytics can look far apart even when the topic sounds the same, and this usually comes down to what is counted and how the time series is built. Differences in what gets included as financial analytics, the year used as the current benchmark, and the way pricing is converted to USD can each move the headline number.
The key drivers in this market tend to be scope overlaps with broader analytics stacks, whether services and implementation work are counted alongside software, and how cloud subscriptions are annualized when contracts have ramp-up periods. Some estimates also lean on aggressive growth cases without clearly linking assumptions to observable demand signals like finance team digitization and compliance-driven reporting needs, which then creates a higher forward value.
Benchmark comparison
| Source | Market Size | Gaps in Research Methodology |
|---|---|---|
| Mordor Intelligence | USD 13.87 B (2026) | |
| Industry Publisher A | USD 10.70 B (2025) | Uses an earlier current-year anchor, and scope disclosure is limited on whether implementation services and broader analytics tooling are separated from finance-specific workflows. |
| Industry Publisher B | USD 13.70 B (2025) | Covers a wider mix of database and integration tool categories, which can lift totals when general data platforms are counted as financial analytics without a clear finance-use condition. |
The table shows that the spread is largely explained by the chosen anchor year and what adjacent analytics categories are allowed into the total, and in Mordor Intelligence's model the market is limited to enterprise tools with finance logic used for planning, treasury, and compliance rather than generic BI or hardware-only stacks. With that boundary in place, the remaining work is careful normalization of pricing and adoption assumptions so the number can be traced back to clear inputs and repeated on the next update.
Key Questions Answered in the Report
What is the current size of the financial analytics market and its growth outlook?
The market stands at USD 13.87 billion in 2026 and is projected to reach USD 23.42 billion by 2031, growing at an 11.05% CAGR.
Which deployment mode is expanding the fastest?
Cloud deployment is advancing at a 13.04% CAGR, even though on-premise still holds 60.65% share.
Which geographic region offers the strongest growth potential?
Asia-Pacific is forecast to register the quickest 12.32% CAGR through 2031, driven by aggressive digital-banking adoption.
What application area is growing most rapidly?
Fraud detection leads with an 11.45% CAGR as institutions combat increasingly sophisticated financial crime.
How significant are cyber-security costs to market growth?
Breach expenses average USD 6.08 million per incident for financial firms, trimming market CAGR by an estimated 1.4%.
Why are SMEs becoming important customers for financial analytics vendors?
Cloud-based, AI-enabled platforms lower entry barriers, supporting a 12.82% CAGR for SME adoption as smaller firms pursue data-driven planning.