Market Overview
| Study Period | 2020 - 2031 |
|---|---|
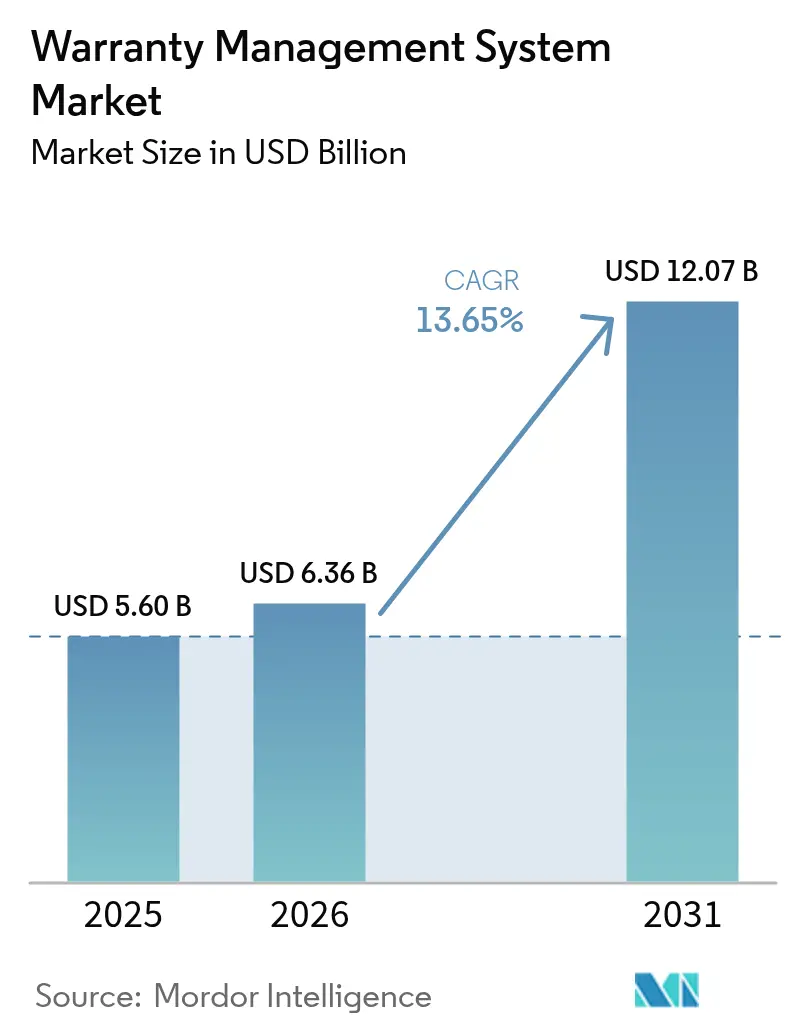
| Market Size (2026) | USD 6.36 Billion |
| Market Size (2031) | USD 12.07 Billion |
| Growth Rate (2026 - 2031) | 13.65% CAGR |
| Fastest Growing Market | Asia Pacific |
| Largest Market | North America |
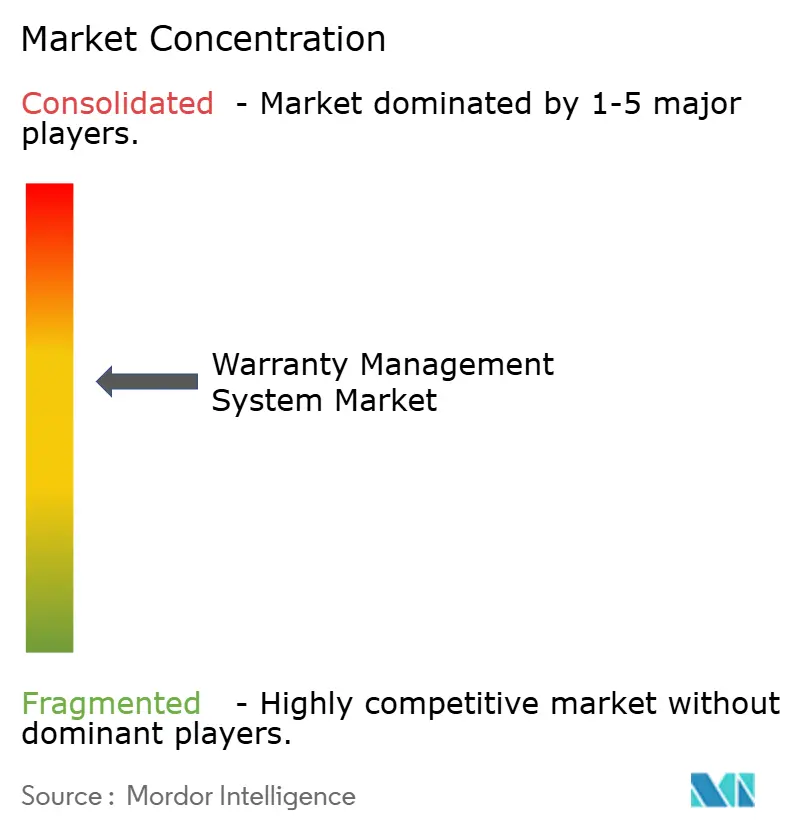
| Market Concentration | Medium |
Major Players
*Disclaimer: Major Players sorted in no particular order Image © Mordor Intelligence. Reuse requires attribution under CC BY 4.0. |
|
Warranty Management System Market Analysis by Mordor Intelligence
The warranty management system market size is expected to grow from USD 5.60 billion in 2025 to USD 6.36 billion in 2026 and is forecast to reach USD 12.07 billion by 2031 at 13.65% CAGR over 2026-2031. Surging investments in AI-driven claims automation, Right-to-Repair compliance, and data-centric quality programs position the warranty management system market for sustained double-digit growth. Cloud migration among Tier-2 manufacturers, predictive analytics that shrink average claim cycles from weeks to hours, and blockchain pilots that deter fraud all reinforce the market’s near-term momentum. Manufacturers now treat warranty data as a profit lever, extracting insights that cut recall costs and boost customer loyalty. Meanwhile, outsourcing to managed-service specialists further accelerates adoption as organizations refocus internal talent on core engineering tasks.
Key Report Takeaways
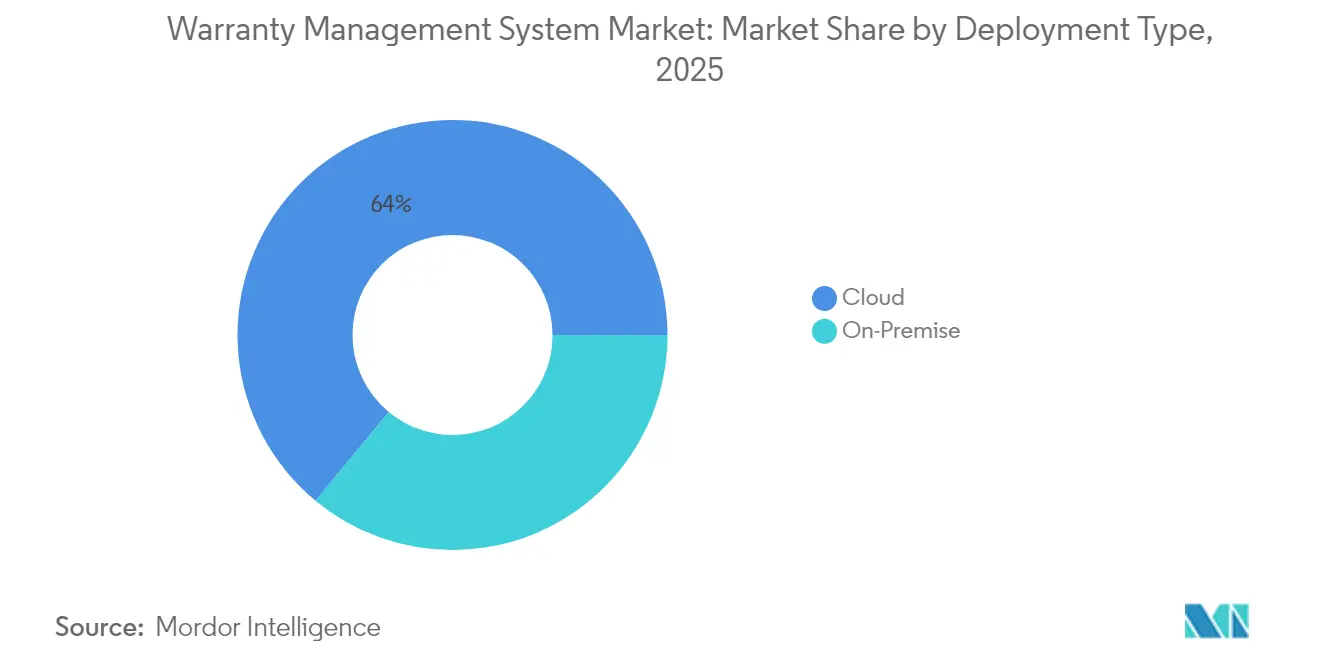
- By deployment type, cloud solutions led with 64.00% of the warranty management system market share in 2025; the managed-services component is projected to expand at a 15.95% CAGR through 2031.
- By software type, claim-management platforms held 37.75% of the warranty management system market size in 2025, whereas warranty intelligence and analytics are advancing at a 15.05% CAGR.
- By component, solutions accounted for 68.85% of the warranty management system market size in 2025, while managed services represent the fastest-growing segment at 15.95% CAGR.
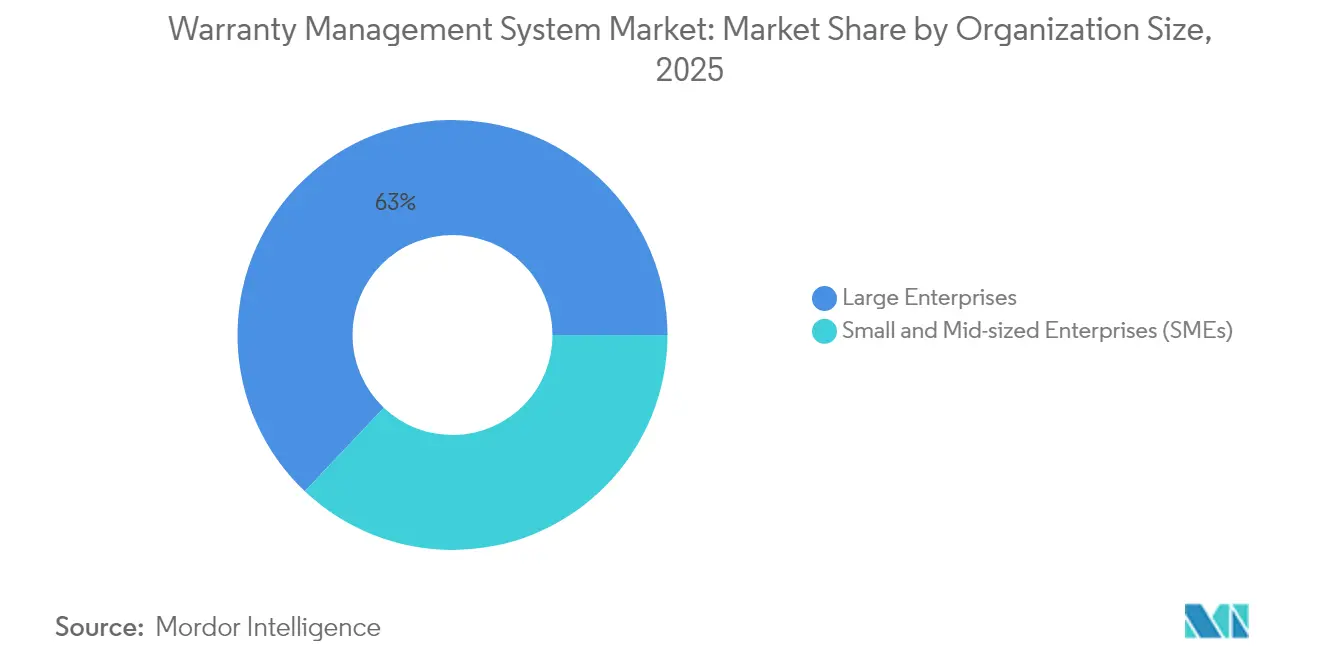
- By organisation size, large enterprises controlled 62.95% of the warranty management system market share in 2025; SMEs are registering the quickest uptake at a 14.45% CAGR.
- By end-user industry, automotive and transportation captured 31.75% of the warranty management system market size in 2025, whereas medical devices are forecast to rise at a 15.62% CAGR.
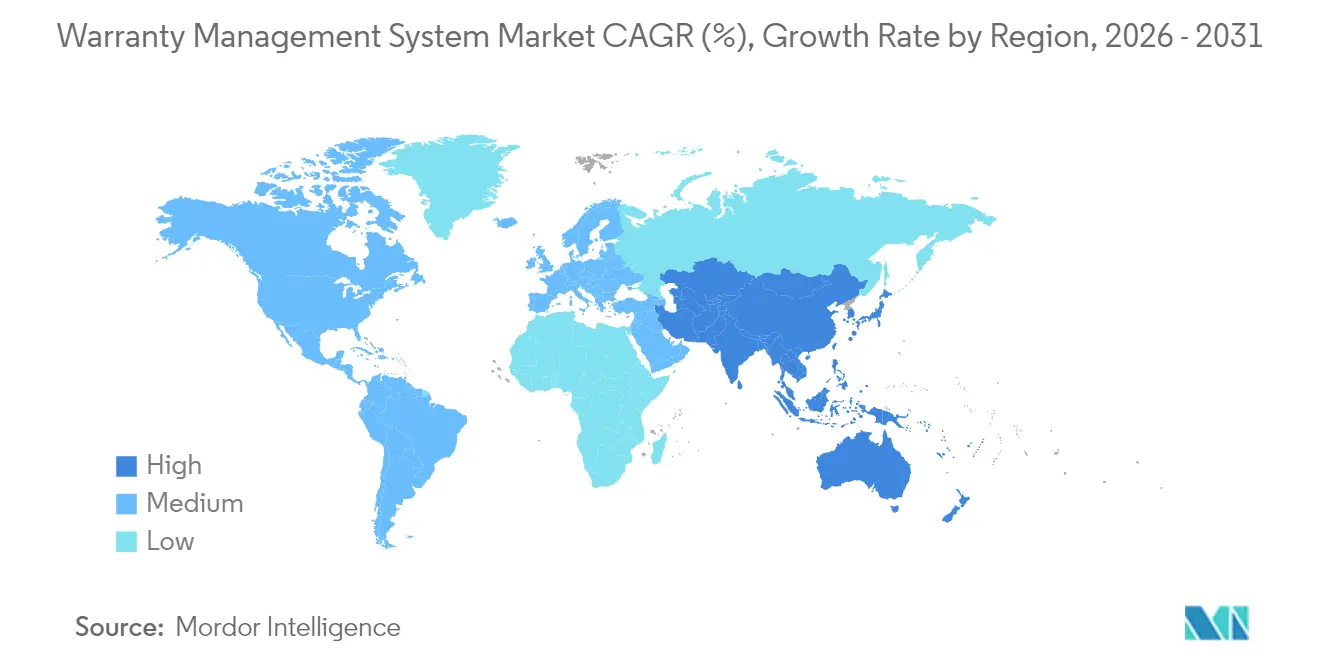
- By geography, North America maintained 34.45% of 2025 revenue, and Asia-Pacific exhibits the highest regional CAGR at 14.08% through 2031.
Note: Market size and forecast figures in this report are generated using Mordor Intelligence’s proprietary estimation framework, updated with the latest available data and insights as of 2026.
Global Warranty Management System Market Trends and Insights
Drivers Impact Analysis*
| Driver | (~) % Impact on CAGR Forecast | Geographic Relevance | Impact Timeline |
|---|---|---|---|
| Digital-first warranty claims platforms | +2.1% | North America, EU | Medium term (2-4 years) |
| AI-enabled predictive warranty analytics | +2.8% | Asia-Pacific manufacturing hubs | Short term (≤ 2 years) |
| Shift to cloud/SaaS deployment | +2.3% | Asia-Pacific, Latin America | Medium term (2-4 years) |
| Growing Right-to-Repair transparency | +1.9% | North America, EU | Long term (≥ 4 years) |
| Adoption of blockchain records | +1.2% | Aerospace, automotive global | Long term (≥ 4 years) |
| Monetisation of warranty data via finance | +1.4% | North America, EU | Medium term (2-4 years) |
| Source: Mordor Intelligence | |||
Digital-first warranty claims platforms accelerate OEM–dealer collaboration
Automakers and white-goods producers are rolling out portal-based claim workflows that allow dealers to file, validate, and track warranty requests in near real time. Average approval time now falls below 24 hours, down from 7 days in 2023, driving tangible savings in dealer rental-car reimbursements. These portals integrate repair-procedure libraries and labour-time guides, curbing disputes and boosting first-time-fix rates. Suppliers also gain visibility into early failure trends, enabling quicker containment actions. Together, these capabilities give manufacturers a clearer picture of field quality, improve customer satisfaction scores, and support brand-level Net Promoter Score targets. [1]Warranty Week, “U.S. Medical & Scientific Equipment Warranties,” warrantyweek.com
AI-enabled predictive warranty analytics slash cost-per-claim
Machine-learning models ingest structured sensor data and unstructured repair notes to capture subtle failure signatures before they proliferate. Leading OEMs report 5–10% reductions in warranty accruals by dispatching field service bulletins up to six months earlier than prior practice. Natural-language processing highlights recurring customer complaints, helping engineering teams redesign components and renegotiate supplier terms. Fraud detection modules cross-check claim patterns, flagging anomalies such as repeated part numbers from a single dealer. Organizations that embed analytics into warranty provisioning matrices have trimmed reserves by as much as 25% while raising mean-time-between-failure metrics.
Shift to cloud/SaaS deployment among Tier-2 manufacturers
Cloud subscription models remove traditional capital hurdles and shorten implementation times from 12 months to under 90 days. Tier-2 automotive stamping plants and consumer-electronic assemblers now access enterprise-grade rules engines without operating in-house data centers. Real-time APIs connect suppliers, dealers, and logistics partners, collapsing siloed workflows and enhancing supply-chain transparency. While public-cloud instances dominate, hybrid architectures gain favor in regulated verticals that must lock Personally Identifiable Information within national borders. Vendors counter security concerns with ISO 27001 certification, encryption-at-rest, and zero-trust access frameworks.[2]XB Software. "How Cloud Technology Can Benefit Manufacturing Companies in 2022." xbsoftware.com
Growing regulatory focus on Right-to-Repair transparency
The EU’s Directive 2024/1799 obliges manufacturers to extend warranties by an additional year when products are repaired within the original term, forcing back-end systems to track multiple coverage windows. Parallel statutes in New York, California, Oregon, and Colorado require OEMs to provide diagnostic software and parts to independent repairers. Compliance reshapes warranty data fields, claim adjudication logic, and dealer reimbursement tables. Early adopters see upside by marketing extended-repair programs and selling certified parts catalogs to third-party repairers. Those lagging face fines and reputational damage as transparency becomes an explicit consumer purchasing criterion.
Restraints Impact Analysis*
| Restraint | (~) % Impact on CAGR Forecast | Geographic Relevance | Impact Timeline |
|---|---|---|---|
| Price-sensitive competition from low-cost providers | -1.8% | APAC, Latin America | Short term (≤ 2 years) |
| Data-security and IP-protection concerns | -1.5% | Regulated industries worldwide | Medium term (2-4 years) |
| Shortage of domain-skilled data scientists | -1.2% | Emerging markets | Long term (≥ 4 years) |
| Fragmented legacy IT landscapes | -1.7% | Established markets with MandA histories | Medium term (2-4 years) |
| Source: Mordor Intelligence | |||
Data-security and IP-protection concerns in cloud environments
Confidential product failure data carries proprietary insights, and CIOs hesitate to shift such information into multitenant clouds. Recent breach disclosures pushed cyber-insurance premiums up by double digits, adding cost pressure. Aerospace and medical-device OEMs must also meet export-control and patient-privacy statutes, necessitating in-country hosting and encryption-key segregation. Warranty vendors respond by offering data-residency options and granular role-based access. Nevertheless, legal and audit teams often prolong procurement cycles, tempering the warranty management system market’s near-term install base expansion.[3]American Machinist, “How Manufacturers Can Effectively and Securely Manage Data,” americanmachinist.com
*Our forecasts treat driver/restraint impacts as directional, not additive. The impact forecasts reflect baseline growth, mix effects, and variable interactions.
Segment Analysis
By Deployment Type: Cloud Dominance Accelerates
Cloud deployments captured 64.00% of the warranty management system market share in 2025, and the segment is on track for a 13.85% CAGR through 2031. The warranty management system market size for cloud solutions is forecast to rise sharply as SaaS platforms pair rapid onboarding with operating-expense pricing that aligns budgets to shipment volumes. Tier-2 manufacturers and greenfield plants favor public-cloud options, while heavily regulated sectors deploy private or hybrid instances to satisfy data-sovereignty rules.
Manufacturers adopting cloud services gain integrated analytics, automated dealer portals, and elastic compute for seasonal claim spikes. Early adopters report claim-handling productivity gains exceeding 20%. Conversely, on-premise systems persist in defense and medical environments that restrict external connectivity, but even these organizations are piloting cloud bursts for non-PII data scenarios. Vendors now offer containerized warranty modules deployable on Kubernetes, easing gradual migrations without big-bang cutovers.


By Software Type: Intelligence Platforms Gain Momentum
Claim-management suites held 37.75% of the warranty management system market size in 2025, underpinning core intake, adjudication, and settlement workflows. However, warranty intelligence and analytics engines demonstrate the highest growth at 15.05% CAGR as manufacturers tap predictive models to pre-empt field failures. Reporting dashboards translate raw claim feeds into component-level Pareto charts that drive engineering change notices.
Analytics-first platforms also enhance supplier-recovery negotiations by quantifying fault attribution with statistical rigour. As a result, OEMs capture higher reimbursement percentages, directly bolstering gross margins. In parallel, service-contract administration modules blend extended-warranty sales with embedded-finance offers, opening fresh revenue streams. The convergence of intelligence, contract, and parts-recovery capabilities positions integrated platforms as foundational pillars in enterprise digital-thread initiatives.
By Component: Services Transformation Accelerates
Solution licenses contributed 68.85% of 2025 revenue, anchored by established vendors such as SAP, Oracle, and IBM that embed warranty functionality inside broader ERP suites. Nonetheless, managed services are scaling at a 15.95% CAGR, signalling a shift from software ownership to outcome-based partnerships. Outsourcing providers assume end-to-end claim processing, parts adjudication, and supplier charge-back negotiation, charging per-claim fees that mirror operational savings.
Professional services engagements remain vital, particularly for data cleansing and integration projects preceding system handover. Mid-market firms lacking IT manpower gravitate toward fully managed offerings with guaranteed Service-Level Agreements that cap claim-cycle durations. Vendors bolster value by layering AI bots that auto-classify claim types and propose settlement amounts, further reducing manual touchpoints.
By Organization Size: SME Adoption Accelerates
Large enterprises commanded 62.95% of the warranty management system market share in 2025, leveraging global platforms to synchronize warranty policies across multiple brands. However, the warranty management system market size generated by SMEs is expanding faster at 14.45% CAGR, due to subscription-priced SaaS modules that scale with shipment volumes.
SMEs report reduced administrative overhead by standardizing return-material-authorization rules and automating dealer reimbursements. They also benefit from pay-as-you-go analytics that would be cost-prohibitive to build internally. Vendors court this cohort with templated best-practice workflows and fast-track onboarding packs that go live in under four weeks, often bundled through regional channel partners.
By End-user Industry: Medical Devices Lead Growth
Automotive and transportation generated 31.75% of 2025 revenue, reflecting complex multi-tier supply chains and stringent recall liabilities. Extended power-train warranties and electrification programs keep demand robust. Yet medical devices exhibit the fastest trajectory at 15.62% CAGR as regulators intensify post-market surveillance requirements. Hospitals mandate device uptime guarantees, making real-time warranty dashboards essential for service-level compliance.
Industrial equipment and consumer durables each maintain a steady share, with connected-product telematics feeding proactive maintenance schedules that reduce field failures. Construction-equipment makers capitalize on warranty analytics to refine heavy-duty component design, while aerospace OEMs trial blockchain-verified part histories to discourage counterfeit installations. The breadth of vertical use cases confirms that warranty competence now operates as a strategic differentiator across manufacturing.
Geography Analysis
North America retained 34.45% of 2025 revenue, supported by mature automotive ecosystems, deep enterprise-software penetration, and the early uptake of AI-driven warranty portals. Several US states enacted laws mandating OEM reimbursement at retail labour rates, compelling platform upgrades that can calculate dealer-specific time guides instantly. Vendors headquartered in the region, including Oracle and IBM, cross-sell warranty analytics to installed ERP bases, reinforcing incumbency advantages.
Asia-Pacific represents the fastest-growing territory at 14.08% CAGR as Chinese and Indian manufacturers embed digital warranty modules directly into greenfield smart-factory blueprints. Regional governments incentivize cloud adoption through tax credits and cyber-security frameworks, accelerating SaaS deployments. Local assemblers leverage mobile-first dealer apps to service fragmented rural markets, while export-oriented plants adopt global warranty codes to satisfy foreign compliance audits.
Europe sustains solid growth underpinned by Directive 2024/1799, which obliges OEMs to track extended repair eligibility and disclose repairability scores at point of sale. Western European white-goods brands integrate warranty claims with circular-economy portals that list certified refurbishment centers. Meanwhile, Central European automotive clusters invest in predictive analytics as electric-vehicle thermal-management systems introduce new failure modes. Collectively, these dynamics reinforce steady demand across the continent.

Regulatory Landscape
Warranty management system requirements are being shaped by consumer-protection and repairability rules that demand clearer warranty disclosures and more traceable coverage logic. In the United States, the Magnuson-Moss Warranty Act disclosure requirements and associated FTC rules (16 CFR Part 701, 2025 compilation) reinforce the need for standardized, single-document warranty terms and defined claim procedures, pushing manufacturers and administrators to maintain auditable records and consistent customer communications across channels.
In Europe, warranty platforms are adapting to multiple, overlapping obligations tied to repairs and goods with digital elements. Directive (EU) 2019/771 raises the bar for tracking conformity obligations, including handling required security and software updates, while the Empowering Consumers for the Green Transition package (Directive (EU) 2024/825) introduces harmonized information requirements on statutory warranties and commercial guarantees of durability, with national transposition due by 27 March 2026 and application from 27 September 2026. For system vendors and enterprise users, this elevates demand for configurable policy engines (multi-country notices and labels), extended coverage window management, and dispute-resolution workflows aligned with widely used quality and complaint-handling standards such as ISO 9001:2015 and ISO 10003:2018.
Competitive Landscape
Competition remains moderate, with enterprise-suite vendors, pure-play specialists, and emerging tech disruptors vying for share. Oracle, SAP, and IBM embed warranty modules within integrated supply-chain clouds, appealing to global conglomerates seeking single-vendor footprints. Tavant, Syncron, and PTC differentiate through rapid AI innovation, offering pre-trained failure-prediction models and intuitive dealer UX layers.
Strategic positioning increasingly hinges on sector focus: Syncron emphasizes heavy equipment, Tavant targets automotive, and PTC leverages ThingWorx IoT data to enrich claim context. Firms introduce “warranty-as-a-service” bundles that pair technology with managed adjudication, shifting engagement models from perpetual licenses to performance-linked contracts.
Warranty Management System Industry Leaders
-
Oracle Corporation
-
Wipro Limited
-
Pegasystems Inc.
-
IBM Corporation
-
Tavant Technologies, Inc.
- *Disclaimer: Major Players sorted in no particular order

Market Opportunities and Future Outlook
One near-term gap is operationalizing Right-to-Repair and durability disclosure requirements into day-to-day warranty execution, especially for manufacturers running multi-brand and multi-country policy sets. EU obligations that take effect around the 2026 compliance window (notably harmonized consumer information requirements and durability guarantee labeling) increase the need for configurable warranty content, traceable eligibility rules, and consistent customer communications. This supports demand for platforms that can manage multiple coverage windows and repair-linked extensions without manual rework.
Another opportunity area is moving beyond transaction processing into AI-assisted decisioning that connects field activity, claims, and supplier recovery into closed-loop quality programs. Recent vendor activity points to integration-led differentiation, including Syncron partnering with TrueContext to link field execution data to better warranty decisions, and Oracle adding supplier-warranty contract and coverage definition capabilities within Oracle Fusion Cloud Maintenance updates. These moves align with buying patterns favoring cloud-native platforms with APIs into ERP, maintenance execution, dealer systems, and mobile workflows, along with managed services for claims adjudication and recovery where internal analytics and warranty domain talent are constrained.
Recent Industry Developments
- May 2026: Syncron announced a technology partnership with TrueContext to connect field-first mobile workflows with Syncron Warranty. The integration targets higher-quality field data capture and faster feedback into warranty decisions, improving claim accuracy and strengthening supplier recovery processes for asset-intensive manufacturers.
- October 2025: Daimler Truck North America expanded its AI-driven warranty platform by extending data integration and multi-region support through a software-partner collaboration. The upgrade broadens field data capture for claims decisions and reduces cycle times across repair networks.
- June 2024: Daimler Truck North America partnered with Tavant to launch an AI-driven warranty system. The initiative signals an OEM-scale push toward claims automation and decision support, raising the bar for warranty platform providers serving automotive and transportation programs.


Research Methodology Framework and Report Scope
Market Definition and Coverage
This market covers software and related services used to set up, run, and improve warranty programs, including warranty registration, claims intake, validation, approvals, and reporting across industries.
Scope exclusions: It excludes extended warranty insurance products, third-party warranty underwriting revenue, and general ERP/CRM modules unless they are used specifically for warranty workflows.
Segmentation Overview
-
By Deployment Type
- On-premise
- Cloud (Public, Private, Hybrid)
-
By Software Type
- Warranty Intelligence and Analytics
- Claim Management
- Service Contract Administration
- Parts Returns and Supplier Recovery
-
By Component
- Solutions
-
Services
- Professional Services
- Managed Services
-
By Organisation Size
- Large Enterprises
- Small and Mid-sized Enterprises (SMEs)
-
By End-user Industry
- Automotive and Transportation
- Industrial Equipment and Heavy Machinery
- Consumer Durables and Home Appliances
- Construction and Building Materials
- Medical Devices
- Aerospace and Defence
-
By Geography
-
North America
- United States
- Canada
- Mexico
-
South America
- Brazil
- Argentina
- Rest of South America
-
Europe
- Germany
- United Kingdom
- France
- Italy
- Spain
- Russia
- Rest of Europe
-
Asia-Pacific
- China
- Japan
- India
- South Korea
- Australia
- Rest of Asia-Pacific
-
Middle East and Africa
-
Middle East
- Saudi Arabia
- UAE
- Turkey
- Rest of Middle East
-
Africa
- South Africa
- Nigeria
- Rest of Africa
-
Middle East
-
North America
Data Sources, Market Sizing, and Validation
Desk Research
Desk work starts by building a clear view of warranty activity drivers and enterprise software spending patterns. We use public sources such as US Census Bureau manufacturing statistics, Bureau of Labor Statistics price and employment series, Eurostat structural business statistics, OECD digital economy indicators, and World Bank macro data to anchor demand conditions and currency assumptions.
We also review company annual reports, SEC filings, earnings presentations, product documentation, and reputable press coverage to understand where warranty modules sit in the broader service and quality stack. Where needed, we complement this with paid subscriptions used for company financials and intelligence, patent databases, and a news and financials feed to check product launches, partnerships, and M&A timing. These examples are not exhaustive, and other sources were used across data collection, validation, and clarification.
Primary Interviews and Surveys
Primary work is used to confirm what is actually purchased, how budgets are approved, and which warranty workflows are in or out of scope. We speak with software providers, implementation partners, and warranty, aftersales, and IT leaders from end-user industries to test adoption assumptions, pricing logic, and cloud migration patterns across APAC, EMEA, and the Americas.
Distribution of primary research fieldwork respondents
| Company type | Respondent position | Region |
|---|---|---|
| Top tier: 38% | CXOs: 14% | APAC: 42% |
| Mid tier: 46% | Functional/Unit leaders: 30% | EMEA: 32% |
| Smaller Players: 16% | Managers: 56% | Americas: 26% |
Market-Sizing & Forecasting
Sizing starts with a top-down model where the enterprise software and services pool is reconstructed by region, then filtered using warranty workflow penetration and average contract values aligned to the warranty function. To keep totals realistic, we sanity-check outputs with selective bottom-up approximations, such as sampled deal ranges for cloud versus on-premise deployments, partner channel checks, and observations on solution versus managed service mix.
Inputs that commonly move the model include the installed base of warranty-bearing products in key industries, claim volumes and return rates as a proxy for processing load, cloud share of enterprise applications, typical implementation and support attach rates, and the shift toward analytics-led claim screening. For forecasting, scenario analysis is used around IT spending cycles and compliance pressure, and then the selected path is validated against expert expectations on pricing progression and renewal behavior. Where direct pricing data is thin, we use ranges by customer size and deployment type, then tighten them after interview feedback.
Data Validation & Update Cycle
Outputs are validated by comparing them with independent signals, including enterprise application spending trends, software subscription growth patterns, and observed cloud migration timing in warranty-heavy industries. When a region or end-user result looks off, we revisit the assumptions, recheck currency and inflation timing, and, if needed, re-contact sources to confirm what changed.
Before sign-off, the model and assumptions go through more than one analyst review, with variance checks across regions and across solution versus services splits. Reports are refreshed annually, and interim updates are made when material events occur, such as a major product shift or a large acquisition. Right before delivery, a final pass is done so clients receive the most current view.
Mordor Intelligence's Warranty Management System Market Estimate Compared With Other Published Estimates
Published market sizes for warranty management systems often differ because the line between software, services, and adjacent customer service tools is not drawn the same way, and because forecast windows and base years vary. Differences also show up when one study assumes rapid cloud price expansion, while another assumes flat pricing and slower conversion from legacy tools.
Key gaps usually come from whether managed services are counted alongside software subscriptions, how implementation revenue is treated across years, and whether the scope includes broader service-contract administration. The spread also increases when currency conversion timing is not aligned to the stated base year, or when adoption rates are inferred without validating them with warranty operations teams. In this study, the scope separates warranty workflow platforms from insurance-like extended warranty products before sizing, a choice applied by Mordor Intelligence.
Benchmark comparison
| Source | Market Size | Gaps in Research Methodology |
|---|---|---|
| Mordor Intelligence | USD 5.60 B (2025) | |
| Industry Publisher A | USD 3.70 B (2022) | Uses an earlier base year and a longer horizon, and the scope description centers on warranty management software applications, which can undercount managed services and later-stage analytics modules that are now bought as part of warranty programs. |
| Industry Publisher B | USD 4.86 B (2024) | Positions the scope as warranty management software, which can exclude service-heavy contracts, and applies a different product-type split that may not map cleanly to solution-plus-services buying in large enterprises. |
Across the three figures, the main differences are timing and what gets counted as part of warranty operations spend. When scope lines are kept clear and assumptions are cross-checked with practitioners, the market total stays traceable to a repeatable set of adoption and pricing drivers, and it becomes easier to explain year-to-year changes.


Key Questions Answered in the Report
What is the current size of the global warranty management system market?
The market is valued at USD 6.36 billion in 2026.
How fast is the warranty management system market expected to grow?
It is projected to expand at a 13.65% CAGR, reaching USD 12.07 billion by 2031.
Which deployment model holds the largest share today?
Cloud deployments lead with 64.00% of 2025 revenue.
Which industry vertical is growing the fastest in adopting warranty platforms?
Medical devices shows the highest growth, advancing at a 15.62% CAGR through 2031.
Page last updated on:


