Network Monitoring Market Size and Share
Market Overview
| Study Period | 2020 - 2031 |
|---|---|
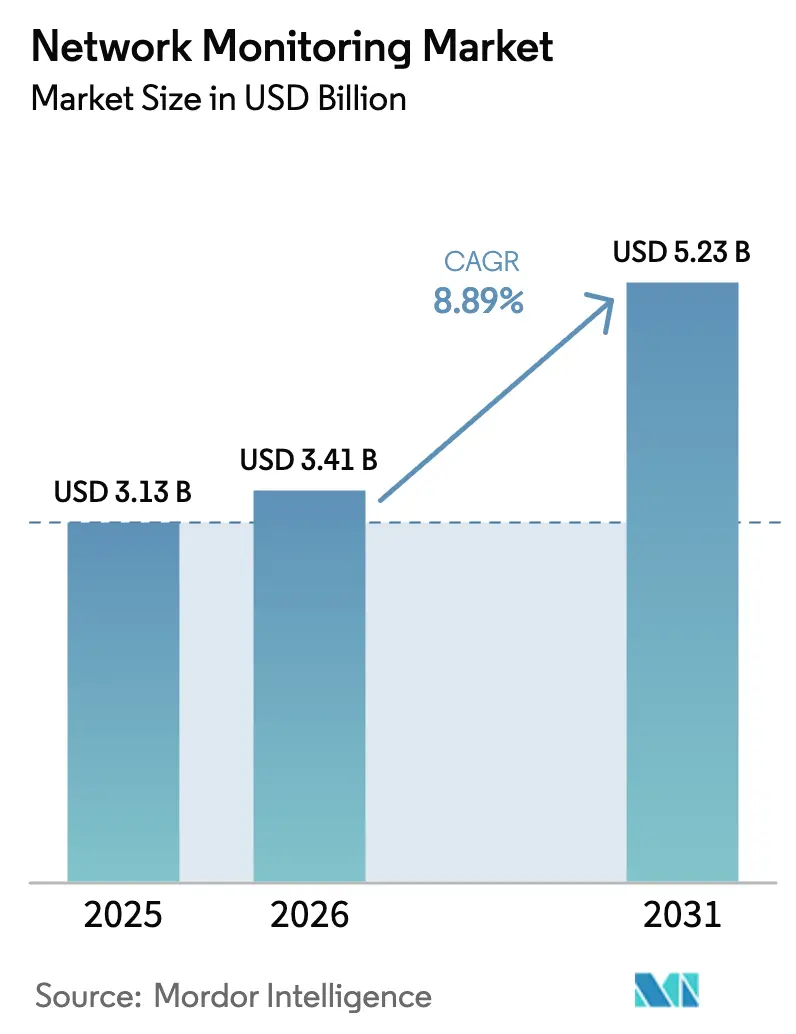
| Market Size (2026) | USD 3.41 Billion |
| Market Size (2031) | USD 5.23 Billion |
| Growth Rate (2026 - 2031) | 8.89% CAGR |
| Fastest Growing Market | Asia Pacific |
| Largest Market | North America |
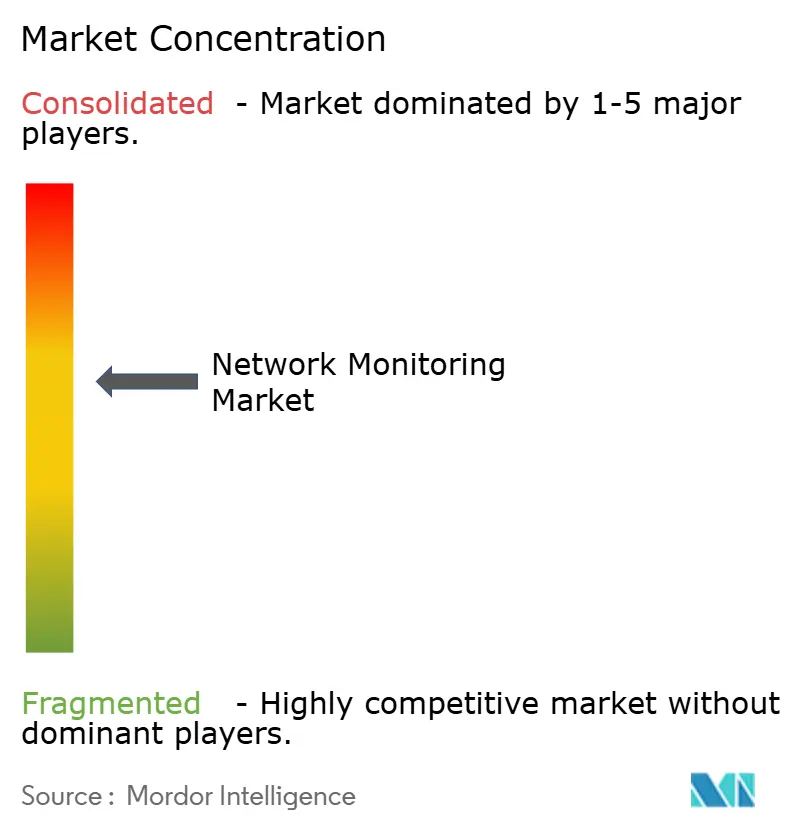
| Market Concentration | Medium |
Major Players *Disclaimer: Major Players sorted in no particular order Image © Mordor Intelligence. Reuse requires attribution under CC BY 4.0. | |
Network Monitoring Market Analysis by Mordor Intelligence
The Network Monitoring Market size is expected to increase from USD 3.13 billion in 2025 to USD 3.41 billion in 2026 and reach USD 5.23 billion by 2031, growing at a CAGR of 8.89% over 2026-2031. This expansion is propelled by federal zero-trust mandates, the rapid rise of 5G and IoT endpoints, and the migration to hybrid-cloud architectures that demand distributed visibility. Enterprises are turning to software-defined observability platforms that scale without proportional capital outlays, while network equipment makers embed basic monitoring in switches and routers to defend share. Intense competition is steering vendors toward AI-driven anomaly detection and eBPF-based packet inspection, and managed service providers are capitalizing on skills shortages by offering monitoring-as-a-service. The convergence of these trends positions the network monitoring market for sustained, high-single-digit growth over the forecast horizon.
Key Report Takeaways
- By component, monitoring equipment held 44.66% of revenue in 2025, whereas services are advancing at a 10.54% CAGR through 2031.
- By deployment mode, on-premise solutions led with 57.96% share in 2025, while hybrid architectures are expanding at an 11.54% CAGR to 2031.
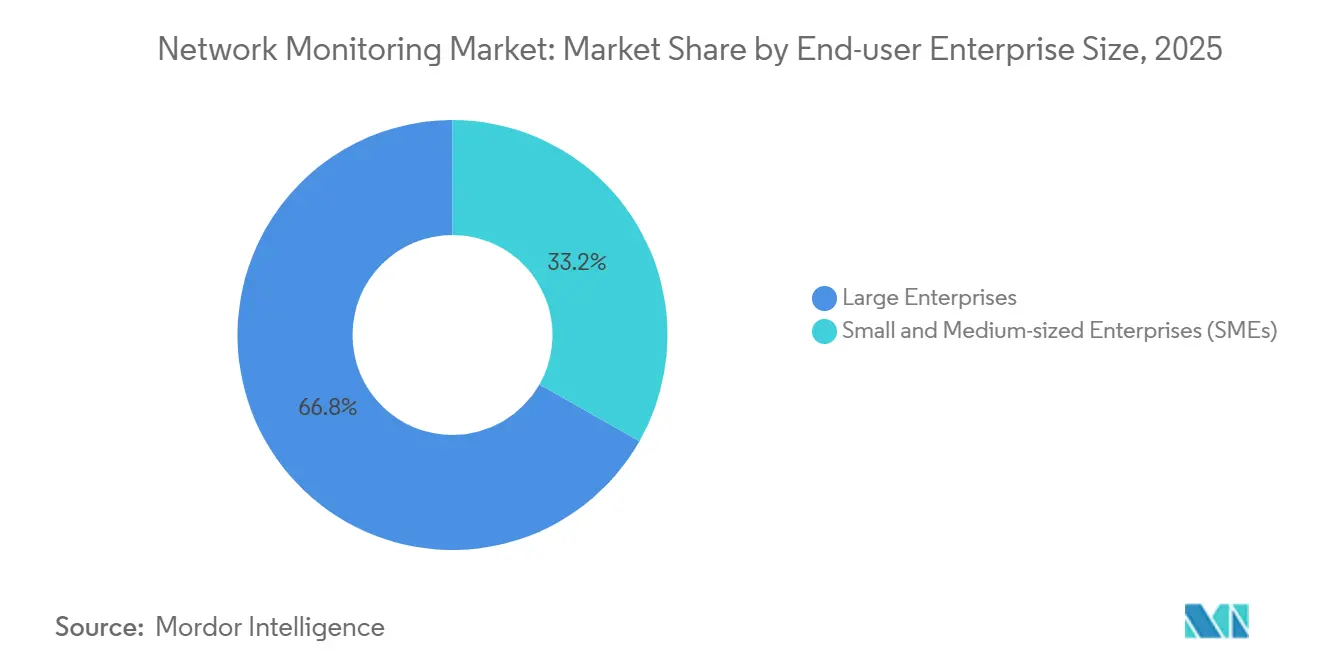
- By enterprise size, large enterprises commanded 66.78% of 2025 spending, yet small and medium-sized enterprises are growing at a 9.24% CAGR on the back of SaaS pricing.
- By end-user industry, IT and telecommunications captured 29.52% share in 2025, with healthcare rising at a 9.86% CAGR through 2031.
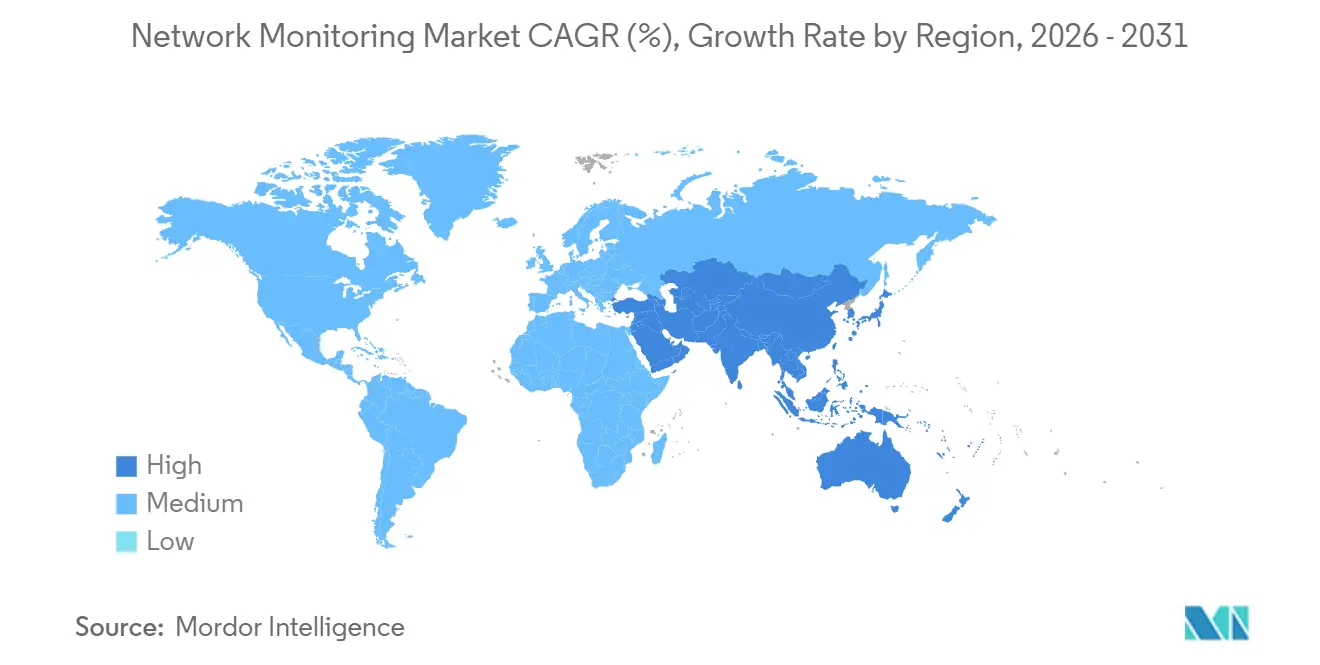
- By geography, North America held 40.68% of 2025 revenue, whereas Asia Pacific is forecast to notch a 10.24% CAGR to 2031.
Note: Market size and forecast figures in this report are generated using Mordor Intelligence’s proprietary estimation framework, updated with the latest available data and insights as of January 2026.
Global Network Monitoring Market Trends and Insights
Drivers Impact Analysis*
| Driver | (~) % Impact on CAGR Forecast | Geographic Relevance | Impact Timeline |
|---|---|---|---|
| Proliferation of Cloud and Hybrid-Work Traffic | +2.1% | Global, concentrated in North America and Europe | Medium term (2-4 years) |
| Rapid 5G and IoT Traffic Expansion | +1.8% | Asia Pacific core, spillover to Middle East and Africa | Long term (≥ 4 years) |
| Cybersecurity and Zero-Trust Compliance Mandates | +2.3% | North America and Europe, expanding to Asia Pacific | Short term (≤ 2 years) |
| AIOps-Enabled Observability Adoption | +1.5% | Global, led by North America and Europe | Medium term (2-4 years) |
| eBPF-Based Deep-Visibility Momentum | +0.9% | North America and Europe, early adoption in Asia Pacific | Long term (≥ 4 years) |
| Energy-Efficient Green IT Monitoring Demand | +0.7% | Europe core, expanding to North America and Asia Pacific | Long term (≥ 4 years) |
| Source: Mordor Intelligence | |||
Proliferation of Cloud and Hybrid-Work Traffic
The pandemic-driven shift to hybrid work and multi-cloud computing compelled enterprises to abandon perimeter-centric tools in favor of distributed telemetry that follows workloads across data centers, public clouds, and remote endpoints. By 2025, 87% of companies ran hybrid or multi-cloud estates, yet 73% lacked full-stack observability, creating blind spots that misconfigurations exploit.[1]Cisco, “Global Networking Trends Report 2025,” cisco.com Network downtime cost USD 2 million per hour in 2025, pushing adoption of real-time analytics that link application performance to infrastructure health. Encrypted DNS and pervasive HTTPS reduce packet-level visibility, steering demand to metadata analytics that infer behavior from flow records and TLS handshakes. Cloud providers embed monitoring in usage fees, opening land-and-expand opportunities for SaaS vendors that scale without appliances. This driver materially lifts the network monitoring market’s growth trajectory.
Rapid 5G and IoT Traffic Expansion
Asia Pacific’s 5G subscriptions are poised to reach 2.1 billion by 2030, while global IoT connections will climb to 38.5 billion by the same year.[2]GSMA Intelligence, “The Mobile Economy 2024,” gsma.com Industrial IoT introduces machine-to-machine traffic where micro-second latency spikes can halt production, requiring sub-second visibility. Network slicing demands per-slice telemetry to enforce service-level agreements, and edge computing fragments visibility across thousands of micro data centers. Vendors are responding with lightweight agents capable of running on resource-constrained edge nodes, positioning the network monitoring market for elevated demand in manufacturing, logistics, and smart-city deployments.
Cyber-Security and Zero-Trust Compliance Mandates
U.S. federal agencies must achieve zero-trust architectures by fiscal 2027 under OMB Memorandum M-22-09. The mandate requires network telemetry that validates identity at every request, converting monitoring from a best practice to a compliance obligation. Parallel regulations in Europe and Asia elevate on-premise or hybrid deployments to satisfy data residency. Healthcare, finance, and critical infrastructure sectors invest heavily to meet HIPAA, PCI-DSS 4.0, and sector-specific audit trails, respectively. These mandates accelerate the conversion of latent demand into contracted spending, reinforcing the network monitoring market’s mid-term CAGR.
AIOps-Enabled Observability Adoption
By 2025, 94% of enterprises used some form of AIOps, up 12 percentage points year-over-year. Machine-learning models surface anomalies that diverge two standard deviations from baseline traffic, reducing mean time to resolution by up to 60%. Daily telemetry volumes reach 1.5 terabytes in a median enterprise, overwhelming human analysts and necessitating automated correlation. While AI lowers the skills barrier for routine triage, model efficacy hinges on high-quality data, driving demand for vendors that control large, anonymized datasets. This driver sustains premium pricing for AI-infused platforms within the network monitoring market.
Restraints Impact Analysis*
| Restraint | (~) % Impact on CAGR Forecast | Geographic Relevance | Impact Timeline |
|---|---|---|---|
| High-Speed Appliance Capex Burden | -1.4% | Global, acute in SME segment and emerging markets | Short term (≤ 2 years) |
| Skills Shortage in NetOps and SecOps | -1.1% | Global, most severe in North America and Europe | Medium term (2-4 years) |
| Bundled NEM Gear Cannibalizing Stand-Alone Tools | -0.8% | Global, concentrated in enterprise segment | Medium term (2-4 years) |
| Data-Sovereignty Limits on Cloud Monitoring | -0.6% | Europe, Asia Pacific (China, India), Middle East | Long term (≥ 4 years) |
| Source: Mordor Intelligence | |||
High-Speed Appliance Capex Burden
Transitioning to 400-gigabit and 800-gigabit links forces buyers to weigh USD 50,000-USD 150,000 packet brokers and USD 200,000-plus 800-gigabit systems, a threefold cost jump over 100-gigabit gear. SMEs, which supplied 33.22% of 2025 revenue, often replace deep-packet inspection with sampled flow data, leaving gaps that low-frequency attacks exploit. Software-defined monitoring on commodity servers with FPGA or GPU acceleration trims per-port costs by up to 50%, but requires specialized skills, limiting near-term uptake and capping network monitoring market growth.
Skills Shortage in NetOps and SecOps
The 2024 global cybersecurity workforce gap hit 3.5 million positions, and 67% of organizations reported project delays due to talent shortages.[3]ISC2, “Cybersecurity Workforce Study 2024,” isc2.org Senior NetOps roles stayed open for 120 days on average in 2025, pushing enterprises toward managed services or under-monitored networks. Vendors embed automation to mask complexity, yet sophisticated threats still demand human protocol analysts. The shortage tempers deployment velocity, moderating overall growth in the network monitoring market.
*Our forecasts treat driver/restraint impacts as directional, not additive. The impact forecasts reflect baseline growth, mix effects, and variable interactions.
Segment Analysis
By Component: Services Expand as Complexity Rises
Monitoring equipment controlled 44.66% of 2025 revenue, underpinned by data-center packet brokers and optical taps that remain indispensable at high speeds. However, services posted the fastest expansion at a 10.54% CAGR. Professional engagements for HIPAA-aligned deployments often exceed USD 2 million, and managed services resonate with SMEs seeking 24-hour coverage without staffing operations centers. eBPF lets vendors insert deep-visibility code into Linux kernels, eroding the necessity of hardware taps, while network equipment makers bundle basic monitoring in switches, squeezing equipment margins. The network monitoring market size attributed to services is positioned to outpace hardware as enterprises outsource NetOps.
Software revenue moves in tandem with cloud-native adoption. Agent-based collectors that run on containers displace appliances, and SaaS-delivery trims rollout times from months to days. Hyperscalers favor subscription models that align spend with throughput, while regulated sectors retain on-premise collectors to satisfy residency rules. As a result, hardware revenues will grow at a low-single-digit pace, whereas services and software together will dominate incremental network monitoring market share gains to 2031.


By Deployment Mode: Hybrid Gains on Sovereignty and Economics
On-premise deployments held 57.96% share in 2025, sustained by GDPR, China’s Personal Information Protection Law, and other data-sovereignty statutes. These policies dictate that telemetry never leave national borders, reinforcing on-premise capture for regulated data sets. Nonetheless, hybrid configurations are projected to rise at an 11.54% CAGR. Enterprises increasingly retain raw packets locally yet stream enriched metadata to public-cloud analytics for machine-learning insight, a pattern that mitigates residency risk while capturing cloud economics.
Cloud-native monitoring attracts digital-native firms with no private data centers. Consumption-based pricing and instant scale eliminate appliance outlays, appealing to SMEs expanding at 9.24% CAGR. Shipping full-fidelity packets to the cloud adds 50-200 milliseconds of delay. Vendors counter with edge analytics that cut bandwidth by as much as 80%. This mix positions hybrid as the sweet spot for balance of compliance and scale, reinforcing growth momentum in the network monitoring market size for this segment.
By Enterprise Size: SMEs Embrace SaaS Economics
Large enterprises delivered 66.78% of 2025 revenue, reflecting vast device counts and multi-site architectures. These firms integrate best-of-breed stacks and lead adoption of AI-driven monitoring. The network monitoring market share among large enterprises will remain substantial, yet growth moderates as saturation approaches.
SMEs, however, represent the growth frontier. Pay-as-you-go SaaS lets a 500-employee firm secure enterprise-grade visibility for USD 5,000-USD 15,000 per month instead of high six-figure capital budgets. Managed service providers further lower barriers by bundling tooling, operations, and incident response. Although cultural inertia can slow buying decisions, high-profile outages shift perceptions. Consequently, SMEs will capture a rising proportion of incremental network monitoring market size through 2031.
By End-User Industry: Healthcare Surges on Telehealth and Compliance
IT and telecommunications retained 29.52% of 2025 spending as service providers enforce SLAs and monetize analytics across massive subscriber bases. Yet healthcare’s 9.86% CAGR makes it the fastest-growing vertical. Ransomware hit 93% of healthcare entities in 2024, and HIPAA audits demand real-time anomaly detection. Network monitoring cuts ransomware recovery time from 21 days to 7 days, underpinning budget increases.
Financial institutions value continuous monitoring for PCI-DSS 4.0 and Sarbanes-Oxley audit trails, investing USD 1-USD 5 million annually. Energy and utilities, government, and industrial firms require protocol-aware visibility for SCADA and DNP3 traffic. Retailers focus on checkout latency, losing USD 100,000 per hour of downtime during peaks. These vertical nuances collectively sustain broad-based growth in the network monitoring industry while healthcare lifts overall CAGR.
Geography Analysis
North America accounted for 40.68% of 2025 revenue, supported by OMB’s zero-trust mandate and aggressive cloud adoption. Canada’s Critical Cyber Systems Protection Act adds similar obligations, while Mexico’s liberalized telecom market prompts 5G investments. Despite maturity, replacement cycles and feature upgrades keep the region on a solid 7-8% growth path, reinforcing its central role in the network monitoring market.
Asia Pacific will post the fastest regional expansion at a 10.24% CAGR. China invested USD 180 billion in 5G between 2020 and 2025, and India’s BharatNet Phase III earmarked USD 5.6 billion to connect 250,000 villages. Data-localization laws drive on-premise capture, yet cloud analytics still flourish via anonymized metadata. Japan’s Digital Agency mandates zero-trust for new federal systems, and South Korea’s 5G penetration passed 50% in 2025, necessitating dense, low-latency monitoring.
Europe’s GDPR enforcement yielded USD 5.2 billion in fines during 2024, spurring investment in on-premise observability. The Energy Efficiency Directive 2023/1791 compels 11.7% energy savings, motivating data centers to monitor power and network utilization. Germany, the United Kingdom, France, and Italy comprise 60% of regional spend. In the Middle East, Saudi Arabia’s Vision 2030 and the UAE’s Dubai 2040 plan drive smart-city projects worth more than USD 500 billion, each requiring edge-to-cloud visibility. Africa’s opportunity remains nascent but improving as South Africa, Nigeria, and Egypt deploy 5G and upgrade critical infrastructure. These dynamics collectively broaden the global footprint of the network monitoring market.

Competitive Landscape
The top five players Cisco, Microsoft, Broadcom, IBM, and SolarWinds captured roughly 45% of 2025 revenue. Cisco’s USD 28 billion Splunk takeover integrated internet visibility from ThousandEyes with security analytics, creating a defensible end-to-end portfolio. IBM’s USD 6.4 billion HashiCorp deal adds infrastructure-as-code automation that spins up monitoring alongside workloads. Bundling strategies by network equipment manufacturers pressure stand-alone vendors, prompting differentiation through AI and eBPF-driven deep packet inspection.
White-space persists in operational technology where Modbus and DNP3 protocols dominate, and at the edge where devices offer <512 MB RAM. Cloud-native challengers Datadog and Dynatrace undercut incumbents via unified dashboards and usage-based pricing. Open-source combinations Prometheus, Grafana, and Jaeger gain traction among engineering-rich enterprises, although integration complexity limits mass adoption. The IEEE 802.1Qcw telemetry standard, ratified in 2024, fosters multi-vendor interoperability, lowering switching costs and raising competitive pressure.
Vendors embed guided workflows, auto-baselining, and low-code diagnostics to democratize use. SolarWinds, recovering from its 2020 breach, added Kubernetes monitoring to reclaim credibility, while NETSCOUT integrated AIOps to cut incident timelines. Overall, consolidation and feature convergence will continue as vendors race to deliver full-stack visibility across cloud, edge, and on-premise estates.
Network Monitoring Industry Leaders
Cisco Systems, Inc.
SolarWinds Worldwide, LLC
Broadcom Inc.
NETSCOUT Systems, Inc.
IBM Corporation
- *Disclaimer: Major Players sorted in no particular order

Recent Industry Developments
- December 2025: Datadog expanded its Network Performance Monitoring platform with enhanced support for eBPF-based deep packet inspection, enabling customers to trace application-layer transactions through containerized microservices without deploying sidecar proxies.
- November 2025: Microsoft Azure launched Azure Monitor Network Insights 2.0, integrating AI-powered anomaly detection that correlates network telemetry with application performance metrics across hybrid and multi-cloud environments.
- October 2025: Dynatrace released Davis AI 5.0 with causal inference capabilities that identify upstream dependencies responsible for application performance degradation across distributed architectures.
- September 2025: Cisco Systems integrated Splunk Observability Cloud with ThousandEyes to deliver unified visibility across internet, cloud, and enterprise networks following the completion of the USD 28 billion Splunk acquisition.


Research Methodology Framework and Report Scope
Market Definitions and Key Coverage
Our study defines the global network monitoring market as revenue from purpose-built appliances, software probes, and cloud services that continuously capture, analyze, and visualize live traffic or performance metrics so administrators can anticipate outages in on-premise, edge, and public-cloud domains. We include initial licenses, hardware sales, and recurring subscriptions that deliver real-time visibility, alerting, reporting, and analytics.
Scope exclusion: pure security detection tools (IDS or NDR) and broad IT service suites lacking packet or flow level monitoring are outside scope.
Segmentation Overview
- By Component
- Monitoring Equipment
- Software
- Services
- Professional Services
- Managed Services
- By Deployment Mode
- On-Premise
- Cloud
- Hybrid
- By End-User Enterprise Size
- Large Enterprises
- Small and Medium-Sized Enterprises (SMEs)
- By End-User Industry
- IT and Telecommunications
- BFSI
- Healthcare
- Energy and Utilities
- Government
- Retail and E-Commerce
- Industrial and Manufacturing
- Other End-User Industries
- By Geography
- North America
- United States
- Canada
- Mexico
- South America
- Brazil
- Argentina
- Rest of South America
- Europe
- Germany
- United Kingdom
- France
- Italy
- Spain
- Russia
- Rest of Europe
- Asia Pacific
- China
- Japan
- India
- South Korea
- Australia and New Zealand
- Rest of Asia Pacific
- Middle East
- Saudi Arabia
- United Arab Emirates
- Turkey
- Rest of Middle East
- Africa
- South Africa
- Nigeria
- Egypt
- Rest of Africa
- North America
Detailed Research Methodology and Data Validation
Primary Research
Mordor analysts interview network architects at multinational enterprises, procurement leads in telecom carriers, managed service providers across Asia and Europe, and product managers at monitoring vendors. These conversations validate traffic growth, deployment ratios, and licensing models that public documents only hint at.
Desk Research
We begin with open datasets such as FCC traffic filings, Eurostat ICT surveys, APNIC routing statistics, IEEE observability journals, and customs records tracking 10-100 Gbps test gear imports. Our team then parses 10-Ks, S-1s, and investor decks to benchmark average selling prices and renewal mixes, while Dow Jones Factiva news feeds and D&B Hoovers financial snapshots sharpen trend checks. These sources are illustrative; many additional repositories are consulted before any figure is fixed.
Second, we align definitions across regions by reviewing telecom regulator consultations and trade association white papers, which helps us avoid double counting and spot emerging drivers.
Market-Sizing & Forecasting
We build a top-down model that scales the installed base of Ethernet switch ports and cloud instances, applies weighted monitoring penetration by bandwidth tier, and then multiplies by blended ASPs shared during interviews. Sampled supplier roll-ups serve as bottom-up sense checks. Key variables like global IP traffic, hybrid cloud workload share, shipments of 25 Gbps plus ports, NetOps staffing ratios, and renewal cycles feed a multivariate regression, while scenario analysis cushions macro or technology shocks.
Data Validation & Update Cycle
Outputs pass variance tests against historic vendor revenue, peer review every worksheet, and prompt re-contacts when anomalies appear. Reports refresh each year; interim updates follow material events, so clients receive the latest validated baseline.
Why Mordor's Network Monitoring Baseline Earns Decision-Maker Trust
Published figures often differ because providers blend dissimilar product sets, pick divergent traffic thresholds, convert currencies on different dates, and refresh at uneven intervals.
By focusing only on real-time performance tools and anchoring adoption to observed port counts, Mordor Intelligence offers a consistent, decision-ready reference.
Benchmark comparison
| Market Size | Anonymized source | Primary gap driver |
|---|---|---|
| USD 3.12 B (2025) | Mordor Intelligence | |
| USD 3.71 B (2024) | Global Consultancy A | Mixes security analytics and log management with performance monitoring |
| USD 2.40 B (2025) | Research Publisher B | Counts hardware probes only and omits SaaS plus services revenue |
| USD 9.03 B (2023) | Trade Journal C | Bundles wider network management suites and uses older baseline without currency normalization |
These contrasts show that once scope and vintage gaps are stripped away, our disciplined variable choice and annual refresh cadence supply the most transparent and reproducible view of the true opportunity.


Key Questions Answered in the Report
What is the projected value of the network monitoring market in 2031?
It is forecast to reach USD 5.23 billion by 2031, advancing at an 8.9% CAGR.
Which deployment mode is growing the fastest in network observability?
Hybrid architectures are expanding at an 11.54% CAGR as firms balance data sovereignty with cloud economics.
Why is healthcare spending on network monitoring accelerating?
Rising telehealth traffic, ransomware exposure, and HIPAA audit mandates are driving a 9.86% CAGR in healthcare deployments.
How are skills shortages affecting adoption of monitoring tools?
A 3.5 million-person cybersecurity talent gap delays advanced tool rollouts, pushing enterprises toward managed services.
What role does AIOps play in modern monitoring platforms?
AI models automate anomaly detection and root-cause analysis, cutting mean time to resolution by up to 60%.
Which region offers the highest growth potential?
Asia Pacific leads with a forecast 10.24% CAGR, fueled by large-scale 5G and broadband infrastructure investments.
Page last updated on:


