
Technology, Media and Telecom
5th MayPricing Strategy for Semiconductor Components
3 Min Read
The Monitoring Tools Market Report is Segmented by Component (Solution, and Services), Deployment Mode (Cloud, and On-Premises), End-User Vertical (IT and Telecom, BFSI, Retail and E-Commerce, Healthcare, Media and Entertainment, Energy and Utilities, and Government and Public Sector), Organization Size (Large Enterprises, and Small and Medium Enterprises (SMEs)), and Geography
Market Overview
| Study Period | 2020 - 2031 |
|---|---|
| Market Size (2026) | USD 43.66 Billion |
| Market Size (2031) | USD 77.13 Billion |
| Growth Rate (2026 - 2031) | 12.05 % CAGR |
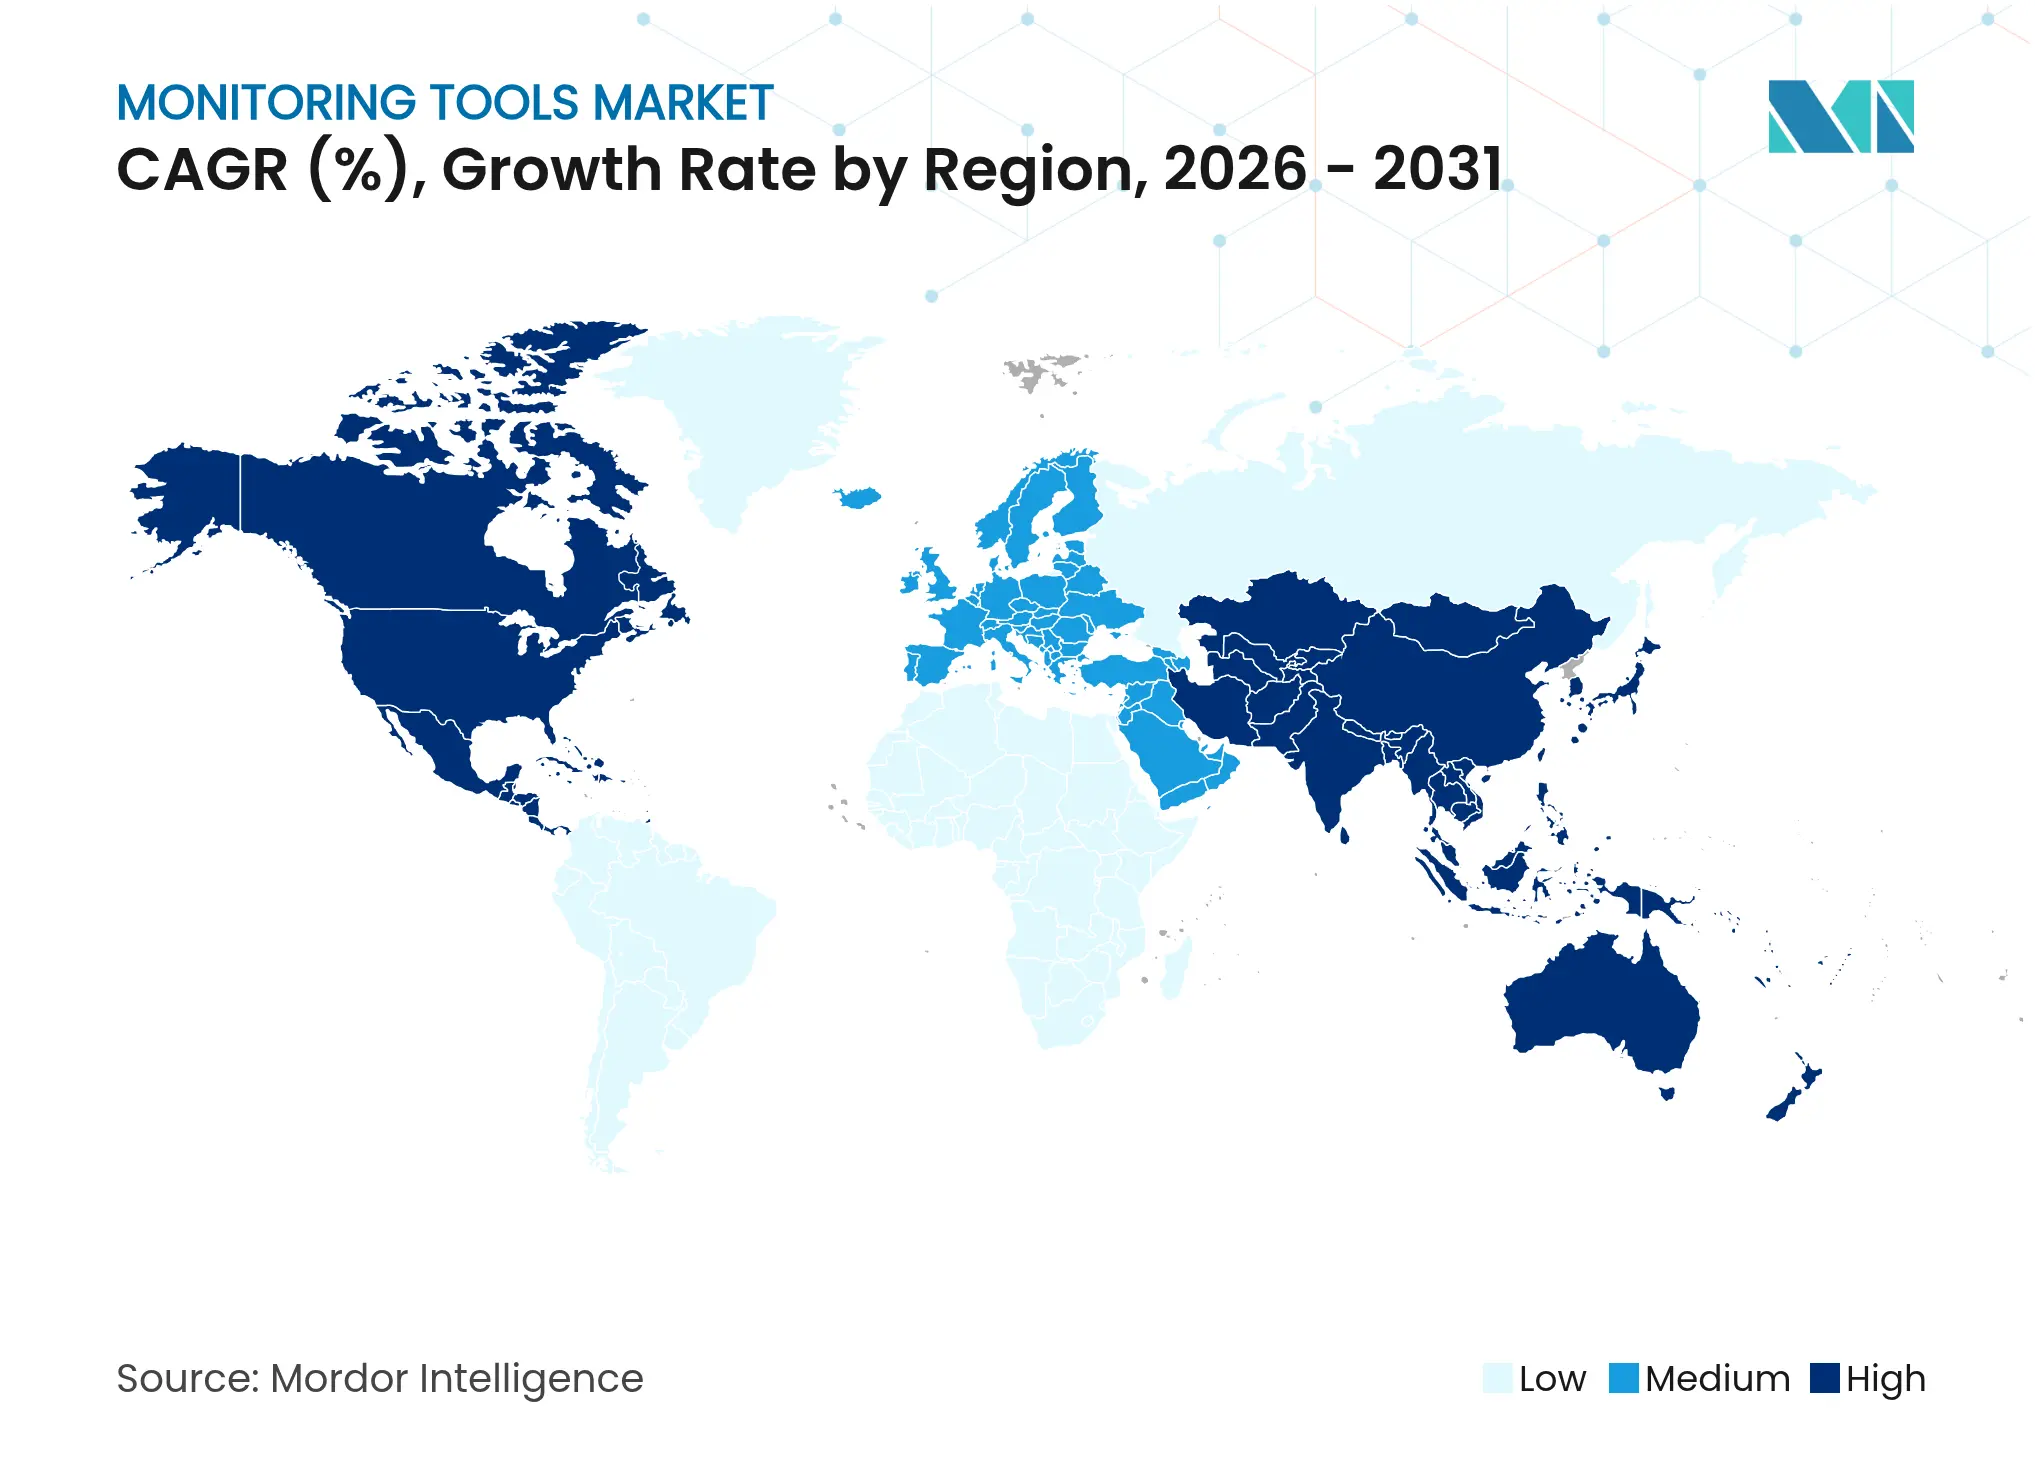
| Fastest Growing Market | Asia Pacific |
| Largest Market | North America |
| Market Concentration | Medium |
Major Players *Disclaimer: Major Players sorted in no particular order. Image © Mordor Intelligence. Reuse requires attribution under CC BY 4.0. |
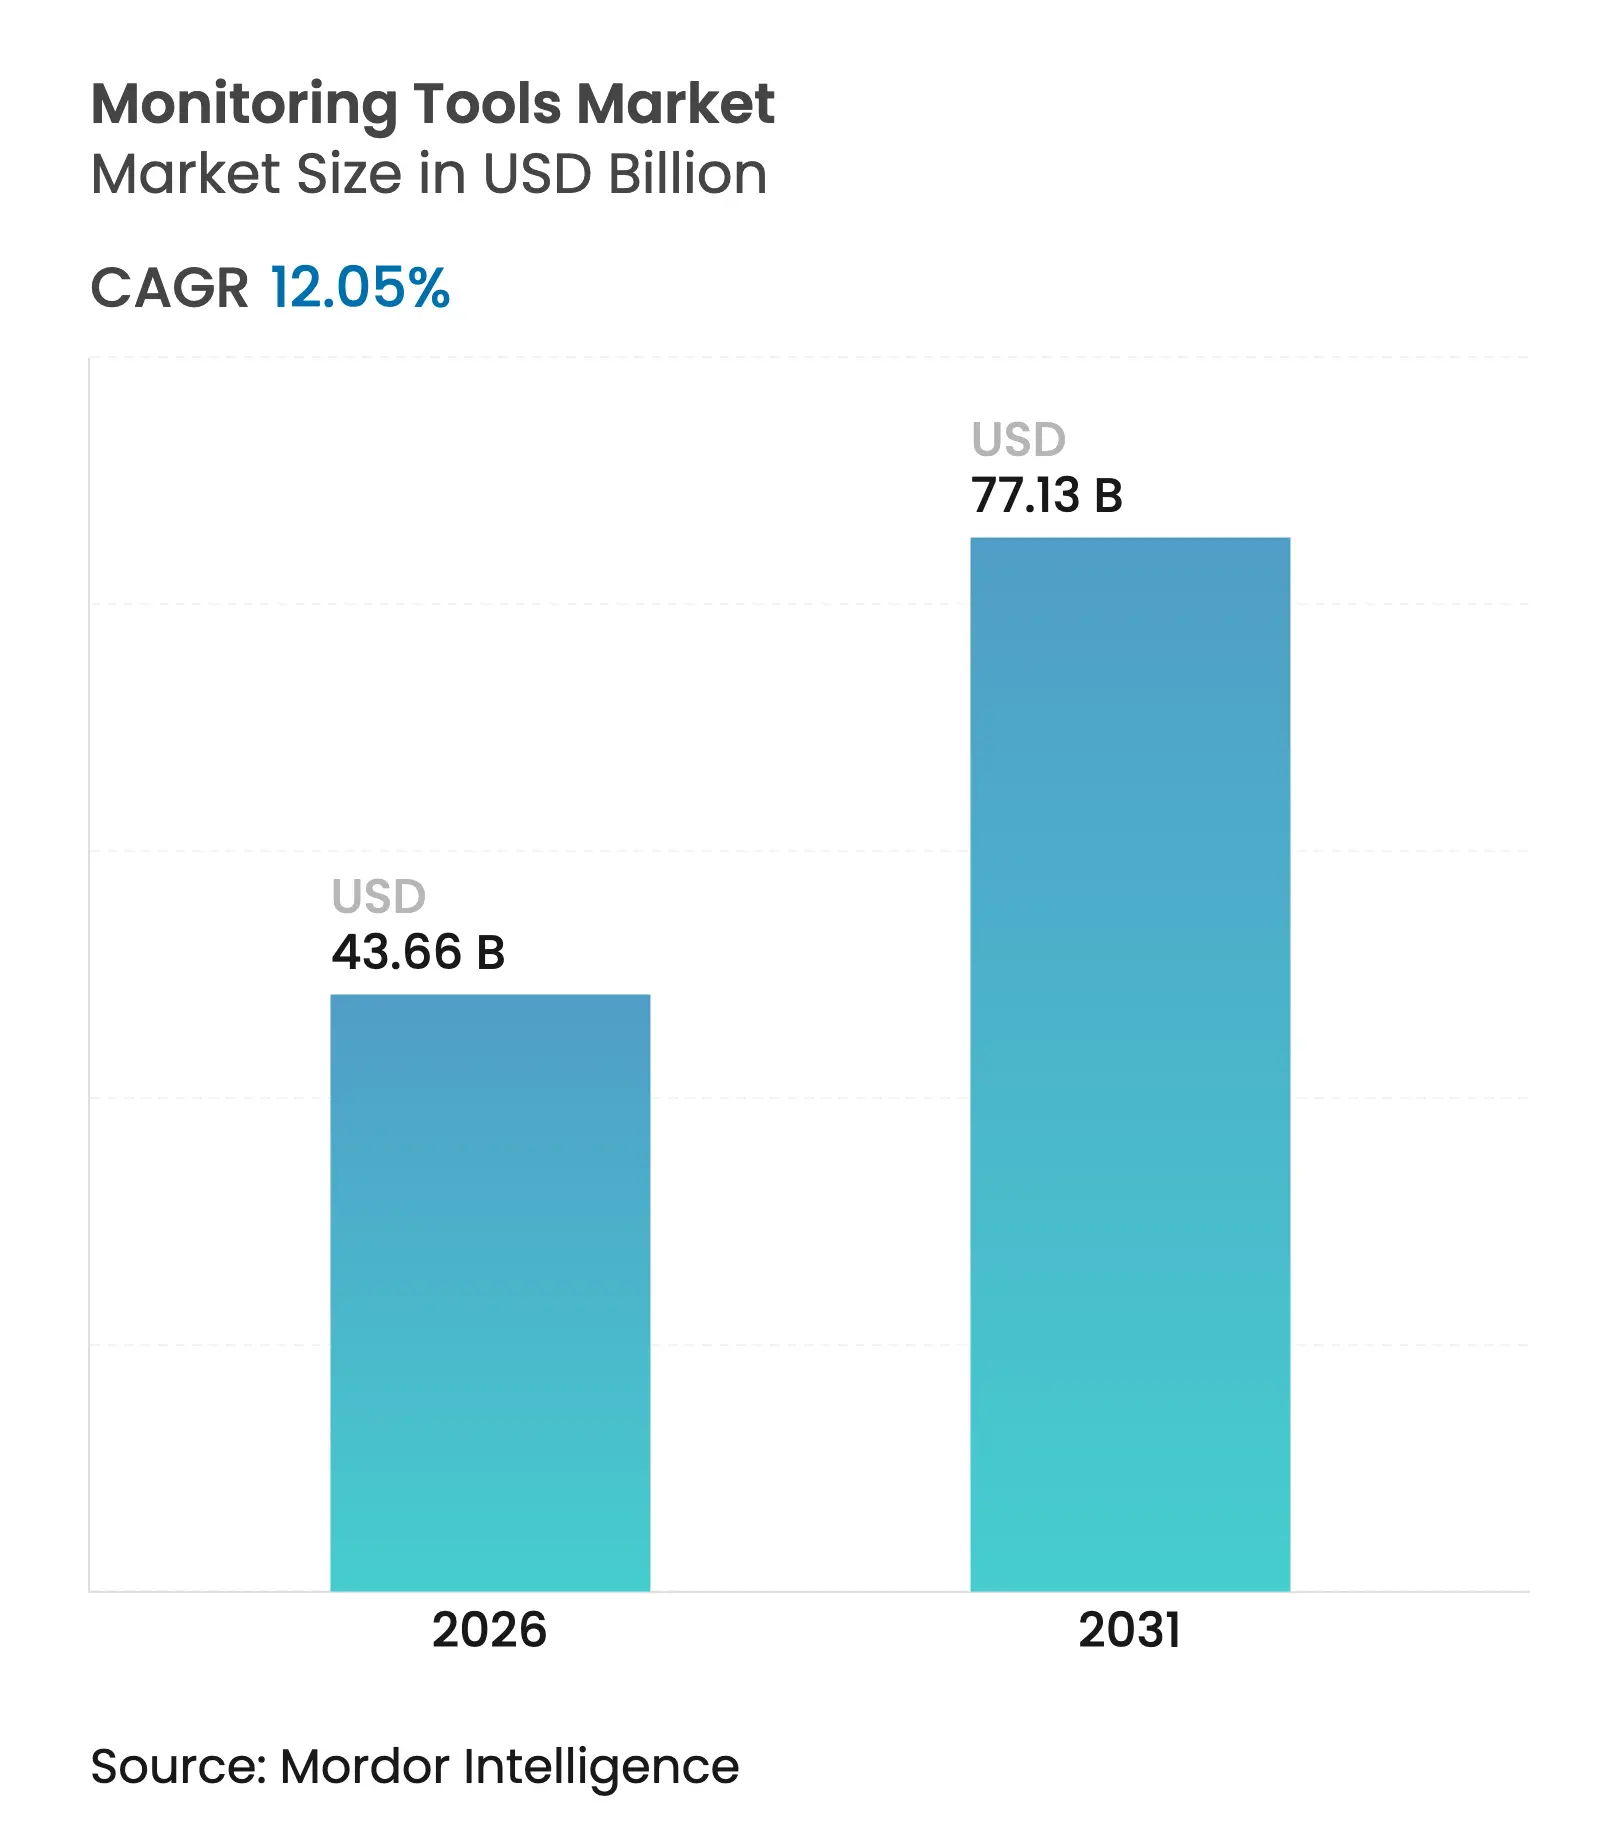
Monitoring tools market size in 2026 is estimated at USD 43.66 billion, growing from 2025 value of USD 38.97 billion with 2031 projections showing USD 77.13 billion, growing at 12.05% CAGR over 2026-2031. Growth is anchored in three structural shifts: large-scale cloud-native adoption, fast-maturing AIOps platforms that automate root-cause analysis, and expanding regulatory mandates aimed at operational resilience. Demand for unified observability has intensified as enterprises consolidate tool sprawl and link telemetry to business outcomes. Hybrid and edge-first deployments are adding complexity, placing a premium on open standards and AI-enabled anomaly detection. Competitive intensity is rising as vendors race to integrate security, converge OT and IT telemetry, and capitalize on white-space opportunities linked to sustainability and compliance.
Key Report Takeaways
Note: Market size and forecast figures in this report are generated using Mordor Intelligence's proprietary estimation framework, updated with the latest available data and insights as of 2026.
Drivers Impact Analysis
| Driver | (~) % Impact on CAGR Forecast | Geographic Relevance | Impact Timeline | |||
|---|---|---|---|---|---|---|
Surge in cloud-native architectures adoption
Surge in cloud-native architectures adoption
| +2.8% | Global | Medium term (2-4 years) |
(~) % Impact on CAGR Forecast
:
+2.8%
|
Geographic Relevance
:
Global
|
Impact Timeline
:
Medium term (2-4 years)
|
Growing need for unified observability across hybrid
IT
Growing need for unified observability across hybrid
IT
| +2.2% | North America, Asia-Pacific | Medium term (2-4 years) | |||
AI-driven root-cause analysis reduces MTTR
AI-driven root-cause analysis reduces MTTR
| +1.9% | Global | Short term (≤ 2 years) | |||
DevSecOps expansion demands continuous security
monitoring
DevSecOps expansion demands continuous security
monitoring
| +1.4% | North America, EU | Medium term (2-4 years) | |||
Sustainability mandates for energy-efficient data
centers
Sustainability mandates for energy-efficient data
centers
| +0.9% | EU, North America, Asia-Pacific | Long term (≥ 4 years) | |||
Edge-first deployments in 5G and IoT ecosystems
Edge-first deployments in 5G and IoT ecosystems
| +0.8% | Asia-Pacific , North America, EU | Medium term (2-4 years) | |||
| Source: Mordor Intelligence | ||||||
Surge in cloud-native architectures adoption
Enterprise migration to containerized, microservices-based workloads is redefining performance baselines. OpenTelemetry is now the default instrumentation standard, enabling unified telemetry pipelines and reducing vendor lock-in. Vendors are embedding machine-learning models that automatically detect anomalies and suppress redundant alerts, which is lowering mean time to resolution and shrinking infrastructure waste. Because telemetry volumes grow exponentially in dynamic clusters, platform consolidation has become critical to cost control. Early adopters report faster release cycles and fewer production incidents, reinforcing cloud-native monitoring as a strategic asset for digital transformation[2]Chuck Robbins, “Cisco Completes Acquisition of Splunk,” Cisco Press Release, splunk.com.
Growing need for unified observability across hybrid IT
Hybrid and multi-cloud strategies have become standard practice, yet disparate tools often fragment visibility across on-premises, public-cloud, and edge resources. More than half of large enterprises now operate five or more monitoring platforms, driving operational overhead and complicating root-cause analysis. Unified observability platforms cut tool silos, improve data correlation, and enable predictive alerting that ties directly to service-level objectives. The resulting uptime gains and lower license costs are accelerating platform upgrades, particularly among regulated industries that must document end-to-end compliance.
AI-driven root-cause analysis reduces MTTR
AIOps solutions blend pattern recognition, time-series forecasting, and large language models to surface actionable insights in near real time. Early deployments show outage cost reductions approaching 48% as automated remediation scripts handle repetitive incidents. Natural-language interfaces allow junior engineers to query complex telemetry sets without specialized skills, easing the talent shortage. Continuous learning loops refine detection accuracy, creating a virtuous cycle that boosts productivity and business continuity[1]BM Research, “APAC AI Outlook Report,” IBM, asean.newsroom.ibm.com.
DevSecOps expansion demands continuous security monitoring
Integrating security checks into every phase of the development pipeline is driving demand for real-time threat detection that spans infrastructure, applications, and APIs. Regulatory frameworks such as the Digital Operational Resilience Act (DORA) and CIP-015-1 compel critical industries to maintain auditable logs, demonstrate rapid response, and ensure supply-chain visibility. Observability vendors are embedding security analytics into performance dashboards, cutting context-switching and accelerating breach containment.
Restraint Impact Analysis
| Restraint | (~) % Impact on CAGR Forecast | Geographic Relevance | Impact Timeline | |||
|---|---|---|---|---|---|---|
High cost and skills gap in AIOps implementation
High cost and skills gap in AIOps implementation
| -2.2% | Global | Short term (≤ 2 years) |
(~) % Impact on CAGR Forecast
:
-2.2%
|
Geographic Relevance
:
Global
|
Impact Timeline
:
Short term (≤ 2 years)
|
Tool sprawl causing data-silo complexity
Tool sprawl causing data-silo complexity
| -1.8% | Asia-Pacific, North America | Short term (≤ 2 years) | |||
Privacy regulations limiting telemetry collection
Privacy regulations limiting telemetry collection
| -1.2% | EU, North America | Medium term (2-4 years) | |||
Economic slowdown delaying IT refresh cycles
Economic slowdown delaying IT refresh cycles
| -1.0% | Global | Short term (≤ 2 years) | |||
| Source: Mordor Intelligence | ||||||
High cost and skills gap in AIOps implementation
Large enterprises can budget for purpose-built data-science teams, but SMEs often lack both funds and talent required for advanced AIOps rollouts. Vendor roadmaps increasingly feature low-code configuration and managed services to ease adoption, yet training costs still weigh on initial ROI. Upskilling programs led by cloud providers are narrowing the gap, though the near-term drag on uptake remains material.
Tool sprawl causing data-silo complexity
Organizations that stitched together point solutions now face sprawling telemetry warehouses, redundant dashboards, and costly integrations. Migrating to unified platforms requires data-model harmonization, tag normalization, and in many cases contract buyouts, all of which elevate switching costs. Consolidation fatigue can slow transformation programs unless vendors offer clear migration blueprints and flexible licensing.
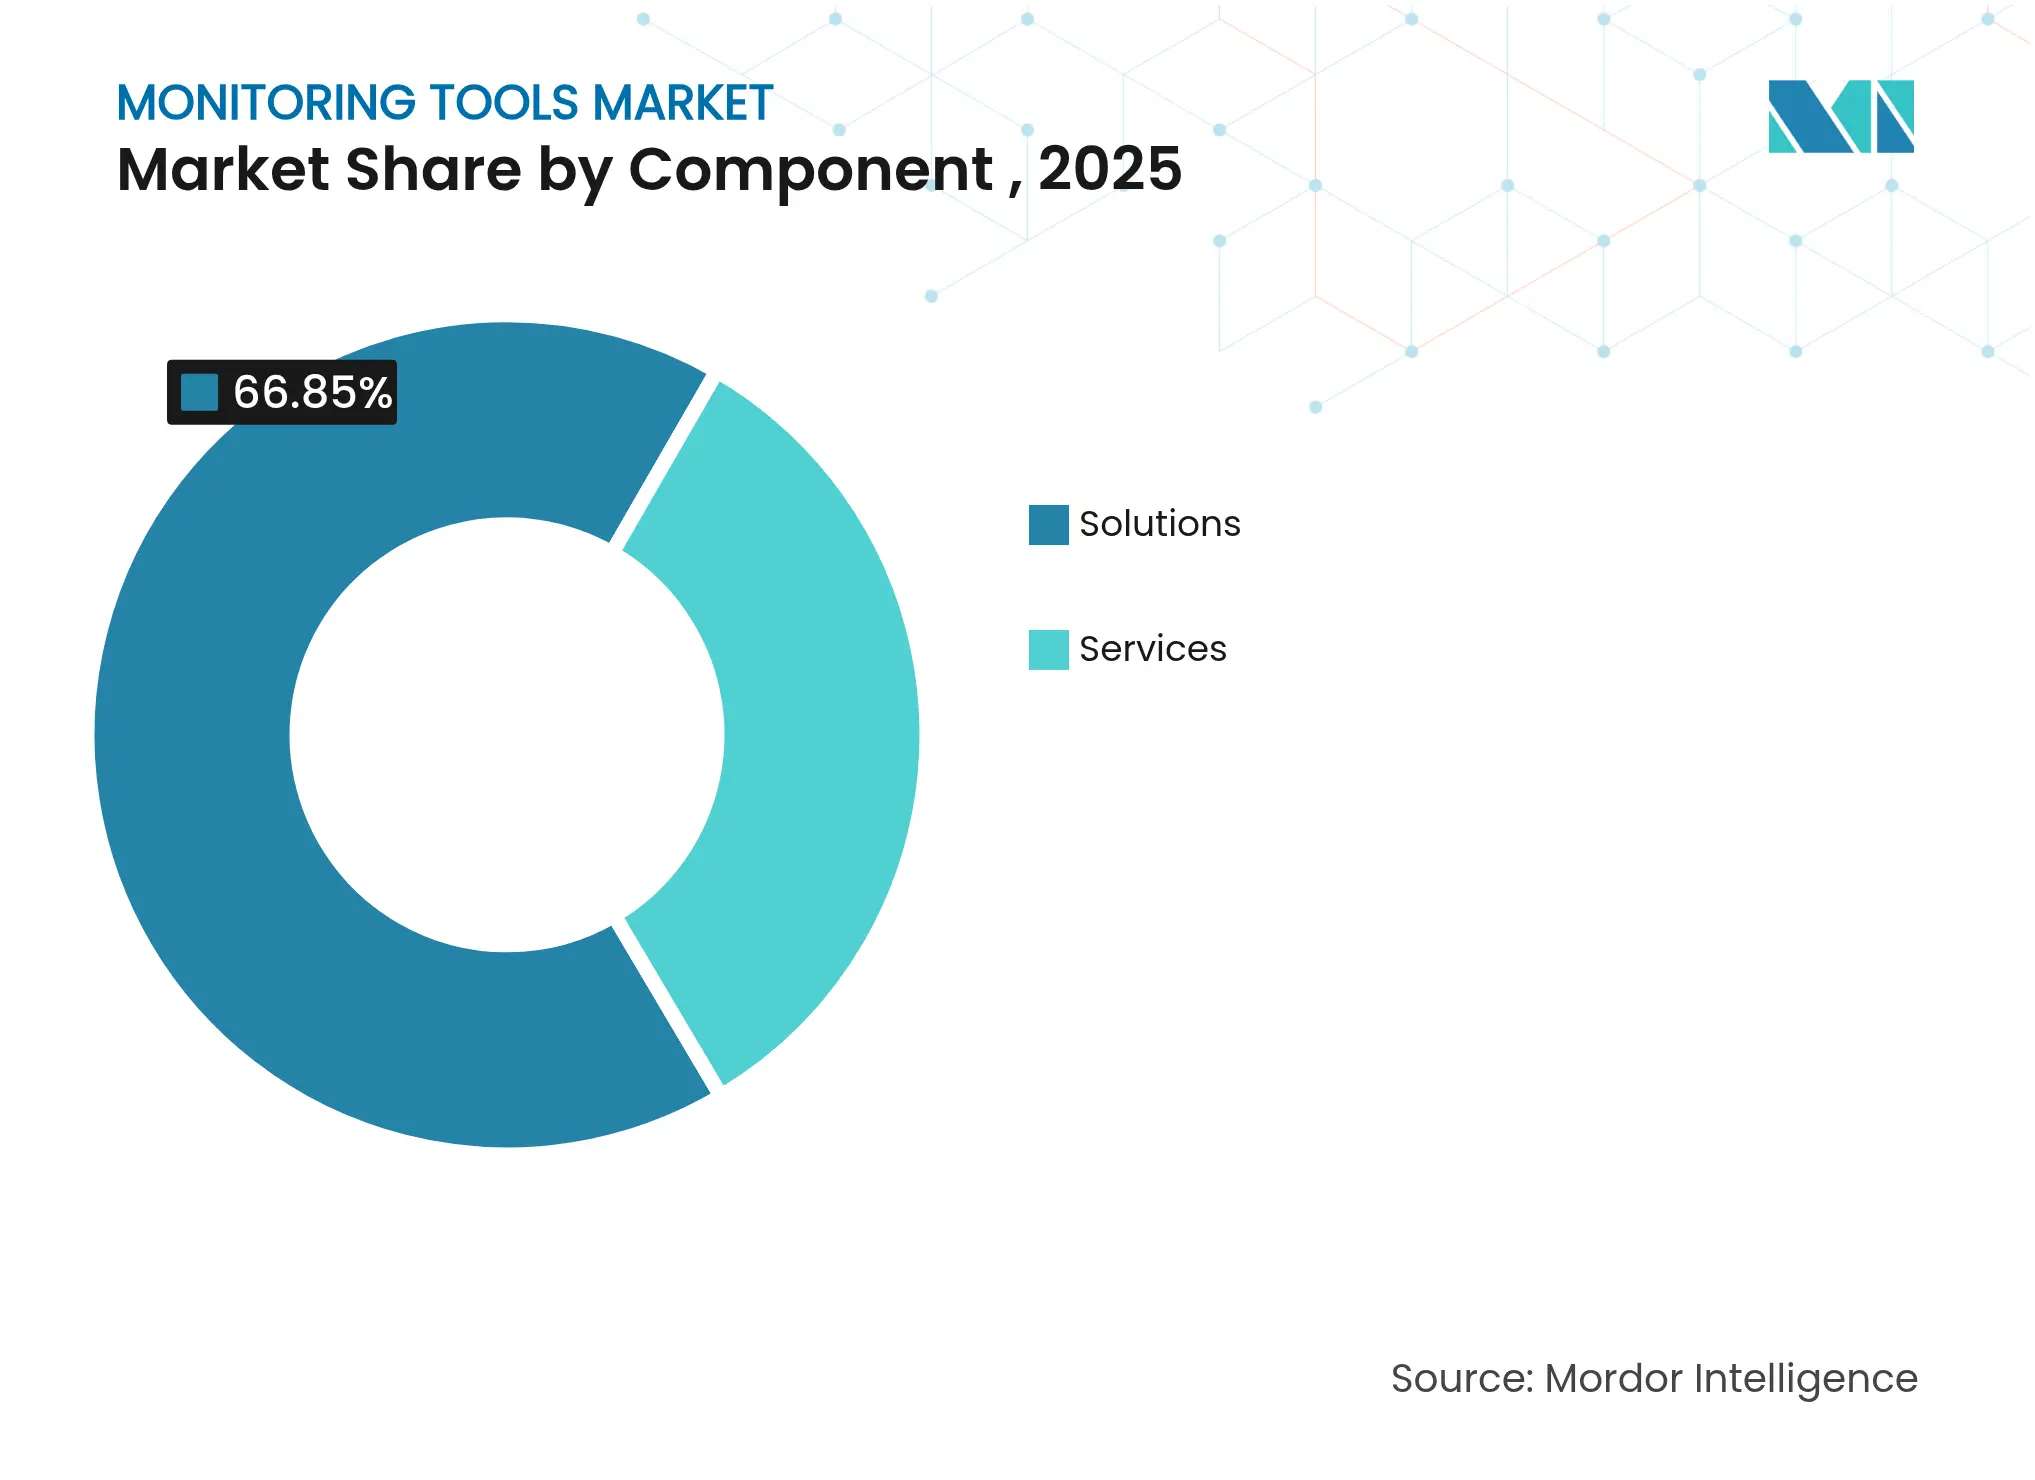
By Component: Services Accelerate as Solutions Mature
The monitoring tools market size for components shows solutions retaining USD 26.06 billion in revenue during 2025, equal to 66.85% of total demand, yet services are forecast to capture a 18.91% CAGR trajectory.
Platform sprawl creates opportunities for service providers that specialize in tool rationalization, AIOps customization, and OpenTelemetry adoption. As automation expands, customers seek domain expertise to refine ML models, tune alert thresholds, and align observability outcomes with business KPIs. Services revenue therefore acts as a multiplier on software spend, reinforcing ecosystem lock-in while raising switching barriers for late-entry competitors.
Note: Segment shares of all individual segments available upon report purchase
By Deployment Mode: Hybrid Surges Amid Cloud Dominance
Cloud SaaS deployments commanded 71.60% of 2025 revenue, yet hybrid uptake is accelerating at 22.7% CAGR, underpinning monitoring tools market size by 2031. Data-sovereignty rules, latency-sensitive workloads, and edge architectures keep on-premises nodes relevant, forcing vendors to support fluid workload placement across cloud, data center, and edge clusters.
Hybrid buyers value consistent pricing, federated data-retention policies, and centralized policy management. AI-driven discovery now maps dependency graphs across estates, shortening troubleshooting cycles regardless of hosting venue. Vendors that bridge public-private boundaries without forcing hardware lock-in stand to win multiyear contracts in sectors such as finance, government, and healthcare.
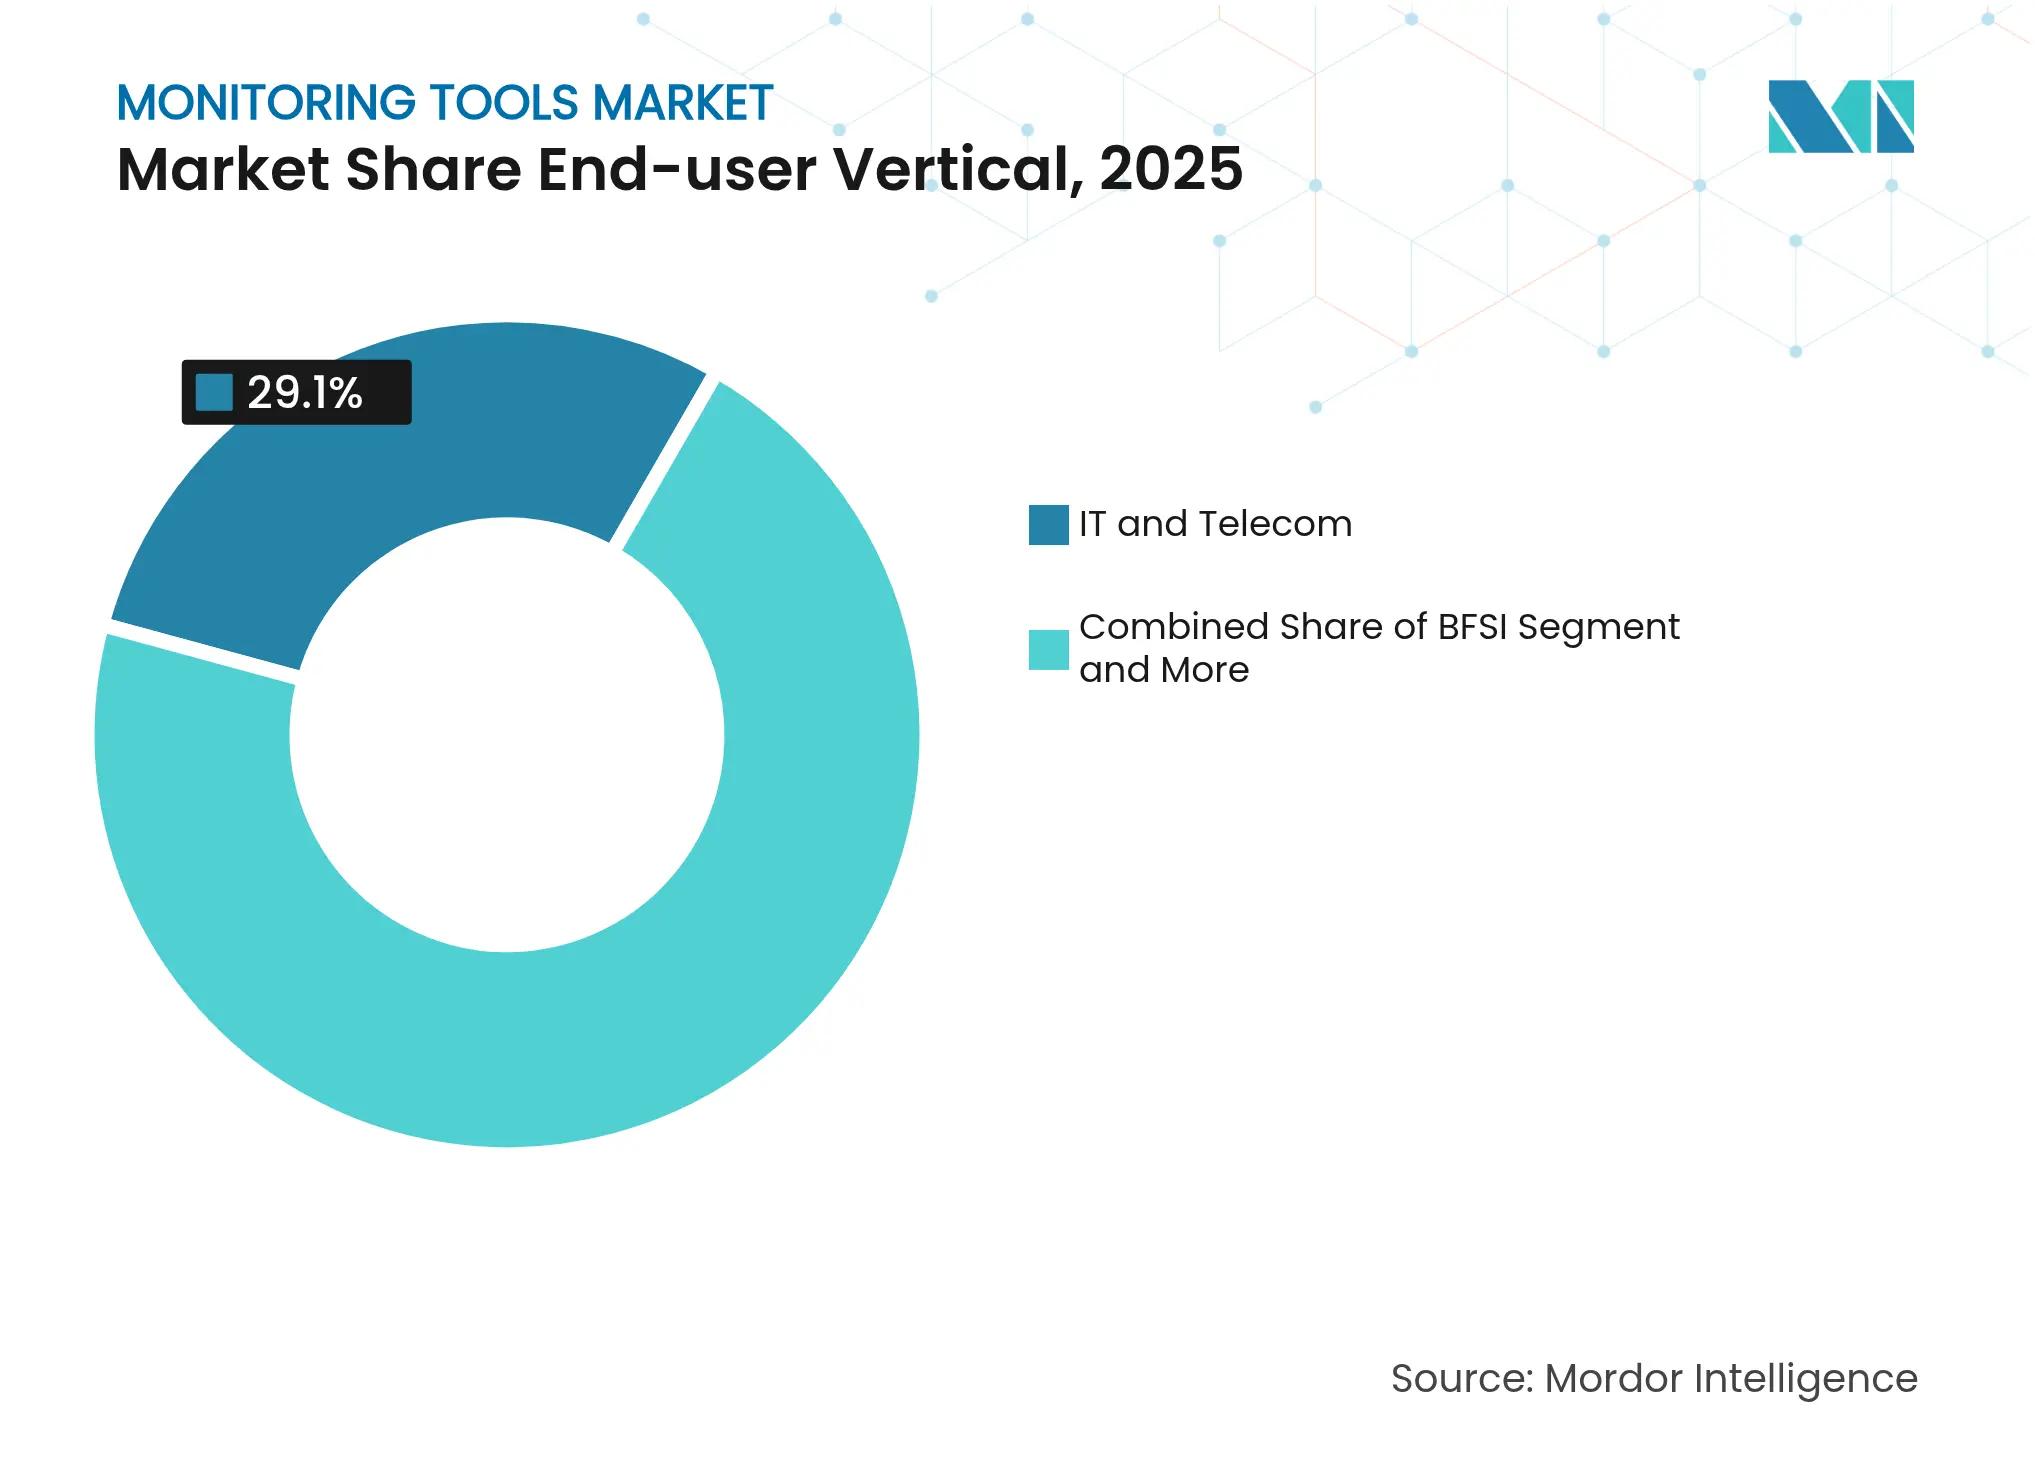
By End-user Vertical: Healthcare Sets the Growth Pace
IT and Telecom held 29.10% of monitoring tools market share in 2025, reflecting complex network topologies and strict uptime SLAs. Healthcare, however, is on a 16.9% CAGR path through 2031 as connected-care, tele-ICU, and digital therapeutics multiply observability points across patient journeys. Regulatory pressures such as HIPAA in the United States and the EU’s General Data Protection Regulation (GDPR) compound the need for real-time visibility and immutable audit trails.
Clinical stakeholders increasingly demand dashboards that correlate infrastructure metrics with patient outcomes, pushing vendors to integrate biomedical device telemetry and electronic health-record analytics. AI-assisted anomaly detection helps preempt equipment failure, reducing adverse-event risk and boosting clinician confidence in digital care pathways.
Note: Segment shares of all individual segments available upon report purchase
By Organization Size: SMEs Narrow the Gap with AI
Large enterprises generated 61.80% of 2025 revenue, yet SMEs will add nearly 17.7% CAGR trajectory. Freemium pricing, serverless data collectors, and prescriptive ML models lower entry hurdles, letting smaller firms deploy enterprise-grade observability without hiring dedicated SRE teams.
SMEs favor pay-as-you-grow subscriptions and automated baselining to sidestep manual threshold tuning. As cloud platforms bake in native telemetry, incremental monitoring costs fall, further democratizing access. The result is a broader market surface area that rewards vendors who streamline onboarding, offer curated dashboards, and minimize total cost of ownership.
North America dominated the monitoring tools market in 2025 with a 38.80% revenue share, thanks to early cloud adoption, mature venture funding, and strict regulatory oversight. Enterprises allocate growing budgets to unify security and observability in response to evolving standards, including CIP-015-1 for internal network security monitoring. Vendor partnerships with hyperscalers and managed-security providers further anchor regional leadership.
Asia-Pacific is projected to deliver the fastest 15.2% CAGR through 2031, expanding the region’s share of overall monitoring tools market size substantially. Mass digitization across China, India, and Southeast Asia, coupled with high tool-sprawl rates, underpins demand for consolidated platforms. Local enterprises are deploying AI to extract business value from telemetry, driven by an expectation that 54% of AI investments will yield measurable ROI within two years.
Europe continues to see solid growth, propelled by GDPR, DORA, and the Cyber Resilience Act, all of which tighten incident-reporting windows and mandate cross-border data portability. Sustainability targets tied to energy-efficient data centers spur investments in granular power-usage telemetry and AI-assisted cooling optimization.
Emerging regions across South America, the Middle East, and Africa are adopting cloud-first monitoring to bridge infrastructure gaps, often via managed services priced in local currencies. Edge-centric use cases in utilities and smart-cities drive incremental demand for lightweight, cost-optimized observability collectors.
Market Concentration
The monitoring tools market is consolidating as vendors pursue scale, cross-domain telemetry, and embedded AI. Cisco closed its USD 28 billion acquisition of Splunk to integrate full-stack observability with network security and automate remediation. Dynatrace deepened its alliance with Amazon Web Services to embed generative-AI powered insights across more than 100 AWS services, expanding reach into born-in-the-cloud workloads[3]Dynatrace, “Dynatrace and AWS Expand Strategic Collaboration,” dynatrace.com.
OpenTelemetry’s maturation accelerates platform interoperability, lowering switching costs and inviting competition from open-source ecosystems. Vendors respond with proprietary AI engines, curated datasets, and pre-built remediation playbooks that elevate differentiation. Patent filings emphasize explainable AI for anomaly detection and cross-domain correlation, underscoring the strategic value of data science talent.
Edge and IoT observability remain underserved, creating openings for specialized scale-ups targeting 5G RAN monitoring, industrial protocols, and environmental-impact dashboards. Meanwhile, private-equity backed roll-ups aim to combine mid-tier niche players into broader suites, betting that unified pricing and contract simplicity will resonate with mid-market buyers. Innovation, therefore, skews toward feature velocity, while Mand A concentrates market power among a shrinking cadre of full-stack leaders.

*Disclaimer: Major Players sorted in no particular order
1. INTRODUCTION
2. RESEARCH METHODOLOGY
3. EXECUTIVE SUMMARY
4. MARKET LANDSCAPE
5. MARKET SIZE AND GROWTH FORECAST (VALUE)
6. COMPETITIVE LANDSCAPE
7. MARKET OPPORTUNITIES AND FUTURE OUTLOOK
Market Definitions and Key Coverage
According to Mordor Intelligence, the monitoring tools market covers packaged software and SaaS platforms that collect, analyze, and visualize telemetry from networks, servers, cloud workloads, databases, applications, logs, and end-user devices in order to alert stakeholders and improve service health. The study counts annual license, subscription, and support revenues earned by vendors across all verticals and geographies.
Scope Exclusion: Standalone antivirus suites and simple uptime ping utilities fall outside this definition.
Segmentation Overview
Detailed Research Methodology and Data Validation
Primary Research
Mordor analysts interviewed DevOps leads, observability architects, managed-service providers, and procurement heads across North America, Europe, and Asia-Pacific. The conversations validated typical agent penetration rates, emerging spend on AI-driven root-cause analytics, and the pace at which on-premise nodes migrate to cloud monitoring consoles, filling gaps left by desk work.
Desk Research
We begin with public sources such as the US Bureau of Labor Statistics' IT spending tables, OECD ICT indicators, NIST cybersecurity guidelines, Cloud Native Computing Foundation reports, and peer-reviewed papers that benchmark telemetry volumes. Company filings, investor decks, and reputable press stories add pricing and adoption clues. Paid databases, including D&B Hoovers for vendor financials and Dow Jones Factiva for deal news, supply hard numbers that free material rarely reveals. These sources illustrate typical deployment counts, regional budget splits, and price ladders; yet the list is only illustrative, as numerous additional references underpin our data stack.
Market-Sizing & Forecasting
The model starts with a top-down rebuild of enterprise software outlays for systems management, then isolates the monitoring slice through telemetry coverage ratios, workload counts, and average subscription fees. Supplier roll-ups, sample license-price-by-instance checks, and channel feedback offer bottom-up reality checks before totals are locked. Key variables, like cloud workload growth, average monitored resources per employee, log-ingest costs per GB, inflation-adjusted SaaS pricing, penetration of AI-assisted analytics, and regional data-residency mandates, drive the forecast. Multivariate regression ties these inputs to historical revenue, while scenario analysis tests upside and downside adoption curves. Data gaps in vendor splits are bridged with weighted imputation anchored to audited financials.
Data Validation & Update Cycle
Outputs pass three-layer variance reviews; anomaly flags trigger fresh calls with sources, and senior analysts sign off only when deviations fall within preset bands. Reports refresh each year; however, if a material event, such as a major vendor merger, occurs, an interim update is released and every client receives the revised baseline.
Why Mordor's Monitoring Tools Baseline Remains the Trustworthy Reference
Benchmark comparison
Industry observers often publish divergent figures because they track different tool classes, convert currencies on varied dates, or extrapolate five-year CAGRs from scant historic points. When we disclose our 2025 baseline of USD 38.97 billion, we also disclose the scope choices and refresh cadence that underpin it, thereby reducing confusion before it starts.
| Market Size | Anonymized source | Primary gap driver | ||
|---|---|---|---|---|
USD 38.97 B (2025) | Mordor Intelligence | - | Anonymized source:Mordor Intelligence | Primary gap driver:- |
USD 24.5 B (2023) | Global Consultancy A | Excludes security monitoring and counts only software, not support services | ||
USD 26.05 B (2022) | Industry Journal B | Uses vendor revenue recognition year, leading to partial double-counting and older FX rates | ||
USD 36.66 B (2024) | Regional Consultancy C | Projects aggressive multi-cloud uptake without adjusting for price compression |
Pricing Strategy for Semiconductor Components
3 Min Read
Accelerating Additive Manufacturing Adoption in India
3 Min Read
When decisions matter, industry leaders turn to our analysts. Let’s talk.