
Technology, Media and Telecom
5th MayPricing Strategy for Semiconductor Components
3 Min Read
The Product Analytics Market Report Segments the Industry Into by Type (Solution [Behavioural Analytics Platforms, and Real-Time and Journey Analytics], and Services [Professional Services, and More]), Deployment (Cloud, On-Premises, and Hybrid), End-User Enterprise Size (SMEs, Large Enterprises), End-User Industry (Retail and E-Commerce, BFSI, and More), and Geography. The Market Forecasts are Provided in Terms of Value (USD).
Market Overview
| Study Period | 2020 - 2031 |
|---|---|
| Market Size (2026) | USD 13.04 Billion |
| Market Size (2031) | USD 25.73 Billion |
| Growth Rate (2026 - 2031) | 14.55 % CAGR |
| Fastest Growing Market | Asia Pacific |
| Largest Market | North America |
| Market Concentration | Medium |
Major Players *Disclaimer: Major Players sorted in no particular order. Image © Mordor Intelligence. Reuse requires attribution under CC BY 4.0. |
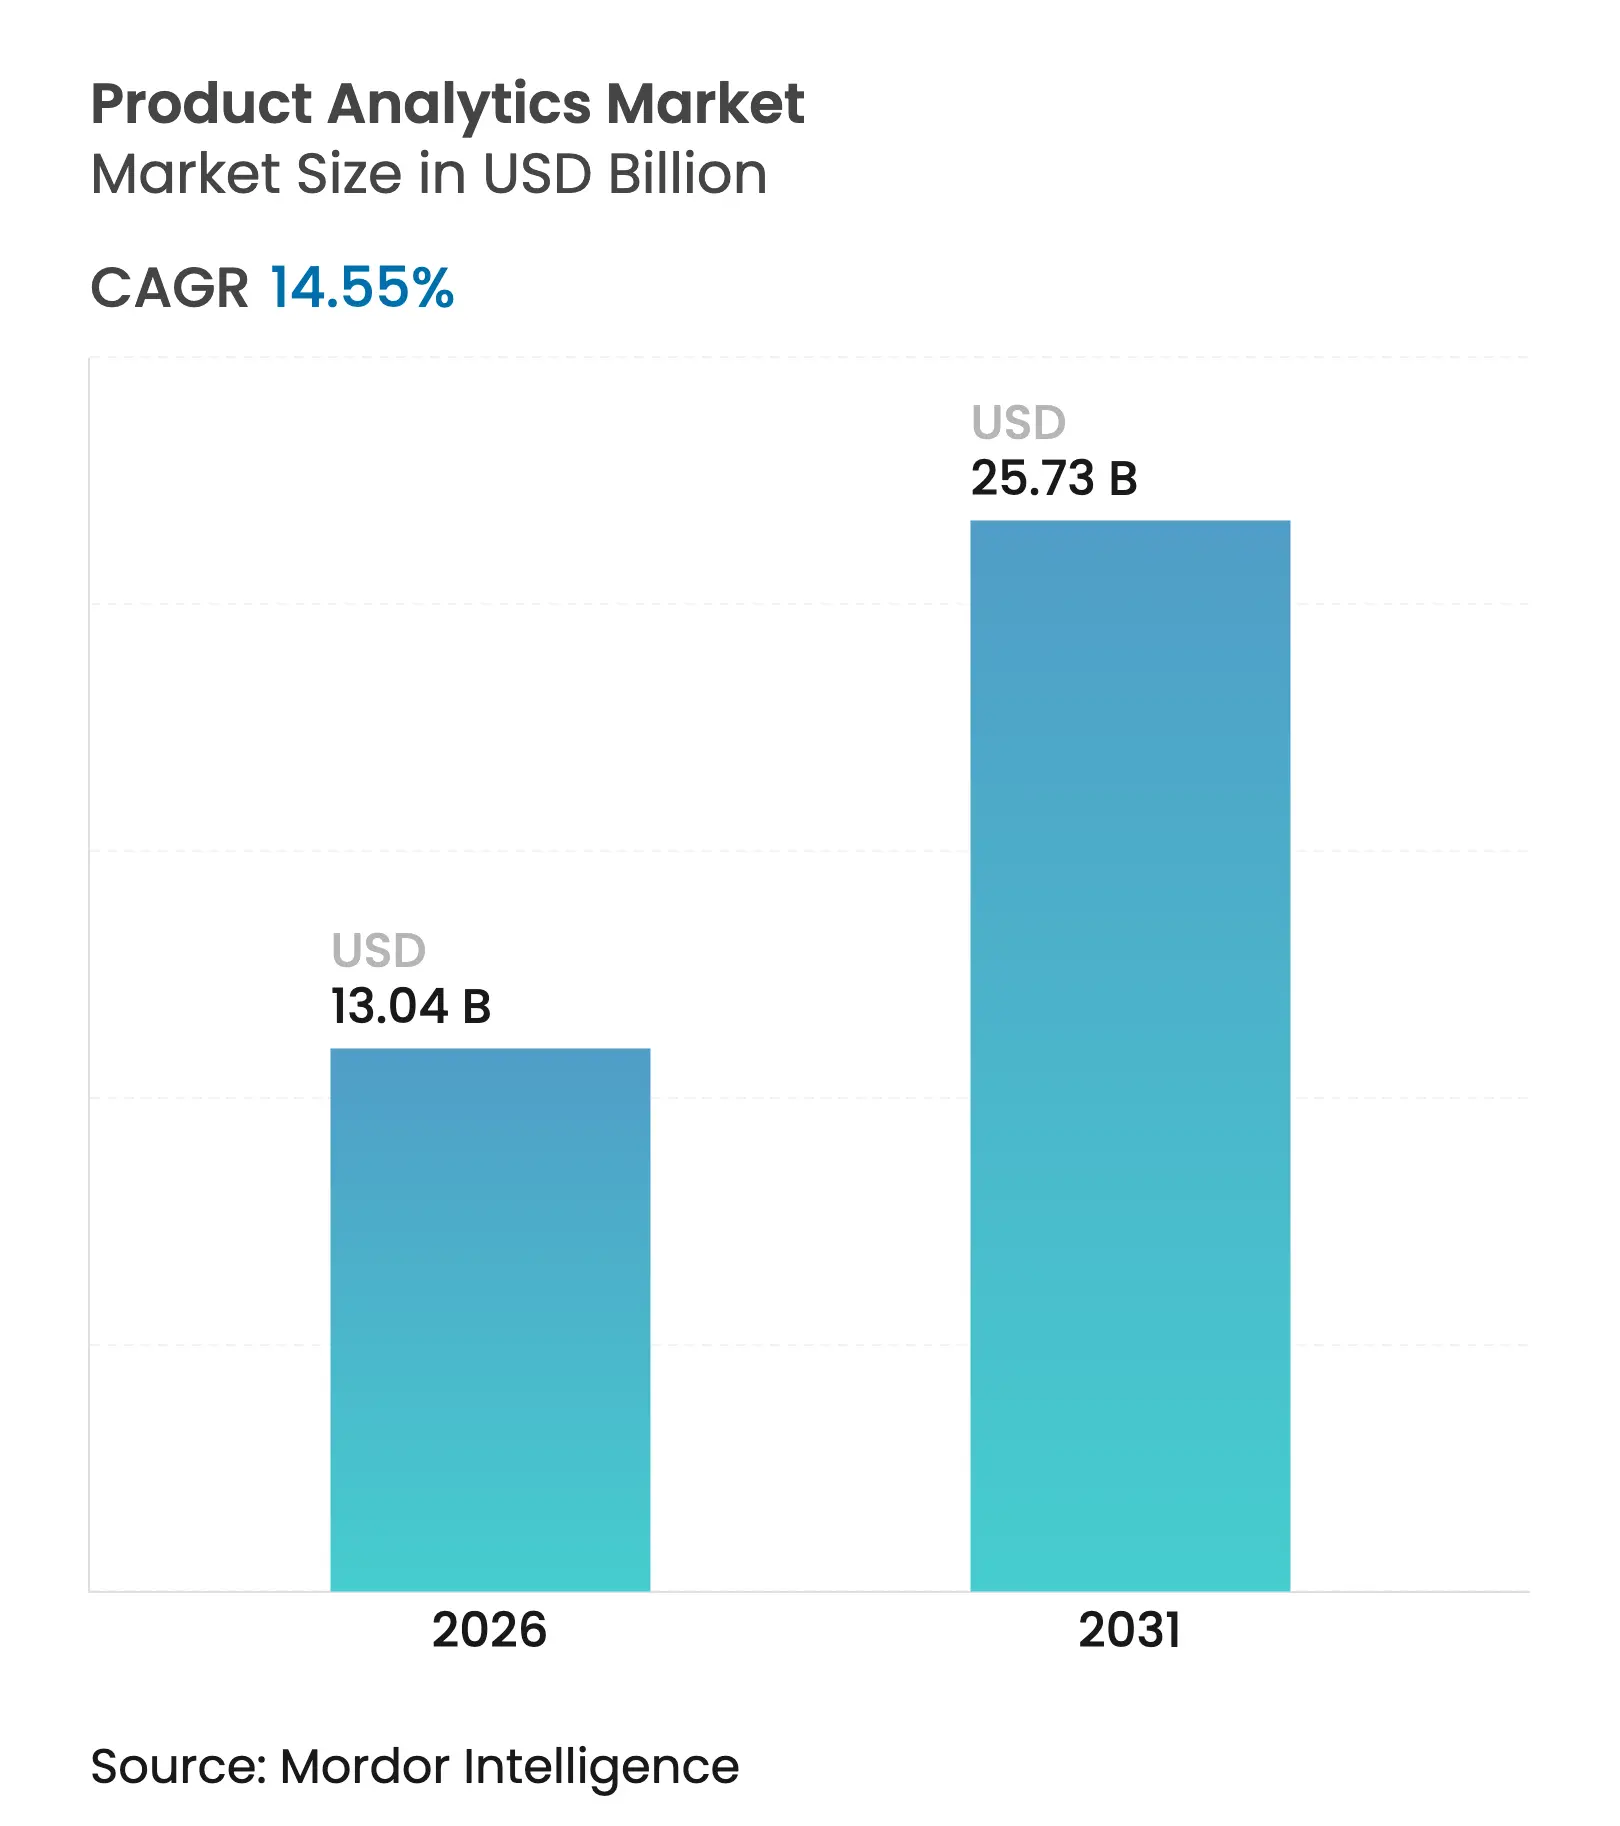
The product analytics market size is expected to grow from USD 11.39 billion in 2025 to USD 13.04 billion in 2026 and is forecast to reach USD 25.73 billion by 2031 at 14.55% CAGR over 2026-2031. Growth remains anchored in three themes: the need to optimize digital products at speed, the cost advantages of cloud-native architectures, and the expanding use of AI to personalize every user interaction. North America holds the largest regional footprint, yet demand is broadening fast in Asia-Pacific as mobile commerce scales. Vendors are prioritizing privacy-centric designs that let teams enrich event streams while complying with tightening rules. Across industries, retail’s early lead is now challenged by healthcare, where analytics is being embedded in care pathways to improve outcomes and reduce waste.
Key Report Takeaways
Note: Market size and forecast figures in this report are generated using Mordor Intelligence's proprietary estimation framework, updated with the latest available data and insights as of 2026.
Drivers Impact Analysis
| Driver | (~) % Impact on CAGR Forecast | Geographic Relevance | Impact Timeline | |||
|---|---|---|---|---|---|---|
Explosion of PLG playbooks
Explosion of PLG playbooks
| +3.7% | Global, focus North America | Medium term (2-4 years) |
(~) % Impact on CAGR Forecast
:
+3.7%
|
Geographic Relevance
:
Global, focus North America
|
Impact Timeline
:
Medium term (2-4 years)
|
Rapid e-commerce and m-commerce expansion
Rapid e-commerce and m-commerce expansion
| +3.0% | Global, high in Asia-Pacific | Short term (≤2 years) | |||
Cloud-native analytics cost advantages
Cloud-native analytics cost advantages
| +2.7% | Global | Medium term (2-4 years) | |||
Adoption of in-product experimentation and feature flags
Adoption of in-product experimentation and feature flags
| +2.2% | North America and Europe | Short term (≤2 years) | |||
Privacy-safe event-stream enrichment via edge workers
Privacy-safe event-stream enrichment via edge workers
| +1.5% | Europe and North America | Medium term (2-4 years) | |||
Synthetic data to bypass GDPR consent fatigue
Synthetic data to bypass GDPR consent fatigue
| +1.2% | Europe plus spillover | Long term (≥4 years) | |||
| Source: Mordor Intelligence | ||||||
Explosion of PLG playbooks
Product-led growth is turning the product itself into the main acquisition engine. Freemium and free-trial funnels depend on behavioural telemetry that pinpoints what moves users from basic engagement to paid seats. Sales teams link usage flags to renewal forecasts, while marketing teams refine onboarding to raise day-one activation. High-growth vendors that codified PLG early report meaningfully lower customer-acquisition costs than peers, a pattern now pushing late adopters to overhaul their own playbooks [1] Invoca, “Data-Driven Marketing Trends for 2025,” invoca.com. As a result, demand for deeper cohort segmentation and touch-point mapping is broadening beyond pure-play software into banking, media, and manufacturing.
Rapid e-commerce and m-commerce expansion
Mobile devices now represent most first-touch shopping sessions in Asia-Pacific. Digital merchants deploy real-time pipelines to surface micro-intent signals—scroll velocity, pinch-zoom patterns, or checkout dwelling time—feeding AI recommenders that predict next-best-action with high precision. Consumers increasingly expect each screen to reflect past preferences, with 41% already demanding personalisation based on prior behaviour. Retailers that meet the bar see higher basket sizes and revisit rates, reinforcing funding for event-capture instrumentation. Competitive intensity forces even mid-tier brands to buy enterprise-grade stacks, extending the product analytics market into geographies that previously lagged digital adoption.
Cloud-native analytics cost advantages
Serverless compute, containerised micro-services, and managed storage tiers have cut total ownership costs by up to 30% relative to traditional setups [2]InspiringApps, “Top Reasons to Choose Cloud Computing: A 2025 Perspective,” inspiringapps.com. Companies routinely spin clusters up or down within minutes, while automated scaling avoids both noisy-neighbour bottlenecks and under-utilised capacity. Integration with adjacent cloud services—message queues, function-as-a-service, data-governance APIs—creates a network effect that locks in workloads. Early scepticism about security has eased as providers rolled out confidential-computing enclaves and regional data pods that satisfy sovereignty regulations. Cost savings therefore combine with agility to keep the product analytics market on an accelerated trajectory.
Adoption of in-product experimentation and feature flags
Feature-flag systems now let product managers toggle capabilities for specific cohorts without code redeploys, enabling granular A/B tests and phased rollouts. When analytics dashboards show negative sentiment or usage dips, teams can throttle back instantly, limiting exposure. European and North American SaaS pioneers document release cadences that shortened from monthly to weekly, driving faster value capture. Coupling flags with behavioural funnels creates an always-on feedback loop, letting engineers refine performance, UX copy, or pricing placements. These practices are migrating into non-tech sectors as DevOps mind-sets spread, further enlarging the product analytics market footprint.
Restraints Impact Analysis
| Restraint | (~) % Impact on CAGR Forecast | Geographic Relevance | Impact Timeline | |||
|---|---|---|---|---|---|---|
Rising implementation and training costs
Rising implementation and training costs
| -2.2% | Global | Medium term (2-4 years) |
(~) % Impact on CAGR Forecast
:
-2.2%
|
Geographic Relevance
:
Global
|
Impact Timeline
:
Medium term (2-4 years)
|
Tightening data-privacy regulations
Tightening data-privacy regulations
| -1.8% | Europe, North America, Brazil | Short term (≤2 years) | |||
Browser tracking-prevention APIs throttle event fidelity
Browser tracking-prevention APIs throttle event fidelity
| -1.5% | Global | Short term (≤2 years) | |||
Fragmented event schemas across channels raise integration
costs
Fragmented event schemas across channels raise integration
costs
| -1.2% | Global | Medium term (2-4 years) | |||
| Source: Mordor Intelligence | ||||||
Rising implementation and training costs
Sophisticated analytics stacks cover ingestion, identity resolution, modelling, and change management. That breadth requires scarce skill sets, pushing service-day rates upward in nearly every region. SMEs face the steepest hurdles: maintenance expenses represent 40% of digital-tool budgets and lack of training time blocks adoption in 39% of cases. Vendors are responding with template-based playbooks and AI assistants that automate query writing, yet the learning curve still slows expansion when capital is constrained.
Tightening data-privacy regulations
GDPR, CPRA, and Brazil’s LGPD impose explicit-consent, minimal-retention, and transparency rules. Penalties reach 4% of global annual turnover, so boards allocate material legal review cycles before green-lighting new instrumentation. SDK providers are shifting towards edge anonymisation and differential-privacy transforms, but these features add complexity and cost, lowering short-term ROI. Marketing teams accustomed to granular personalisation must now re-engineer journeys around aggregate signals, occasionally diluting effectiveness.
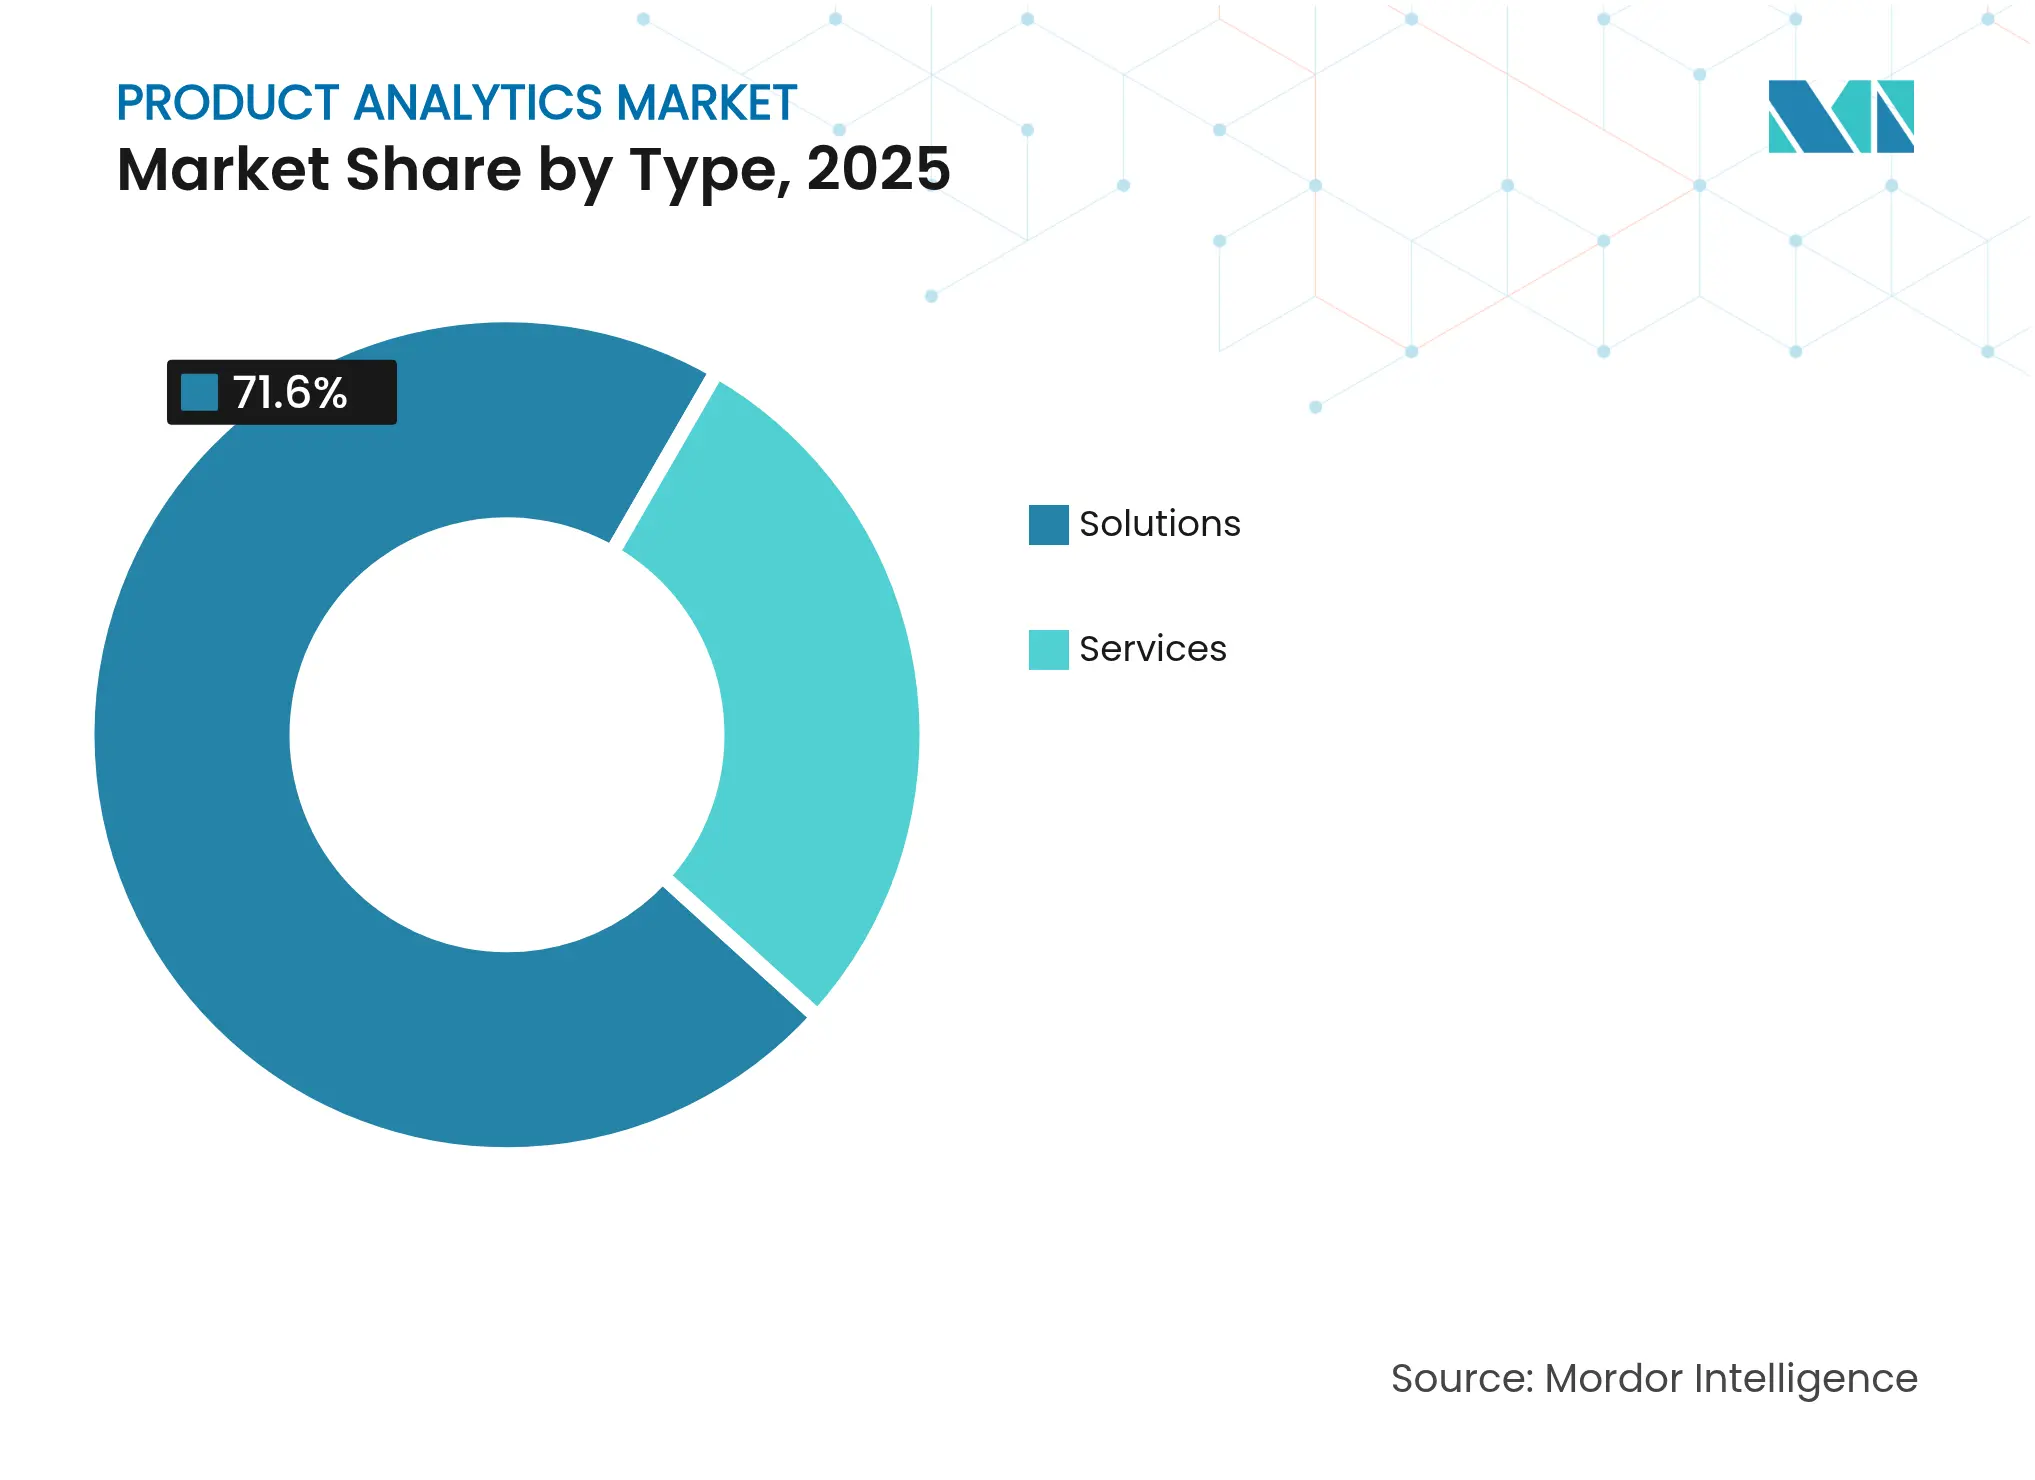
By Type: Services Outpace Solutions in Growth
Solutions captured 71.60% of 2025 revenue because out-of-the-box dashboards, journey mapping, and retention scoring let teams start measuring within days. Behavioural platforms record click-stream events, surface power-user cohorts, and signal churn risk without extensive custom coding. Real-time journey modules overlay path discovery across web, mobile, and in-product flows, flagging friction points that slow conversion. Those capabilities form the backbone of data-driven product decisions in large enterprises that cannot risk downtime.
Yet services revenue will grow at 18.30% CAGR—faster than the wider product analytics market—because no two implementations share identical business questions or data taxonomies. Professional-services teams align event names with OKRs, design statistical frameworks, and craft governance models that survive staff turnover. Managed-services vendors then shield clients from version updates, schema migrations, and evolving compliance rules, delivering “insights-as-a-service.” Organisations that outsource these tasks often see quicker time-to-value than peers leaning solely on internal data engineers, further motivating spending.
Note: Segment shares of all individual segments available upon report purchase
By Deployment Model: Cloud Dominance Accelerates
The cloud model held 87.60% share in 2025, a figure expected to rise as on-prem nodes approach end-of-life cycles. Serverless ingestion engines can elastically process spike traffic during campaign launches, then auto-scale back, saving budget in quieter hours. Multi-tenant architectures also simplify continuous feature delivery, letting vendors push improvements weekly rather than bundling them into major releases. These traits explain why cloud deployments grow at 16.95% CAGR, well ahead of legacy alternatives.
On-premise remains relevant for banks or governments with strict in-house key management, yet the balance tilts toward cloud whenever regulators clarify acceptable encryption standards. Hybrid setups fill the gap: sensitive identifiers stay inside private data-centres while behavioural aggregates move to the cloud for heavy-duty compute. With each compliance milestone achieved, procurement officers grow more comfortable signing multi-year cloud deals, reinforcing the product analytics market’s cloud-first trajectory.
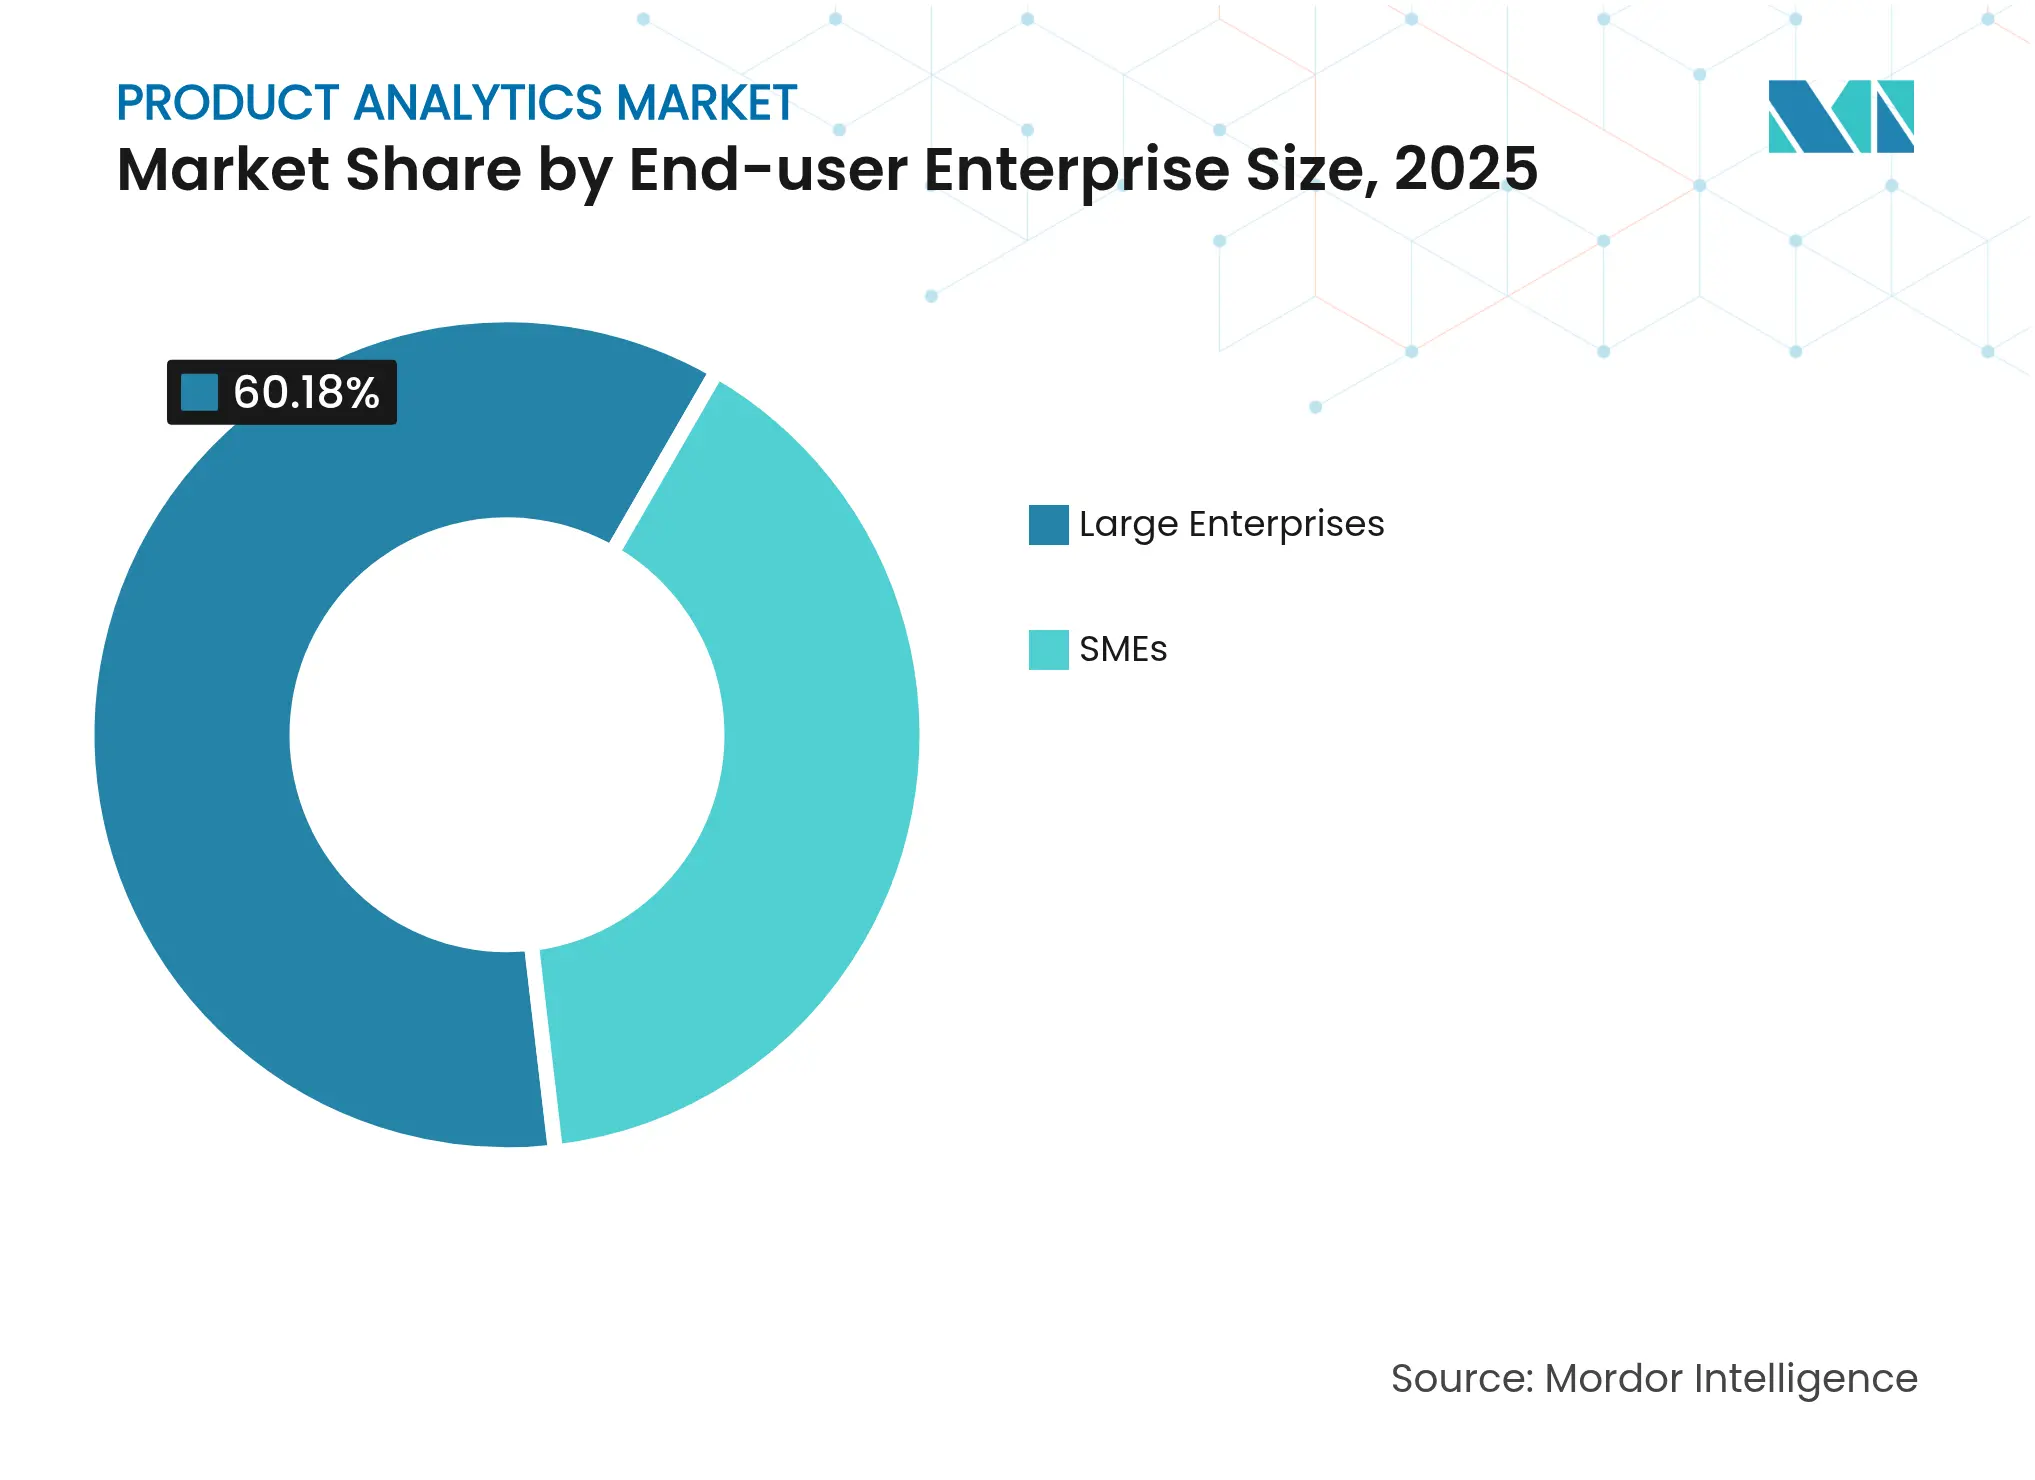
By End-user Enterprise Size: SMEs Driving Future Growth
Large enterprises commanded 60.18% of 2025 spending, mirroring their broader digital budgets and need to orchestrate insights across dozens of product lines. They embed analytics outputs into demand-planning, pricing, and success-team dashboards, turning behavioural signals into cross-functional levers. Dedicated data-science pods fine-tune propensity models, raising upsell rates and extending customer lifetimes.
SMEs, however, are set for 19.70% CAGR, doubling the overall product analytics market pace. Democratised SaaS offers intuitive point-and-click schema creation and AI copilots that draft queries in plain English. The share of SMEs using AI tools climbed to 39% in 2025, up from 26% in 2024 . Low-code connectors integrate Shopify, Stripe, and HubSpot in minutes, making enterprise-grade telemetry feasible despite limited headcount. Flexible seat-based pricing lets founders add analysts only when volume justifies the cost, protecting runway.
Note: Segment shares of all individual segments available upon report purchase
By End-user Industry: Healthcare Disrupts Retail Dominance
Retail and e-commerce held 29.40% of 2025 turnover, fuelled by accelerating online sales and the need to personalise every click. Merchants leverage basket-analysis models, discount elasticity curves, and attribution funnels to chase incremental margin. Omnichannel stitching unifies POS, mobile-app, and social-commerce events, giving merchandisers one view of intent. As experience-led competitors erode loyalty, retailers double down on predictive replenishment, targeted promotions, and behavioural segmentation.
Healthcare and life sciences is projected to climb at 21.00% CAGR, signalling a pending mix shift in the product analytics market. Telehealth platforms track engagement moments—appointment scheduling, vitals capture, follow-up adherence—to intervene before clinical goals slip. Hospitals mine portal click-paths to spot communication drop-offs that precede readmissions. Pharma companies apply companion-app telemetry to measure patient compliance, linking product usage to real-world efficacy. Privacy mandates remain strict, yet de-identification protocols and synthetic datasets are unlocking safe analysis at scale, allowing providers to capture value while protecting sensitive information.
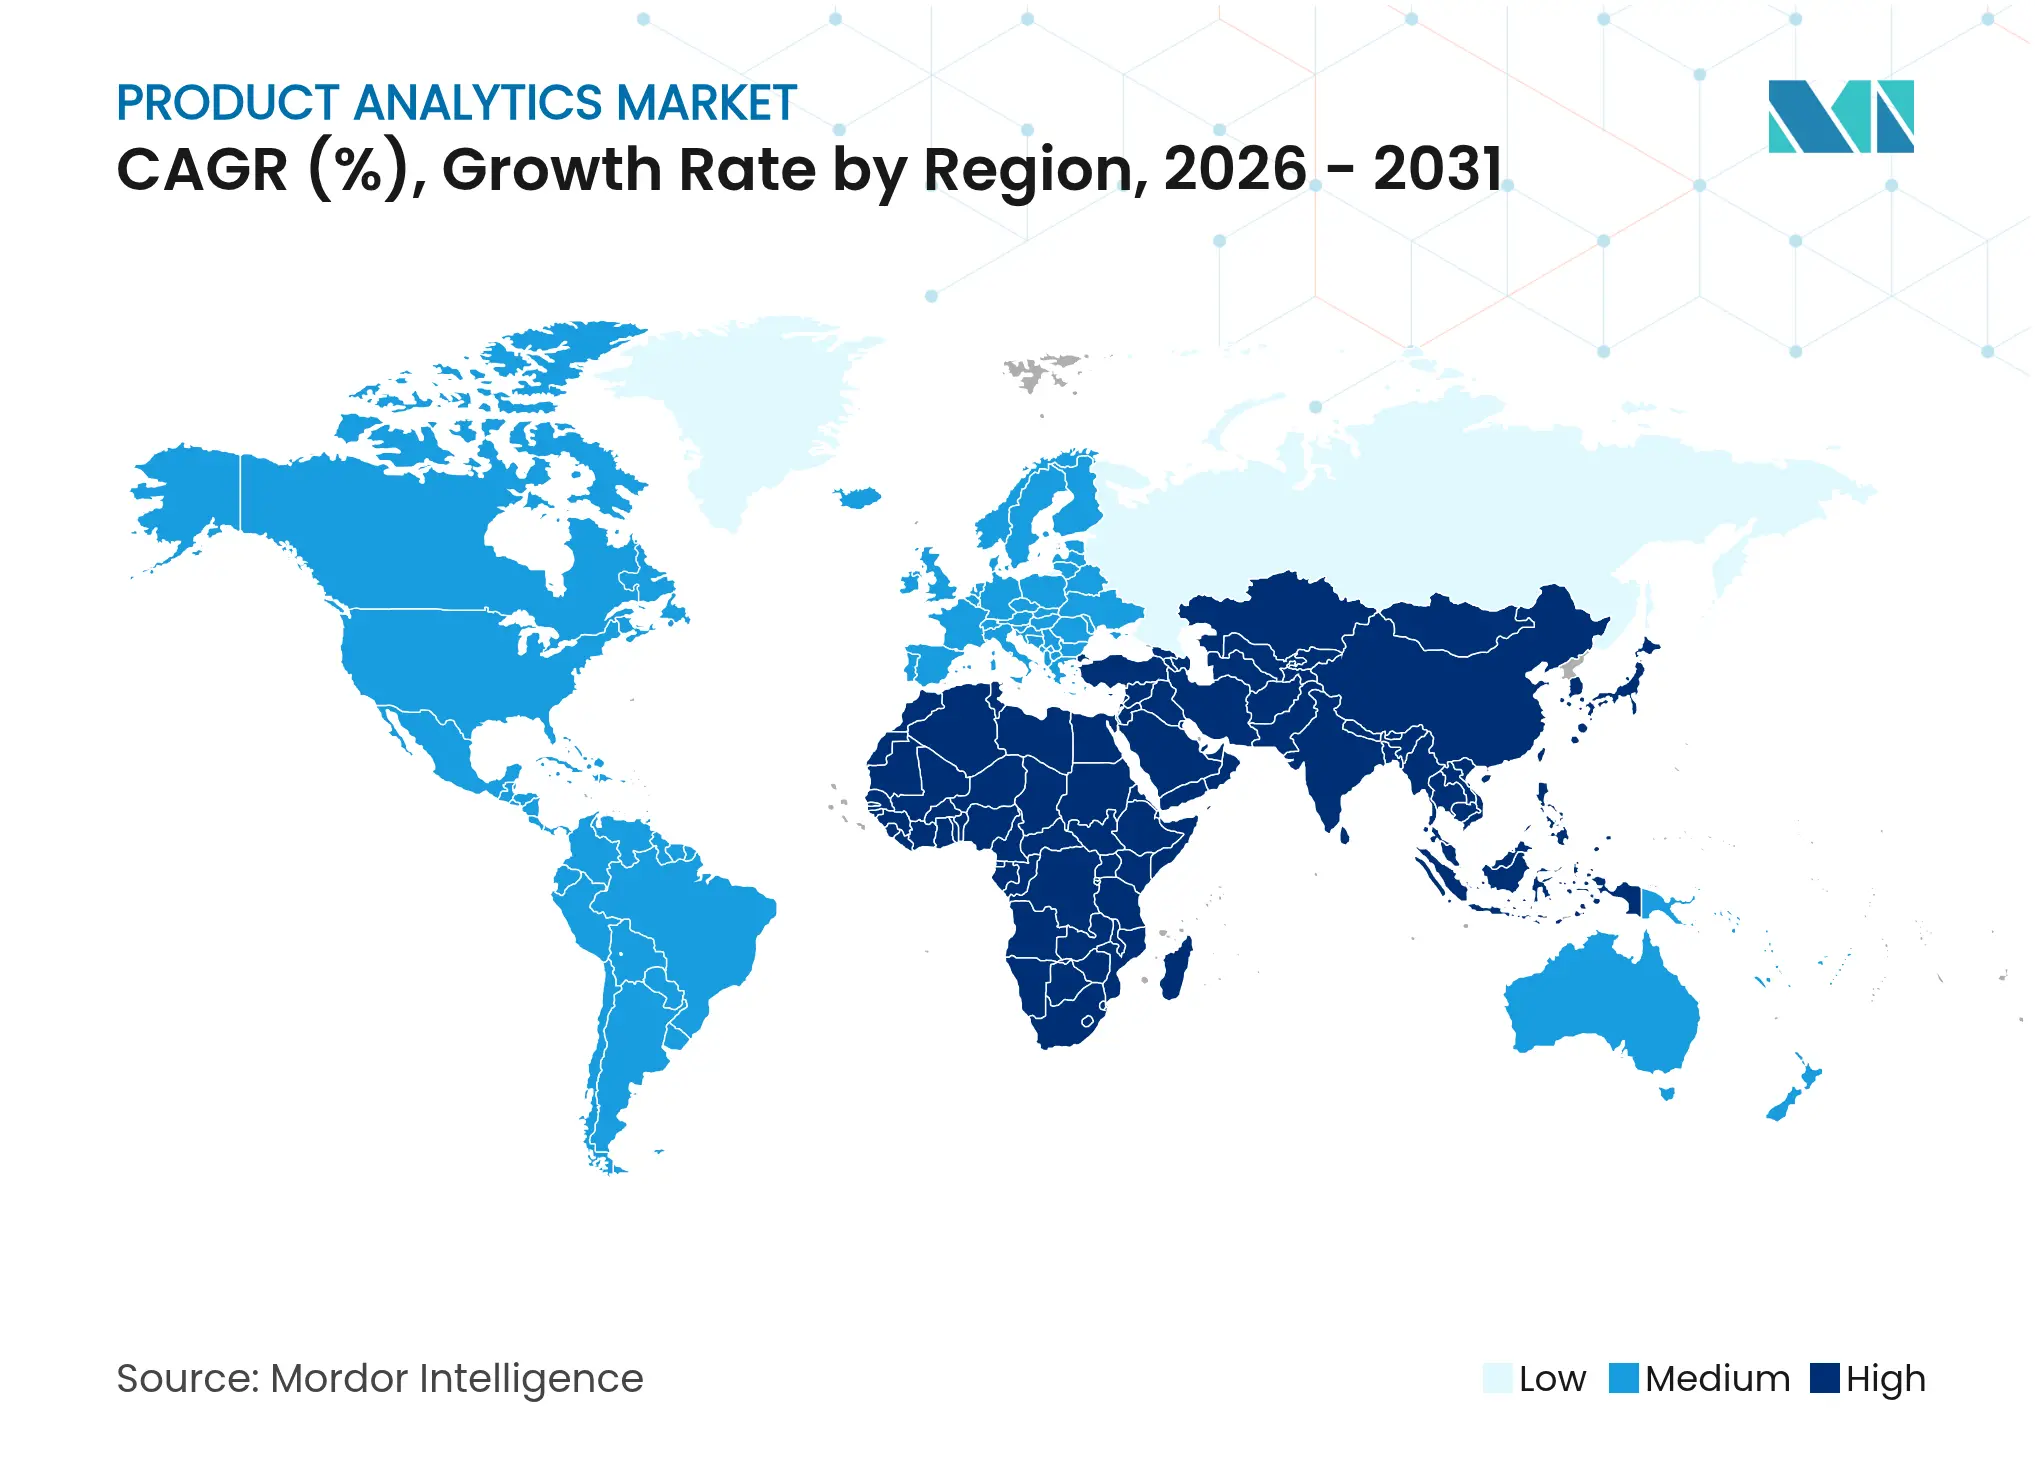
North America retained 42.35% of 2025 revenue. The United States anchors vendor roadmaps: hyperscalers funnel R and D into AI copilots that compile queries, streamline model selection, and automate root-cause exploration. IBM reports that pairing AI with existing infrastructure can triple project success rates when executed correctly. Canada’s public cloud adoption lags the United States by only a few quarters and is closing fast, driven by fintech and media firms that rely on product analytics to monetise audience segments. Mexico’s fintech and retail start-up ecosystems are small but high-growth, feeding consistent demand for mid-market licences.
Asia-Pacific posts the highest expansion rate at 20.40% CAGR. China’s e-commerce giants ingest petabytes of clickstream daily, necessitating ultra-low-latency data fabric. India has become a hub for open-source analytics maintainers, catalysing community-driven innovation. Japan and South Korea lean heavily on analytics to differentiate in mature, high-expectation consumer markets. Southeast Asian governments prioritise digital-economy blueprints, offering grants that subsidise analytics adoption among SMEs, further widening the addressable user base of the product analytics market.
Europe remains a substantive revenue block and a regulatory bellwether. Organisations there insist on privacy-safe design out of the gate, pushing suppliers to integrate differential-privacy tooling and region-locked storage. The United Kingdom, Germany, and France lead in absolute spend, but Scandinavian firms rank among the highest in per-capita event volumes due to tech-savvy populations. Monetary-policy easing and modest inflation relief are forecast to lift discretionary consumer spend, creating fresh datasets for analytics engines to process . Start-ups in Benelux and the Baltics often choose open-source stacks coupled with feature-flag SaaS, illustrating the region’s appetite for flexible, compliance-ready solutions.
Market Concentration
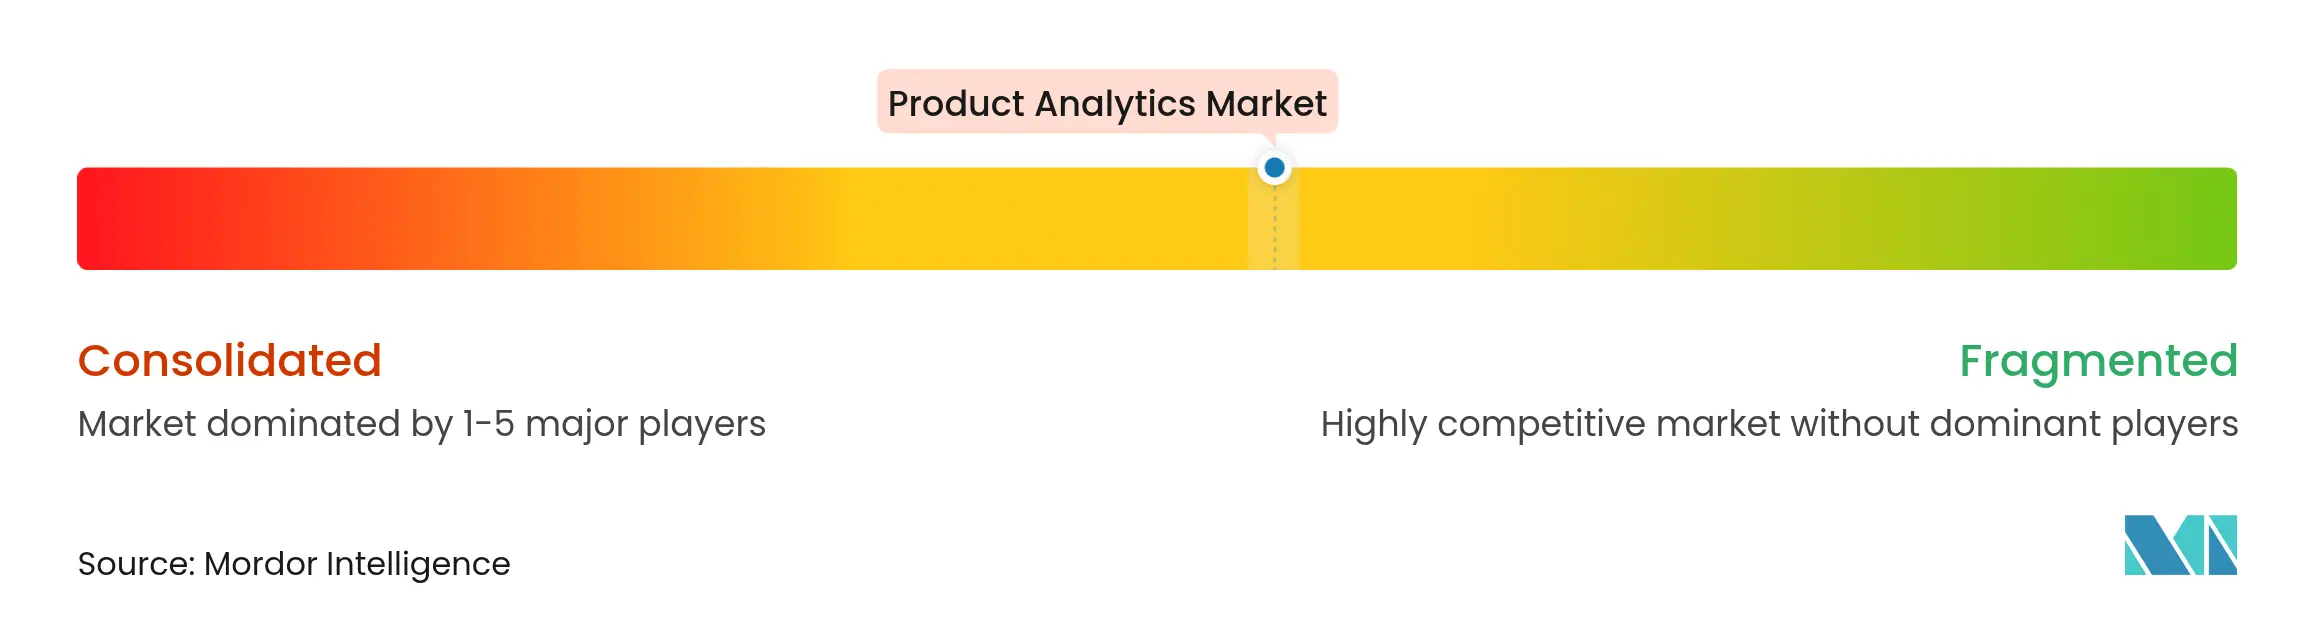
The product analytics market shows moderate fragmentation. No single vendor exceeds one-quarter of global revenue, yet scale economies matter, giving suite providers an ability to out-invest in AI tooling. Leading cloud hyperscalers bundle analytics with broader data-warehouse or observability offerings, while pure-plays carve niches in behavioural depth, retroactive querying, or visual in-app guidance. Competitive intensity rose sharply in 2025 after Datadog acquired Eppo, marrying observability data with experimentation workflows. That deal spurred similar moves among rivals seeking to fuse monitoring, flagging, and product-usage analytics under one pane.
Challenger vendors prioritise ergonomic design. PostHog and Heap deliver retroactive capture that allows analysts to query fields they forgot to tag months earlier, an advantage over session-based rivals. Pendo emphasises integrated feedback widgets and walk-through guidance, connecting insight and action in one loop. Google Cloud extends BigQuery with autonomous data-foundation components that unify structured and unstructured sources, slashing schema-engineering time. Each differentiator meets specific buyer pain points—speed to insight, governance simplicity, or cross-functional collaboration—driving healthy multi-vendor competition.
Strategic partnerships flourish as well. ThoughtSpot deep-linked its Agentic Analytics platform into Snowflake so joint customers avoid ETL overhead and pay via marketplace credits—a model that resonates with procurement teams keen on simplified billing. Healthcare analytics specialists team with electronic-health-record vendors to pre-schema clinical events, giving providers turnkey compliance. Across the board, alliances augment R and D capacity, broaden go-to-market reach, and accelerate joint-feature rollouts, sustaining the dynamism that characterises the product analytics market.

*Disclaimer: Major Players sorted in no particular order
1. INTRODUCTION
2. RESEARCH METHODOLOGY
3. EXECUTIVE SUMMARY
4. MARKET LANDSCAPE
5. MARKET SIZE AND GROWTH FORECASTS (VALUE)
6. COMPETITIVE LANDSCAPE
7. MARKET OPPORTUNITIES AND FUTURE TRENDS
Market Definitions and Key Coverage
Segmentation Overview
Detailed Research Methodology and Data Validation
Primary Research
Desk Research
Market-Sizing & Forecasting
Data Validation & Update Cycle
Why Mordor's Product Analytics Baseline Commands Reliability
Benchmark comparison
| Market Size | Anonymized source | Primary gap driver | ||
|---|---|---|---|---|
USD 11.39 B (2025) | Mordor Intelligence | Anonymized source:Mordor Intelligence | Primary gap driver: | |
USD 19.92 B (2024) | Global Consultancy A | Bundles broader behavioral-analytics platforms and assumes early universal subscription uptake | ||
USD 9.09 B (2024) | Trade Journal B | Excludes professional-services revenue and applies conservative SME-adoption weights |
Pricing Strategy for Semiconductor Components
3 Min Read
Accelerating Additive Manufacturing Adoption in India
3 Min Read
Unlocking Growth in India’s Luxury Beauty & Skincare Market
3 Min Read
When decisions matter, industry leaders turn to our analysts. Let’s talk.