Product Carbon Footprint (PCF) Software Market Size and Share
Market Overview
| Study Period | 2020 - 2031 |
|---|---|
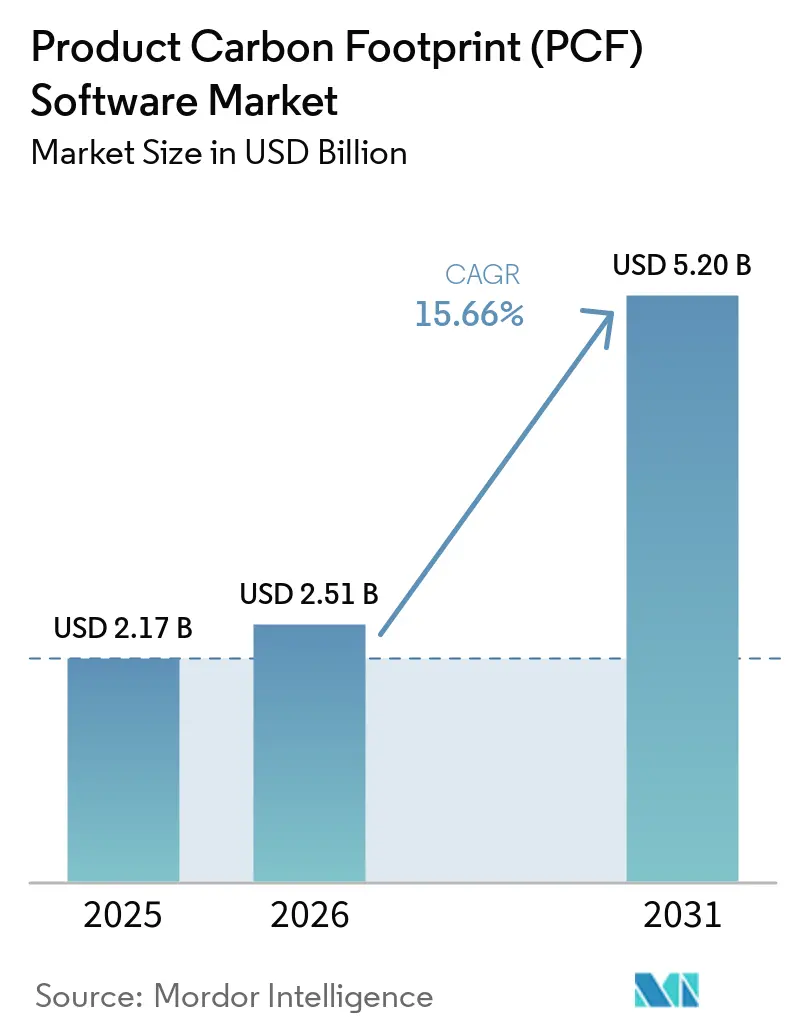
| Market Size (2026) | USD 2.51 Billion |
| Market Size (2031) | USD 5.20 Billion |
| Growth Rate (2026 - 2031) | 15.66% CAGR |
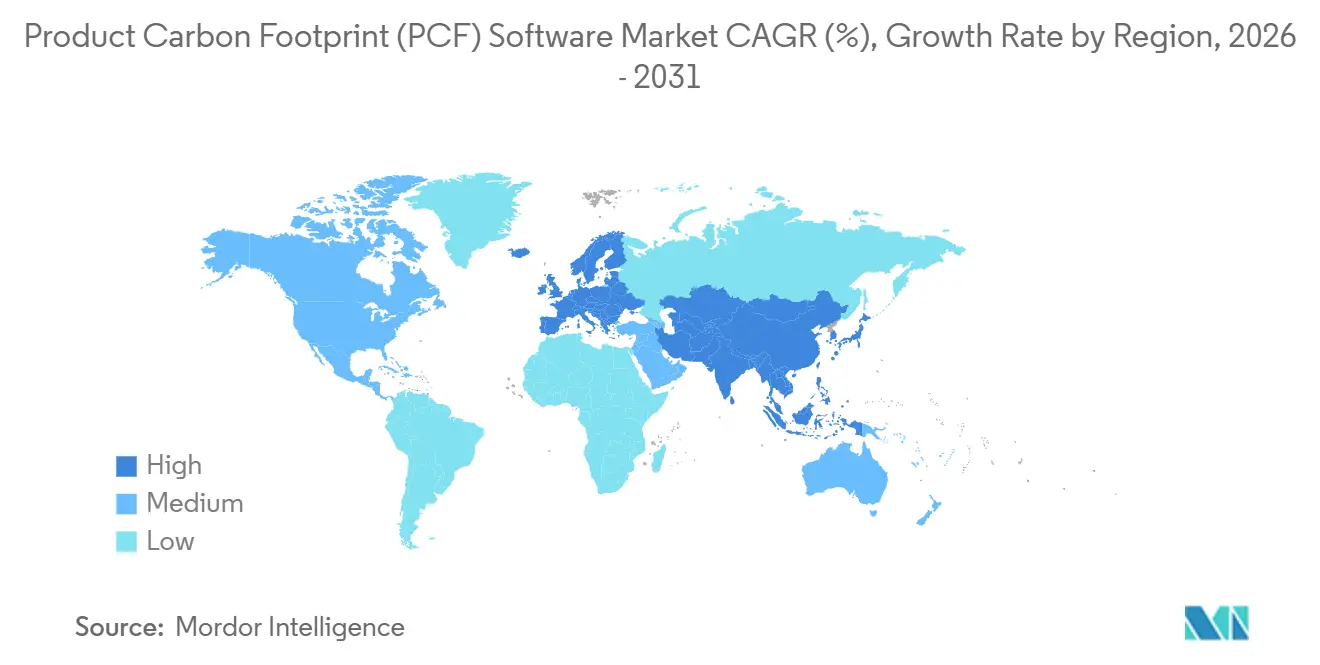
| Fastest Growing Market | Asia-Pacific |
| Largest Market | Europe |
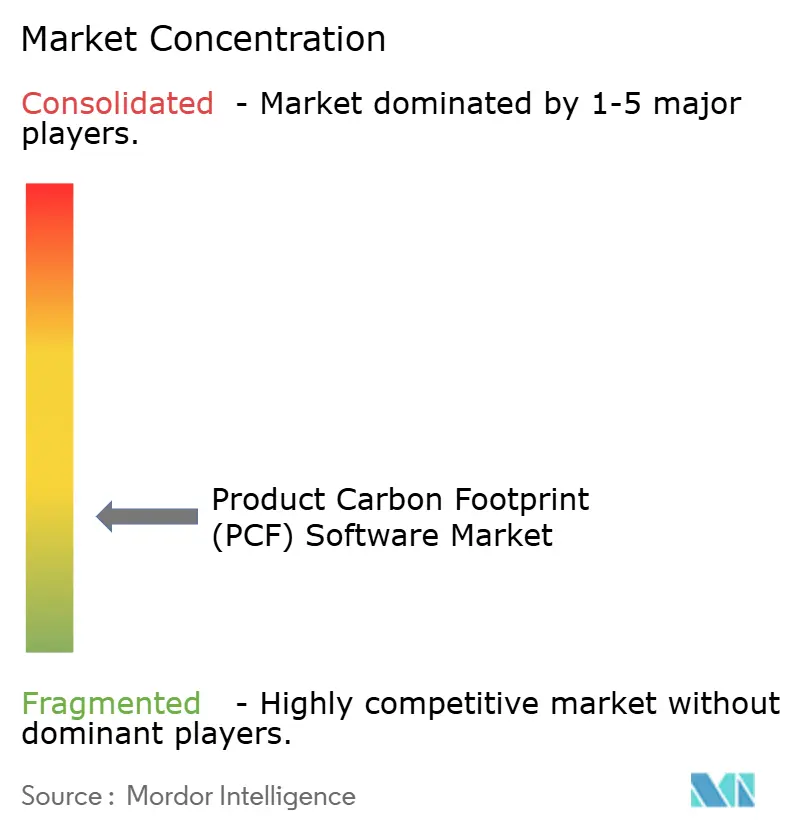
| Market Concentration | Low |
Major Players *Disclaimer: Major Players sorted in no particular order Image © Mordor Intelligence. Reuse requires attribution under CC BY 4.0. | |
Product Carbon Footprint (PCF) Software Market Analysis by Mordor Intelligence
The product carbon footprint (PCF) software market size is projected to expand from USD 2.17 billion in 2025 and USD 2.51 billion in 2026 to USD 5.20 billion by 2031, registering a CAGR of 15.66% between 2026 and 2031. The product carbon footprint (PCF) software market is moving from a sustainability support function into a core operating system for compliance, supplier management, and product decisions. Regulatory tightening in Europe has made it harder to delay product-level emissions data, shifting enterprise buying from pilot programs to wider deployment across finance, procurement, and reporting teams. Large buyers are also pushing carbon data requests deeper into supply chains, bringing smaller suppliers into the product carbon footprint (PCF) software market earlier than direct regulation alone would have. AI-led automation is shortening calculation and reporting cycles, while interoperability gaps across data models and emission factor databases still hold back faster scaling. Competitive positioning now depends less on basic calculation capabilities and more on data connectivity, audit readiness, depth of supplier collaboration, and the ability to integrate with existing ERP and product systems.
Key Report Takeaways
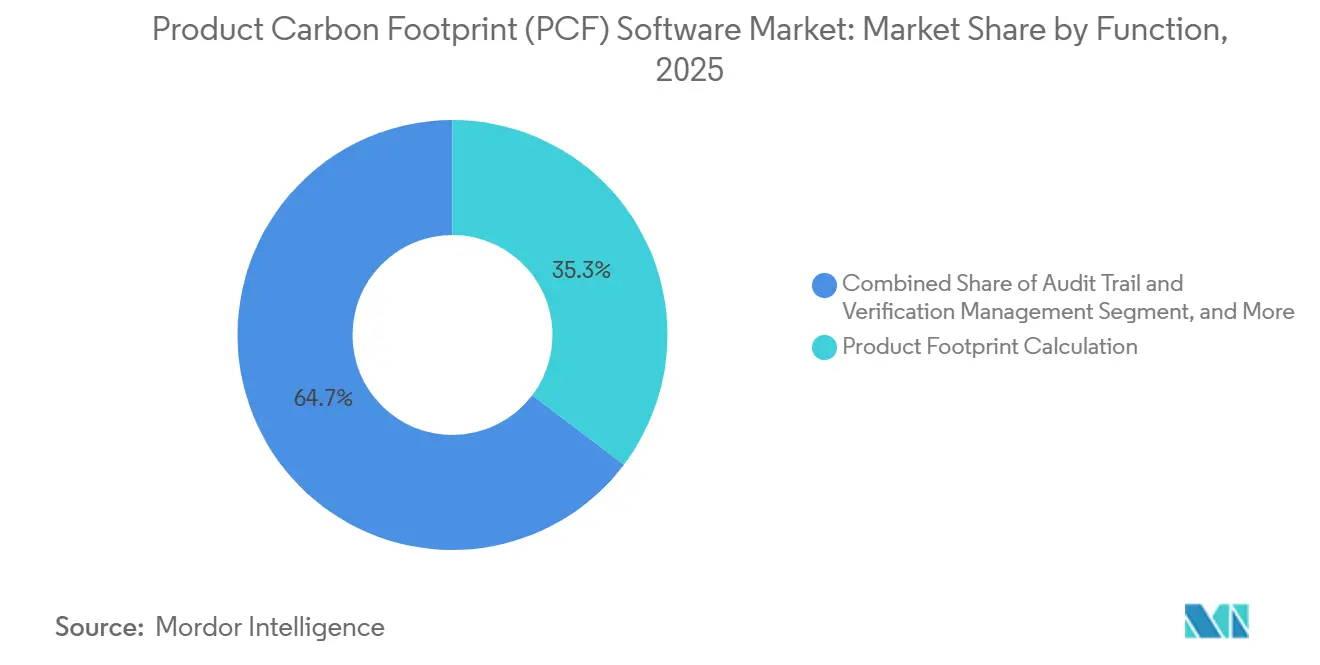
- By function, Product Footprint Calculation held 35.31% of the product carbon footprint (PCF) software market share in 2025, while Reporting and Disclosure Automation is projected to expand at a 16.81% CAGR through 2031.
- By deployment, Cloud-Based solutions accounted for 62.12% of the product carbon footprint (PCF) software market size in 2025, and the same segment is expected to record the highest CAGR of 17.84% through 2031.
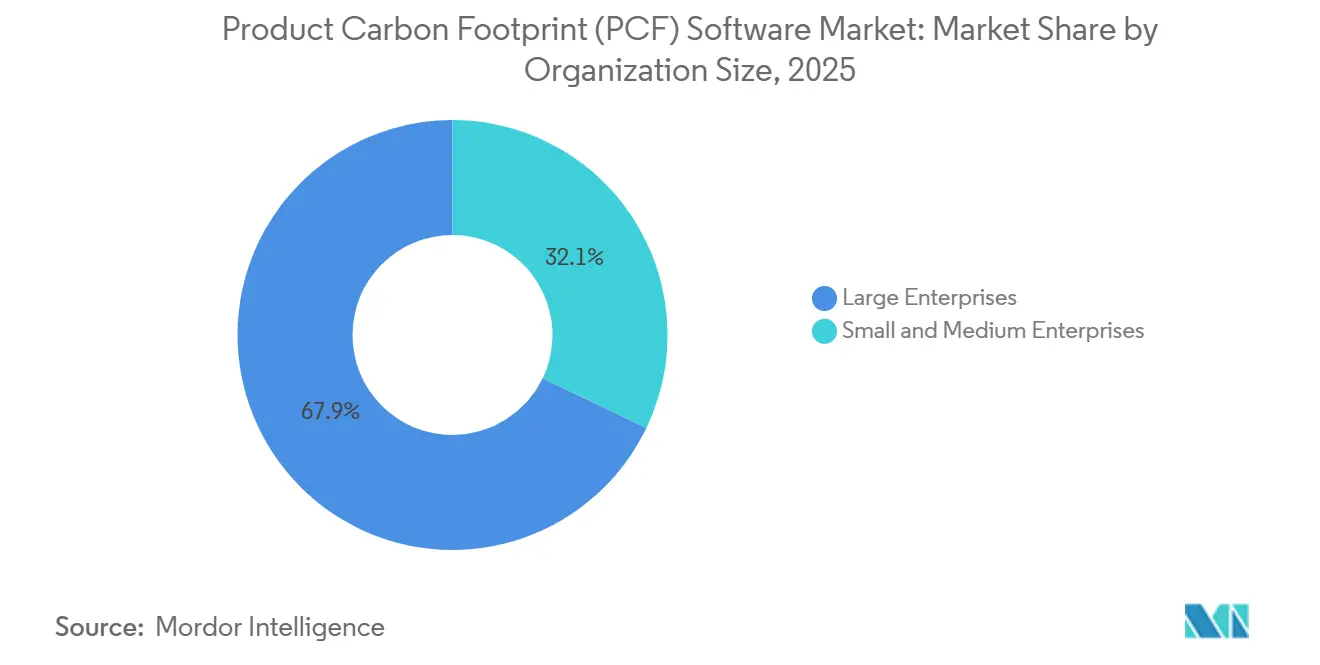
- By organization size, Large Enterprises held 67.89% revenue share in 2025, while Small and Medium Enterprises are projected to advance at a 17.56% CAGR through 2031.
- By industry vertical, Manufacturing captured 36.09% revenue share in 2025, while Retail and Consumer Goods are expected to expand at a 16.29% CAGR through 2031.
- By geography, Europe led with 38.19% revenue share in 2025, while Asia-Pacific is projected to grow at a 17.31% CAGR through 2031.
Note: Market size and forecast figures in this report are generated using Mordor Intelligence’s proprietary estimation framework, updated with the latest available data and insights as of January 2026.
Global Product Carbon Footprint (PCF) Software Market Trends and Insights
Drivers Impact Analysis*
| Driver | (~) % Impact on CAGR Forecast | Geographic Relevance | Impact Timeline |
|---|---|---|---|
| Regulatory Disclosure Mandates Intensify Product-Level Carbon Reporting | +3.5% | Global, concentrated in Europe and Asia-Pacific | Short term (≤ 2 years) |
| Scope 3 Supplier Data Requirements Expand PCF Software Use Cases | +2.8% | Global | Medium term (2-4 years) |
| AI-Assisted Emission Factor Mapping Reduces Calculation Cycle Time | +2.4% | Global, with North America and Asia-Pacific as early adopters | Medium term (2-4 years) |
| Carbon Costs Move Into Procurement And Product Design Decisions | +2.2% | Europe and North America | Medium term (2-4 years) |
| Digital Product Passport Readiness Creates SKU-Level Traceability Demand | +1.8% | Europe, spill-over to Asia-Pacific | Long term (≥ 4 years) |
| Sustainability-Linked Financing Requires Auditable Product Carbon Data | +1.5% | North America and Europe | Long term (≥ 4 years) |
| Source: Mordor Intelligence | |||
Regulatory Disclosure Mandates Intensify Product-Level Carbon Reporting
The product carbon footprint (PCF) software market is seeing its strongest demand push from rules requiring embedded emissions data to be part of day-to-day compliance. The EU Carbon Border Adjustment Mechanism entered its definitive phase in January 2026, raising the cost of inaccurate product-level emissions reporting for importers in covered sectors.[1]UL Solutions, “The Rise of Product Carbon Footprint Regulations,” UL Solutions, ul.com The revised CSRD omnibus, published in February 2026, narrowed the reporting scope to larger entities, but it also concentrated spending among companies with the scale to formalize supplier carbon data requests across multiple tiers. In the product carbon footprint software market, that shift matters because large regulated buyers often set data standards for much smaller suppliers that still need to respond. The result is a reinforcing cycle in which a compliance requirement at one end of the chain becomes a commercial requirement at the other. Regulatory pressure is therefore shaping not only adoption volume, but also the type of platform features buyers now treat as essential, especially audit trails, traceable calculations, and structured disclosure workflows.
Scope 3 Supplier Data Requirements Expand PCF Software Use Cases
Scope 3 data demands are widening the role of the product carbon footprint (PCF) software market beyond internal footprinting and into supplier engagement. Primary supplier data is now more important because spend-based averages do not hold up well when companies need product-level detail for disclosure, procurement, and customer reporting. Sphera’s Supplier PCF Calculator, launched in April 2025, addressed this issue by leveraging a managed database of more than 500,000 verified emission factors and aligning with Catena-X, PACT, and ISO methods. The product carbon footprint (PCF) software market is also attracting smaller suppliers to adopt, as large enterprise customers are increasingly requesting auditable data even when those suppliers lack dedicated sustainability teams. The British Business Bank reported in 2025 that carbon footprint measurement activity was stronger among medium-sized firms than micro-enterprises, but complete supply chain data collection remained limited. That gap is pushing vendors toward simpler onboarding, multilingual supplier portals, and lower-friction pricing models that can widen participation without reducing data quality expectations.
AI-Assisted Emission Factor Mapping Reduces Calculation Cycle Time
AI is changing how quickly companies can start and scale work in the product carbon footprint (PCF) software market. SAP announced in May 2026 that its Footprint Optimization Agent is expected to reduce carbon scenario simulation time from around 1 day to around 20 minutes, which lowers the effort required for broad product portfolio analysis. Normative also launched an AI-powered PCF tool in May 2026 that can ingest bills of materials in various formats, directly addressing one of the most common deployment bottlenecks. In the product carbon footprint (PCF) software market, the larger effect is not only speed. Better matching of product data to verified emission factor databases reduces the need for specialized LCA expertise and makes the software more usable for procurement, finance, and operations teams. As this becomes more common, vendors will compete less on raw calculation speed and more on data provenance, explainability, and evidence trails that can withstand assurance reviews.
Carbon Costs Move into Procurement and Product Design Decisions
The product carbon footprint (PCF) software market is expanding as carbon data no longer stays within sustainability teams. SAP Green Ledger reached general availability in December 2024 and introduced double-entry accounting for emissions, enabling companies to post and analyze carbon data within a control structure closer to finance. That matters because procurement teams can begin comparing suppliers on emissions exposure within the same operating flow where they compare cost, risk, and delivery. The product carbon footprint (PCF) software market also benefits when product design teams use emissions data earlier in material selection and product configuration. SAP was named a Leader in IDC MarketScape for carbon accounting and management applications in May 2026, with its ERP-linked carbon architecture cited as a differentiating strength. Once carbon data affects sourcing decisions and product choices, software budgets become easier to justify because the value case moves beyond reporting and into cost control and commercial resilience.
Restraints Impact Analysis*
| Restraint | (~) % Impact on CAGR Forecast | Geographic Relevance | Impact Timeline |
|---|---|---|---|
| Fragmented Emission Factors and Methodologies Reduce Data Comparability | -1.8% | Global | Short term (≤ 2 years) |
| Deep ERP, PLM, and Supplier Network Integration Raises Deployment Complexity | -1.5% | Global, more acute in Asia-Pacific and South America | Medium term (2-4 years) |
| Privacy Concerns Slow Supplier Disclosure across Multi-Tier Value Chains | -0.9% | Global | Medium term (2-4 years) |
| Skills Gaps Limit Effective Interpretation of Product Carbon Insights | -0.7% | Emerging markets | Long term (≥ 4 years) |
| Source: Mordor Intelligence | |||
Fragmented Emission Factors and Methodologies Reduce Data Comparability
Fragmentation across databases and methods remains a clear brake on the software market for product carbon footprint (PCF) software. Companies still work across ecoinvent, GaBi, managed proprietary libraries, and supplier-specific datasets, which makes side-by-side product comparisons harder than buyers often expect. Research published in Applied Sciences in 2025 highlighted data integration complexity and technological compatibility as major barriers to the adoption of carbon management systems. Normative also noted in 2026 that CSRD and SBTi-related Scope 3 reporting pressures are pushing firms toward better data quality, even as supplier information remains uneven across reporting tiers. In the product carbon footprint (PCF) software market, this creates a two-part challenge where vendors must support methodological rigor while also helping customers work around incomplete or mismatched upstream data. The result is slower standardization, more buyer caution, and longer proof-of-value cycles before platform decisions are finalized.
Deep ERP, PLM, and Supplier Network Integration Raises Deployment Complexity
The product carbon footprint (PCF) software market also faces a deployment hurdle because accurate PCF calculations depend on data that often resides across multiple systems. Carbon outputs need product structures from PLM, purchasing records from ERP, and supplier information from collaboration platforms before they can become audit-ready at scale. The 2025 Applied Sciences study identified high initial costs and integration complexity as core barriers when connecting ERP environments with carbon management tools. SAP’s own product updates in early 2026 showed that infrastructure expansion and connector development remain active areas of work as customers try to align cloud deployment, data residency, and enterprise system integration. This challenge is more severe for mid-sized firms because they often face the same buyer data requests as large enterprises but lack the same internal IT resources. Until connector coverage improves across more ERP and PLM stacks, deployment cycles in the PCF software market will remain longer than many first-time buyers expect.
*Our forecasts treat driver/restraint impacts as directional, not additive. The impact forecasts reflect baseline growth, mix effects, and variable interactions.
Segment Analysis
By Function: Reporting Automation Edges Ahead as Auditors Enter the Picture
Product Footprint Calculation held a 35.31% share in 2025, making it the largest function in the product carbon footprint (PCF) software market. Companies cannot delegate the core requirement to produce traceable, defensible product-level calculations when regulations and customers demand evidence. That is why calculation tools remained central even as other functions gained momentum. The function stayed important because every later reporting layer depends on the quality of the original footprint data.
Reporting and Disclosure Automation is projected to grow at a 16.81% CAGR through 2031, which makes it the fastest-growing function in the PCF software market. Workiva’s May 2026 update added CDP 2026 Corporate and SME scoring criteria to Sustainability Explorer, demonstrating how buyers are moving toward more structured, repeatable disclosure workflows. The pressure now extends beyond data collection, as companies also need to map it into board-level reporting, assurance requests, and formal submissions. Data Collection and Supplier Collaboration are rising for the same reason, while Scenario Analysis, Decarbonization Planning, Audit Trail, and Verification Management are gaining ground as finance teams increasingly seek carbon outputs to support budget and investment decisions.


By Deployment: Cloud Architecture Shapes the PCF Software Competitive Map
Cloud-Based deployment accounted for 62.12% of revenue in 2025, giving it the lead in the product carbon footprint (PCF) software market. This position reflects the practical needs of constant emission factor updates, supplier access across locations, and AI-supported processing, which are harder to manage in purely local environments. Cloud architecture also fits better with standardized API-based exchanges that large buyers increasingly expect from suppliers. The strength of this segment shows that deployment choice is closely tied to operational usability, not just to hosting preference.
Cloud-Based deployment is also expected to record the highest CAGR of 17.84% through 2031, indicating the leading segment is further expanding its role in the product carbon footprint (PCF) software market. SAP expanded SAP Sustainability Footprint Management to AWS infrastructure in Frankfurt and São Paulo in early 2026, demonstrating how cloud vendors are localizing infrastructure to meet compliance and residency requirements.[2]SAP Community, “SAP Sustainability Footprint Management, Q1-26 Updates and Highlights,” SAP Community, community.sap.com On-Premises deployment remains relevant for organizations with strict data control rules or deeply embedded legacy ERP environments. Even there, hybrid operating models are becoming more common, as companies seek local control over sensitive data while still using cloud-based reporting and collaboration tools. Over time, that still pulls the product carbon footprint (PCF) software industry toward a cloud-first structure.
By Organization Size: SME Adoption Becomes the Next Volume Driver
Large Enterprises held 67.89% of the revenue share in 2025, reflecting earlier adoption cycles in the product carbon footprint (PCF) software market. These organizations faced the strongest direct pressure from disclosure obligations, investor scrutiny, and internal supplier data programs. They also had the budgets and systems teams needed to connect Carbon tools with ERP and procurement workflows. Their lead, therefore, came from both regulatory timing and operational readiness.
Small and Medium Enterprises are projected to grow at a 17.56% CAGR through 2031, making them the fastest-rising size segment in the product carbon footprint (PCF) software market. The British Business Bank showed in 2025 that measurement activity among SMEs was advancing, but broad supply chain data readiness remained incomplete. The World Economic Forum also noted in 2025 that limited data infrastructure and policy uncertainty were major barriers for smaller firms. That is why vendors are trying freemium models, lighter onboarding, and modular products that reduce entry friction while still allowing suppliers to respond to large buyer carbon requests. If that model works, SME adoption will do more than add users because it will also deepen the supplier data coverage that large enterprise customers need.
By Industry Vertical: Manufacturing Anchors Demand While Retail Accelerates
Manufacturing captured 36.09% of revenue in 2025, giving it the largest vertical position in the product carbon footprint (PCF) software market. This lead came from complex, multi-tier supply chains, strong Scope 3 exposure, and direct relevance to sectors affected by embedded-carbon rules. Manufacturers also need product-level emissions data that can map to bills of materials and design changes, which makes the software harder to replace with generic carbon tools. As a result, this vertical has become the clearest proving ground for vendors with strong integration and calculation depth.
Retail and Consumer Goods is projected to grow at a 16.29% CAGR through 2031, making it the fastest-expanding vertical in the product carbon footprint (PCF) software market. Worldly expanded its Product Impact Calculator to more than 260 consumer goods categories in February 2026 and said the tool could support primary-data emissions modeling across more than 400,000 products. That move reflects the pressure brands face from customer-facing product claims, supply chain programs, and the need to scale product-level calculations across large portfolios. Energy and Utilities, Transportation and Logistics, Food and Beverages, and Pharmaceuticals all remain active use cases, but retail is advancing faster because product-level disclosure and labeling pressure reach both upstream suppliers and downstream consumers simultaneously. This mix is expanding the addressable market for product carbon footprint software market beyond its earlier focus on industrial compliance settings.
Geography Analysis
Europe held 38.19% revenue share in 2025, giving it the lead in the product carbon footprint (PCF) software market. The region combines dense regulation with mature supply chain networks, which gives software adoption a stronger structural base than in most other regions. The EU Carbon Border Adjustment Mechanism and the broader rise of product carbon regulation have made embedded emissions data more relevant to product trade and sourcing decisions. The CSRD omnibus revision in February 2026 narrowed the formal reporting population, but it still concentrated demand among the largest firms, which are best positioned to push requirements down the chain.
North America remained the second-largest regional PCF software market, driven by enterprise demand for stronger carbon data management and disclosure readiness. The region benefits from a mix of investor pressure, cross-border supplier requirements, and growing attention to product-level traceability. Vendors are also building for local operating needs, and SAP’s 2026 infrastructure expansion into Brazil alongside its European footprint showed how regional service coverage is becoming part of competitive positioning across the Americas. South America remained earlier stage, and adoption there leaned more toward modular cloud deployment, where budgets and implementation capacity were tighter.
Asia-Pacific is projected to expand at a 17.31% CAGR through 2031, making it the fastest-growing geography in the product carbon footprint software market. China’s trial PCF certification rules, launched in March 2025, created a formal product-level certification structure with a standard 90-day cycle and a 2-year validity period. Japan’s Ministry of Economy, Trade, and Industry continues to shape lifecycle assessment and carbon footprint policy, which supports more consistent product-level emissions work across industrial sectors. NTT and other Japanese technology companies also published cradle-to-grave PCF calculation rules for software products in March 2026, which showed that regional development is broadening from manufacturing into digital product categories.[3]NTT Group, “CO₂ Calculation Rules for Software Product Lifecycle, Cradle-to-Grave,” NTT Group, group.ntt.jp Middle East and Africa remained early-stage markets, with adoption centered mainly in large multinational operations and early disclosure frameworks rather than broad-based deployment.

Competitive Landscape
The product carbon footprint (PCF) software market is fragmented, with large ERP-linked vendors and specialist providers competing on different strengths. SAP, Microsoft, Schneider Electric, and Siemens benefit from enterprise system access and embedded workflow integration, while Normative, Watershed, Persefoni, and Sphera compete more directly on calculation focus, automation, and depth of supplier data. In the product carbon footprint software market, this divide shapes buying behavior: some customers prefer deep ERP alignment, while others prioritize speed, flexibility, or supplier engagement. The market is therefore not consolidating around a single model, and that keeps switching decisions closely tied to use case and system architecture. Competitive intensity is rising because both groups are moving toward broader platform capability rather than staying in narrow product lanes.
SAP has taken one of the clearest integration-led positions in the product carbon footprint (PCF) software market. SAP Green Ledger became generally available in December 2024, and the company followed that with new sustainability AI agents in May 2026 to improve simulation speed and regulatory readiness. SAP was also named a Leader in IDC MarketScape in May 2026, which reinforced its message around ERP-native carbon accounting and control architecture. These moves matter because they raise switching costs for large enterprises that already finance, procurement, and product processes on SAP systems.
Specialist vendors are responding by building differentiated data assets and deeper targeted workflows within the PCF software market. Sphera’s April 2025 Supplier PCF Calculator used a managed database of more than 500,000 verified emission factors, which strengthened its position in complex industrial supply chains. Normative launched its AI-powered PCF platform in May 2026, with bill-of-materials ingestion across multiple formats, addressing a major pain point in onboarding and calculation setup.[4]Normative, “Normative PCF, AI-Powered Product Carbon Footprint Software,” Normative, normative.io Workiva’s May 2026 sustainability update also showed how disclosure workflow vendors are extending their role as companies seek stronger links between emissions data, scoring frameworks, and reporting governance. Over time, the strongest positions in the product carbon footprint (PCF) software market are likely to come from vendors that combine reliable primary data capture, traceable calculation logic, and smooth integration into enterprise reporting and product systems.
Product Carbon Footprint (PCF) Software Industry Leaders
SAP SE
Schneider Electric SE
IBM Corporation
Watershed Technology, Inc.
Sphera Solutions, Inc.
- *Disclaimer: Major Players sorted in no particular order

Recent Industry Developments
- June 2026: The Open Group published Open Footprint Standard, Edition 1.0, the first vendor-neutral open standard for Scope 1, 2, and 3 emissions data models, designed to support interoperability across CSRD, California SB 253, ISSB, and WBCSD PACT V3 frameworks. The standard targets the fragmented data-exchange landscape that has historically inflated multi-jurisdiction compliance costs for PCF software buyers.
- May 2026: SAP announced new sustainability AI agents, including a Footprint Optimization Agent and a Sustainability Regulatory Readiness Agent, expected to reach general availability by end of 2026. The Footprint Optimization Agent reduces carbon scenario simulation time from approximately 1 day to around 20 minutes, while the Regulatory Readiness Agent automates CSRD data mapping and audit preparation by translating materiality assessments into structured reporting scopes.
- May 2026: SAP was named a Leader in IDC MarketScape, Carbon Accounting and Management Applications, with evaluators citing SAP Green Ledger’s ERP-native double-entry carbon accounting architecture, product-level footprint calculation capabilities, and ERP data integration as differentiating strengths.
- May 2026: Normative launched Normative PCF, an AI-powered product carbon footprint software for companies with physical products. The platform ingests BOMs in any format, aligns with WBCSD ACT methodology, and operates within the same platform as the corporate carbon footprint module, eliminating the need for a separate tool or duplicate methodology governance.


Global Product Carbon Footprint (PCF) Software Market Report Scope
The product carbon footprint (PCF) software market encompasses solutions that calculate and analyze a product's lifecycle carbon emissions. These platforms integrate bill-of-materials (BOM) data, supplier information, and lifecycle assessment methods to assess emissions from raw material extraction through the product's end of life. They assist in scenario modeling, eco-design, and product-level decarbonization strategies. Furthermore, they support regulatory reporting and initiatives that promote transparency, such as product disclosures and digital product passports.
The Product Carbon Footprint (PCF) Software Market Report is Segmented by Function (Product Footprint Calculation, Data Collection and Supplier Collaboration, Reporting and Disclosure Automation, Scenario Analysis and Decarbonization Planning, Audit Trail and Verification Management, and Other Functions), Deployment (Cloud-Based, and On-Premises), Organization Size (Large Enterprises, and Small and Medium Enterprises), Industry Vertical (Energy and Utilities, Manufacturing, Transportation and Logistics, Food and Beverages, Pharmaceuticals, Retail and Consumer Goods, and Other Industry Verticals), and Geography (North America, South America, Europe, Asia-Pacific, Middle East, and Africa). The Market Forecasts are Provided in Terms of Value (USD).
| Product Footprint Calculation |
| Data Collection and Supplier Collaboration |
| Reporting and Disclosure Automation |
| Scenario Analysis and Decarbonization Planning |
| Audit Trail and Verification Management |
| Other Functions |
| Cloud-Based |
| On-Premises |
| Large Enterprises |
| Small and Medium Enterprises |
| Energy and Utilities |
| Manufacturing |
| Transportation and Logistics |
| Food and Beverages |
| Pharmaceuticals |
| Retail and Consumer Goods |
| Other Industry Verticals |
| North America | United States |
| Canada | |
| Mexico | |
| South America | Brazil |
| Argentina | |
| Rest of South America | |
| Europe | Germany |
| United Kingdom | |
| France | |
| Italy | |
| Spain | |
| Russia | |
| Rest of Europe | |
| Asia-Pacific | China |
| India | |
| Japan | |
| South Korea | |
| Australia | |
| Rest of Asia-Pacific | |
| Middle East | Saudi Arabia |
| United Arab Emirates | |
| Turkey | |
| Rest of Middle East | |
| Africa | South Africa |
| Nigeria | |
| Rest of Africa |
| By Function | Product Footprint Calculation | |
| Data Collection and Supplier Collaboration | ||
| Reporting and Disclosure Automation | ||
| Scenario Analysis and Decarbonization Planning | ||
| Audit Trail and Verification Management | ||
| Other Functions | ||
| By Deployment | Cloud-Based | |
| On-Premises | ||
| By Organization Size | Large Enterprises | |
| Small and Medium Enterprises | ||
| By Industry Vertical | Energy and Utilities | |
| Manufacturing | ||
| Transportation and Logistics | ||
| Food and Beverages | ||
| Pharmaceuticals | ||
| Retail and Consumer Goods | ||
| Other Industry Verticals | ||
| By Geography | North America | United States |
| Canada | ||
| Mexico | ||
| South America | Brazil | |
| Argentina | ||
| Rest of South America | ||
| Europe | Germany | |
| United Kingdom | ||
| France | ||
| Italy | ||
| Spain | ||
| Russia | ||
| Rest of Europe | ||
| Asia-Pacific | China | |
| India | ||
| Japan | ||
| South Korea | ||
| Australia | ||
| Rest of Asia-Pacific | ||
| Middle East | Saudi Arabia | |
| United Arab Emirates | ||
| Turkey | ||
| Rest of Middle East | ||
| Africa | South Africa | |
| Nigeria | ||
| Rest of Africa | ||


Key Questions Answered in the Report
What is the current size of the product carbon footprint (PCF) software market?
The product carbon footprint (PCF) software market was valued at USD 2.17 billion in 2025, rises to USD 2.51 billion in 2026, and is forecast to reach USD 5.20 billion by 2031 at a 15.66% CAGR.
Which region leads product carbon footprint (PCF) software adoption?
Europe led in 2025 with a 38.19% revenue share, supported by dense regulatory requirements and mature supply chain integration.
Which region is growing fastest for PCF software?
Asia-Pacific is projected to record the highest CAGR at 17.31% through 2031 as product-level certification and carbon disclosure activity expands across major economies.
Which deployment model is preferred for PCF software platforms?
Cloud-Based deployment led with a 62.12% share in 2025 and is also expected to grow fastest at a 17.84% CAGR, reflecting demand for scalable updates, supplier access, and AI-enabled workflows.
Which customer group is creating the next wave of demand?
SMEs are projected to grow at a 17.56% CAGR because large buyers are pushing product-level carbon data requirements further down the supply chain.
Which vertical is the most important for revenue today?
Manufacturing led with 36.09% revenue share in 2025, while Retail and Consumer Goods is expanding fastest at a 16.29% CAGR through 2031.
Page last updated on:


