Network Access Control Market Size and Share
Market Overview
| Study Period | 2019 - 2030 |
|---|---|
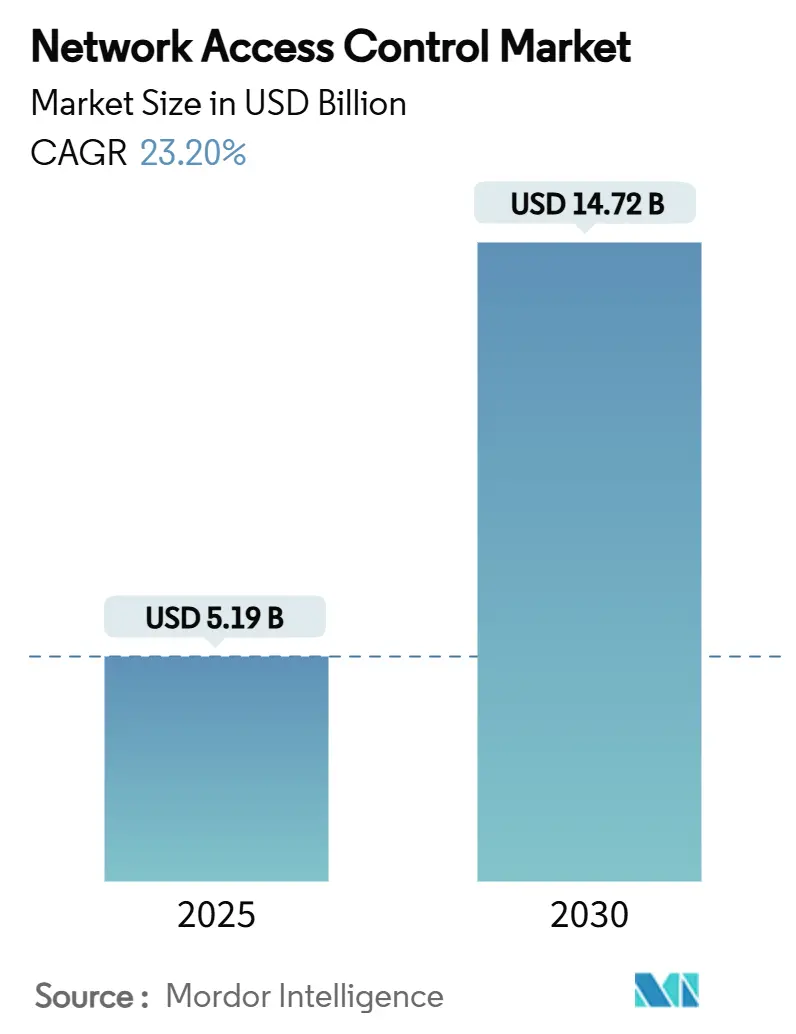
| Market Size (2025) | USD 5.19 Billion |
| Market Size (2030) | USD 14.72 Billion |
| Growth Rate (2025 - 2030) | 23.20% CAGR |
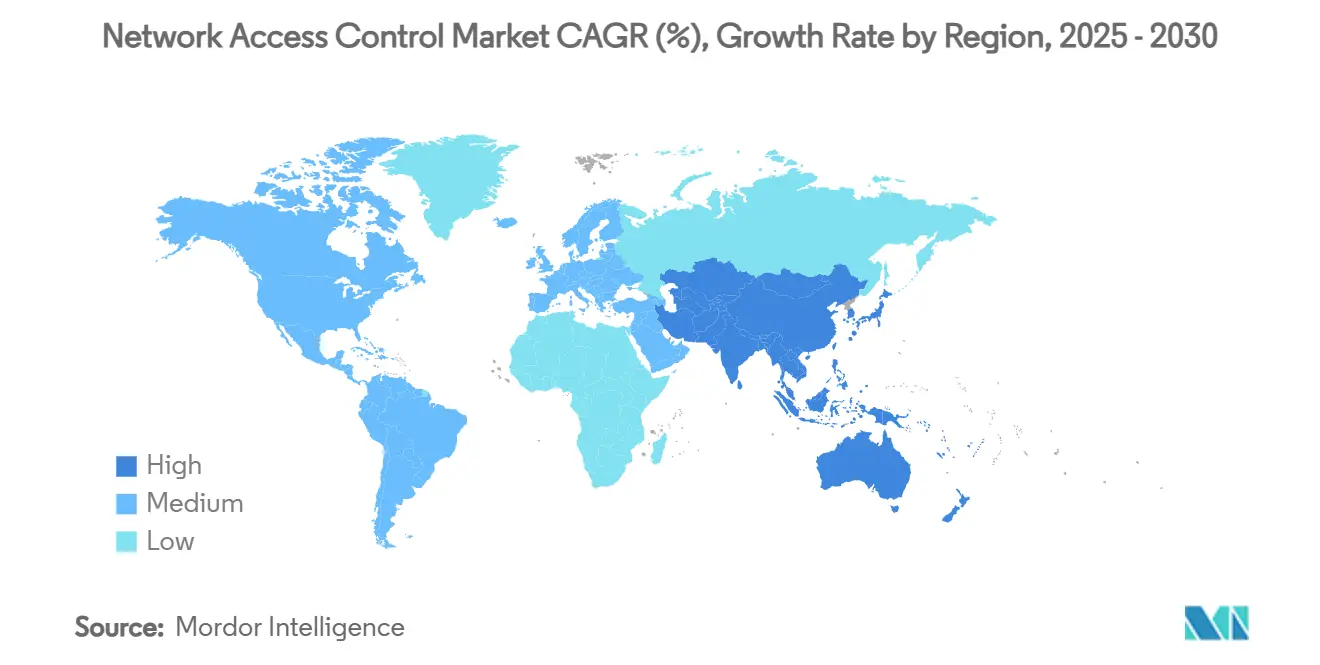
| Fastest Growing Market | Asia Pacific |
| Largest Market | North America |
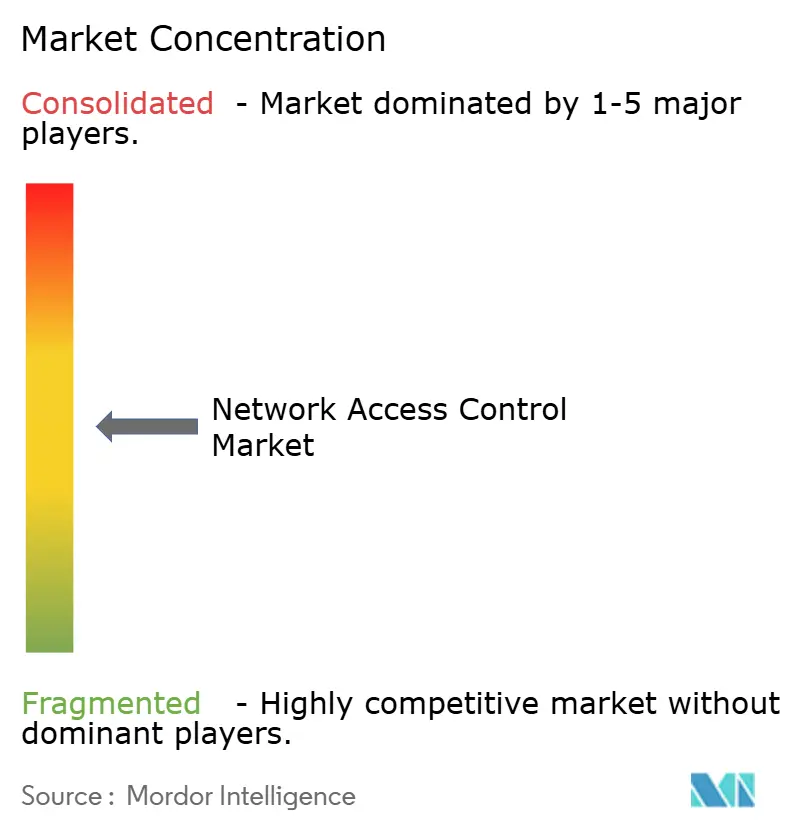
| Market Concentration | Medium |
Major Players *Disclaimer: Major Players sorted in no particular order Image © Mordor Intelligence. Reuse requires attribution under CC BY 4.0. | |
Network Access Control Market Analysis by Mordor Intelligence
The Network Access Control Market size is estimated at USD 5.19 billion in 2025, and is expected to reach USD 14.72 billion by 2030, at a CAGR of 23.20% during the forecast period (2025-2030). Zero-trust architecture adoption, the surge of unmanaged and IoT endpoints, and the normalisation of hybrid work are accelerating demand as enterprises move beyond perimeter-centric security. Convergence with Secure Access Service Edge and Extended Detection and Response ecosystems positions NAC as an essential enforcement layer rather than a stand-alone tool, supporting unified visibility and policy automation. Services outpace product revenue because organisations value implementation expertise that speeds time-to-value and reduces operational risk. Meanwhile, hardware appliance growth softens under tariff-driven price inflation, pushing buyers toward cloud-delivered models that ease capital expenditure. Regionally, North America retains the largest share on the strength of mature compliance regimes, while Asia-Pacific delivers the fastest expansion as digital-transformation initiatives widen the addressable base.
Key Report Takeaways
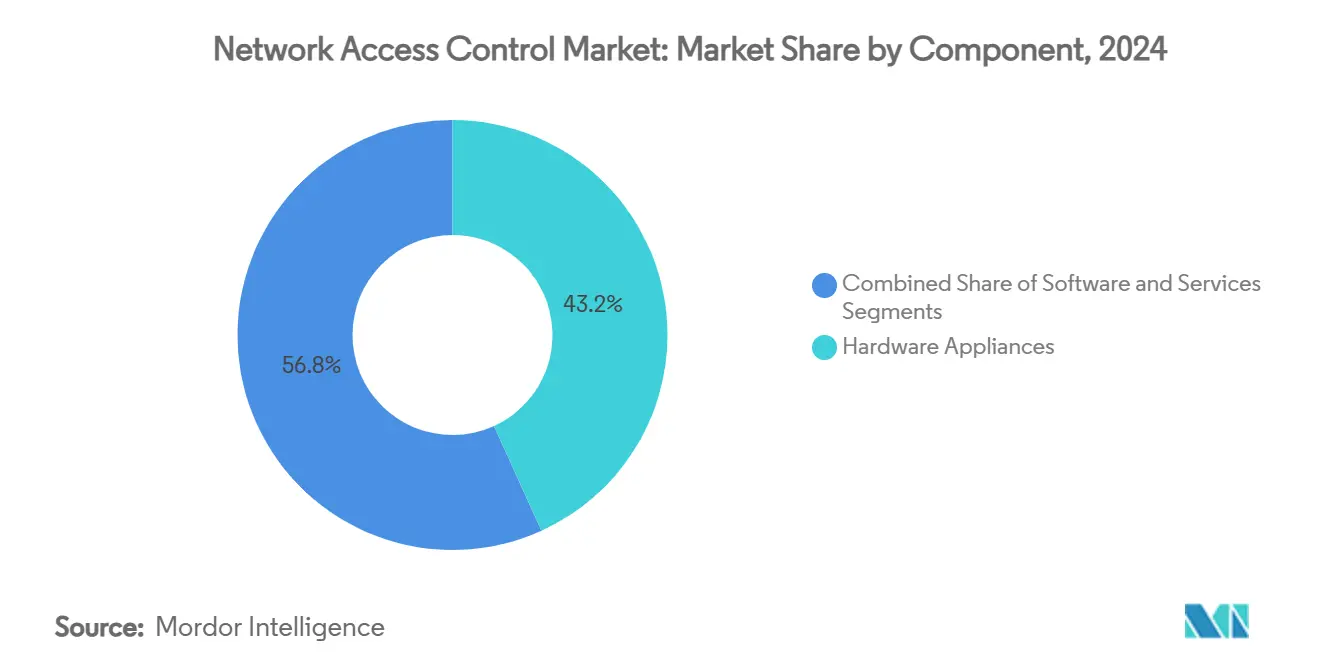
- By component, hardware appliances held 43.2% of 2024 revenue in the Network Access Control Market, whereas services are set to deliver the highest 24.3% CAGR through 2030.
- By deployment model, on-premises implementations accounted for 48.3% of the 2024 total in the Network Access Control Market, while cloud-based options are forecast to post a leading 25.2% CAGR to 2030.
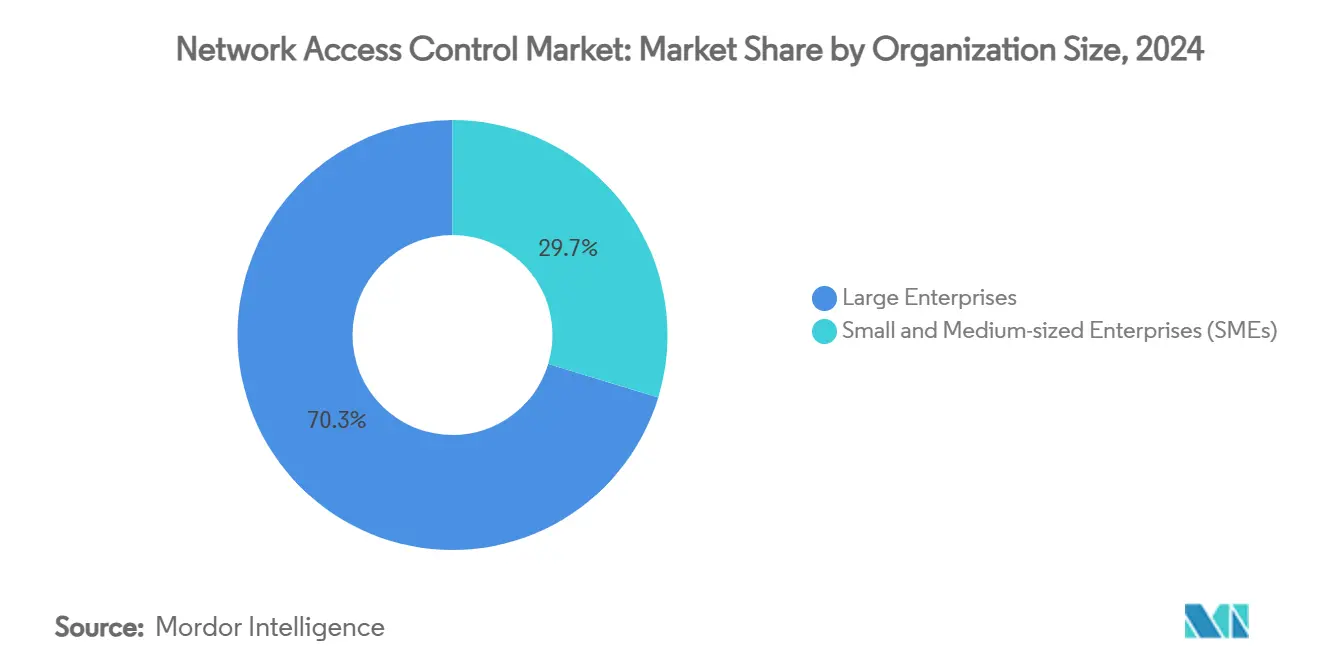
- By organisation size, large enterprises controlled 70.3% of 2024 spending, yet small and medium enterprises are expected to expand the fastest at a 25% CAGR through 2030 in the Network Access Control Market.
- By authentication method, 802.1X commanded 60.1% of 2024 deployments in the Network Access Control Market, whereas captive portal solutions are projected to climb at a 24.7% CAGR to 2030.
- By end-user industry, IT and telecommunications generated 29.3% of 2024 revenue, whereas BFSI is poised to register the quickest 24.5% CAGR to 2030 in the Network Access Control Market.
- By geography, North America led with a 38.4% share in 2024, while Asia-Pacific is forecast to advance at the highest 24.8% CAGR through 2030 in the Network Access Control Market.
Global Network Access Control Market Trends and Insights
Drivers Impact Analysis*
| Driver | (~) % Impact on CAGR Forecast | Geographic Relevance | Impact Timeline |
|---|---|---|---|
| Acceleration of zero-trust architecture adoption | +4.2% | Global, with North America and EU leading | Medium term (2-4 years) |
| Surge in unmanaged and IoT endpoints on enterprise networks | +3.8% | Global, with APAC showing highest growth | Short term (≤ 2 years) |
| Growth of hybrid work and BYOD policies | +3.5% | North America and EU core, spill-over to APAC | Short term (≤ 2 years) |
| Mandatory compliance with data-privacy regulations | +3.2% | EU (NIS2), North America (HIPAA), expanding globally | Medium term (2-4 years) |
| Convergence of NAC with SASE and XDR ecosystems | +2.9% | Global, enterprise-focused markets | Long term (≥ 4 years) |
| Edge-to-cloud security investments by large enterprises | +2.6% | North America and EU, selective APAC markets | Long term (≥ 4 years) |
| Source: Mordor Intelligence | |||
Acceleration of Zero-Trust Architecture Adoption
Continuous verification models replace perimeter-centric controls, making NAC the enforcement point for device and user trust. Juniper’s cloud-native Access Assurance platform integrates AI-driven policy enforcement with identity provider authentication, eliminating implicit trust assumptions. [1]Juniper Networks, “NAC Is Back, Better than Ever,” juniper.net Enterprises recognise that VPN-only approaches cannot protect distributed workforces that depend on cloud applications. Demand grows for NAC solutions that align with identity and access management systems to support unified zero-trust frameworks. Vendors that combine NAC with analytics and threat intelligence secure long-term contracts as customers seek platform breadth rather than point products. Cloud-native designs gain momentum because they deliver policy consistency across hybrid environments without on-premises infrastructure.
Surge in Unmanaged and IoT Endpoints on Enterprise Networks
Connected devices often lack standard authentication capability, creating visibility gaps. Healthcare organisations use automated device profiling and risk scoring to keep life-critical endpoints connected while enforcing security. [2]Ordr, “What Is Network Access Control (NAC)?” ordr.net Manufacturers confront similar challenges as operational technology converges with traditional IT networks. Adoption of MAC Authentication Bypass and certificate-based onboarding rises where 802.1X is impractical. Edge computing pushes enforcement closer to devices, so NAC platforms that handle distributed segments win market share. Vendors that deploy AI for device classification and automated policy creation stand out in markets with high IoT density.
Growth of Hybrid Work and BYOD Policies
Enterprises must secure personal laptops, tablets, and phones that connect from outside traditional offices. Arista’s Guardian for Network Identity supports millions of devices without local hardware, allowing flexible BYOD management. Certificate-based methods replace passwords to lower credential theft risk. Guest users—including contractors and partners—require time-bound access without compromising internal assets, driving captive portal enhancements. Endpoint posture assessment before connection becomes a standard requirement, so NAC vendors integrate with endpoint detection and response tools to give security teams a single enforcement point.
Mandatory Compliance with Data-Privacy Regulations
The NIS2 directive will affect up to 40,000 EU organisations that must log and audit every network connection. HIPAA in the United States mandates strict controls over patient information. Financial institutions face overlapping frameworks that intensify reporting demands. NAC products that ship pre-built compliance templates reduce audit fatigue and gain preference. Vendors with proven guidance and documentary support achieve higher renewal rates because compliance officers favour repeatable processes.
Restraints Impact Analysis*
| Restraint | (~) % Impact on CAGR Forecast | Geographic Relevance | Impact Timeline |
|---|---|---|---|
| High upfront integration and interoperability costs | -2.8% | Global, particularly SME markets | Short term (≤ 2 years) |
| Skills shortage in 802.1X deployment and certificate management | -2.1% | Global, acute in emerging markets | Medium term (2-4 years) |
| Shadow-IT and legacy infrastructure compatibility issues | -1.9% | North America and EU legacy enterprises | Medium term (2-4 years) |
| Vendor lock-in concerns limiting multi-vendor architectures | -1.5% | Enterprise markets globally | Long term (≥ 4 years) |
| Source: Mordor Intelligence | |||
High Upfront Integration and Interoperability Costs
SMEs struggle to fund professional services and hardware. Cisco Identity Services Engine appliances cost USD 1,750–40,990 and drive total deployments above initial licence fees. Hardware prices climbed 5–20% due to tariff policies and semiconductor shortages, extending lead times to 40–60 weeks. Cost pressure encourages a pivot to cloud NAC subscriptions that spread spending across operational budgets. Organisations evaluate the total cost of ownership instead of the licence price alone, favouring vendors that bundle implementation, training, and ongoing optimisation.
Skills Shortage in 802.1X Deployment and Certificate Management
Public key infrastructure is complex, and qualified personnel are scarce, especially in emerging markets. Automated certificate lifecycle management from providers such as SecureW2 compensates for internal skill gaps. Educational and healthcare institutions need simple self-service onboarding portals. Vendors that integrate NAC with mobile device management platforms and automate certificate deployment reduce administrative burden and secure contracts in talent-constrained regions.
*Our forecasts treat driver/restraint impacts as directional, not additive. The impact forecasts reflect baseline growth, mix effects, and variable interactions.
Segment Analysis
By Component: Services Drive Implementation Excellence
Services recorded a 24.3% CAGR through 2030 as organisations realised effective deployment outweighs feature checklists. Enterprises' contract policy design, integration, and optimisation to reduce risk and speed roll-out. Hardware appliances retained a 43.2% share in 2024 because dedicated processing satisfies data residency mandates and latency-sensitive sites. Software sits midway, offering flexibility where existing infrastructure can host virtual appliances.
The shift to service-oriented revenue models shows a maturing Network Access Control market. Healthcare providers pay premiums for regulatory expertise during medical device roll-outs, accepting that failed installations would cost more than professional services. Training packages grow briskly since internal staff want autonomy post-implementation while still relying on vendor escalation support.


By Deployment Model: Cloud Transformation Accelerates
Cloud deployments grow at 25.2% CAGR as companies remove infrastructure barriers and speed pilots. On-premises enforcement held a 48.3% share in 2024, where control and residency rules prevail, while hybrid models let firms keep local enforcement but centralise analytics. Choice now hinges on regulatory scope or organisational maturity rather than technical capability.
Portnox’s NAC-as-a-Service reveals how cloud delivery attracts SMEs by cutting hardware and maintenance costs. [3]Portnox, “NAC-as-a-Service,” portnox.com Rapid feature updates and elastic capacity create pressure on appliance vendors to offer subscription paths. Distributed enterprises appreciate uniform policy enforcement across many sites without shipping physical boxes.
By Organization Size: SME Adoption Surges
Small and medium enterprises posted a 25% CAGR to 2030, enabled by cloud NAC and simplified interfaces. Large enterprises still controlled 70.3% in 2024 thanks to established budgets and multilayered networks that mandate comprehensive tooling.
macmon’s NAC smart bundle costs EUR 4,715 (USD 5,332) for three years and 250 nodes, illustrating entry-level pricing aligned with SME cash flows. Vendors develop intuitive dashboards and default policy sets so customers without dedicated security teams can still meet compliance.
By Authentication Method: Captive Portal Innovation Emerges
Captive portal approaches grew at a 24.7% CAGR through 2030 as firms expanded guest networking and IoT onboarding. The 802.1X standard retained a 60.1% share in 2024 for corporate-managed devices. MAC Authentication Bypass fills gaps where sensors or controllers cannot support certificates.
Cloud-hosted portals now integrate zero-trust checks during web sign-on, strengthening security without affecting usability. Emerging protocols such as EAP-SH aim to merge captive portals into 802.1X flows, reducing management overhead.
By End-user Industry: BFSI Security Transformation
Banking, financial services, and insurance recorded a 24.5% CAGR because regulators demand airtight audit trails. IT and telecommunications contributed 29.3% in 2024, showcasing long-standing security investment and huge infrastructure footprints.
Financial firms require proof of every device identity entering sensitive networks, pushing the adoption of continuous posture assessment. Healthcare, energy, and manufacturing also expand deployments but rely heavily on verticalised consulting to meet sector-specific operating constraints.
Geography Analysis
North America commanded 38.4% of the Network Access Control market share in 2024, driven by mature budgets and strict regulatory frameworks. Consolidation accelerated after Hewlett Packard Enterprise acquired Juniper Networks for USD 14 billion in July 2025, adding AI-native networking that rivals Cisco’s software-led model. Hardware pricing pressure from tariffs and component shortages makes cloud NAC attractive, and organisations prioritise recurring subscriptions over capital purchases.
Asia-Pacific grew fastest at 24.8% CAGR through 2030. Nations fund smart city, manufacturing, and 5G programmes that place millions of unmanaged devices online. Singapore and Japan lead quality adoption through government grants and industry alliances, while India and China supply bulk growth as enterprises modernise. Vendors that localise interfaces and integrate with regional cloud services capture these opportunities.
Europe follows with steady uptake as the NIS2 directive obliges more sectors to log and govern network access. Germany’s delayed domestic legislation slows roll-out, but many EU members proceed on schedule. Enterprises often require data to stay within regional clouds, benefiting vendors that provide local processing. Demand aligns with digital sovereignty goals that prefer European data centres.

Competitive Landscape
The Network Access Control market remains moderately fragmented. Cisco, HPE-Aruba, and Fortinet combine switching, wireless, and firewall assets to offer end-to-end security suites. Forescout and Portnox specialise in agentless discovery and cloud delivery, targeting vertical and SME niches. Arista leverages a hyperscale background to serve high-performance enterprise campuses with its Guardian for Network Identity platform.
Strategy now centres on a unified zero-trust fabric rather than isolated NAC boxes. HPE’s Juniper deal doubles networking revenue and aligns Mist AI with Aruba switching, strengthening multi-domain telemetry. Cisco pivots to software subscriptions that bundle Identity Services Engine with Secure Access Service Edge gateways, creating predictable cash flows. Patent activity around anomaly detection and post-quantum cryptography indicates future differentiation in AI and crypto agility. [4]Patents Encyclopedia, “Network Security Selective Anomaly Alerting,” patentsencyclopedia.com
Rivals invest in partner ecosystems to reduce skills gaps. Managed service providers offering 24×7 policy monitoring form a critical channel when end-users lack staff. Pricing pressures from hardware inflation encourage vendors to tilt toward cloud licensing and device-based billing.
Network Access Control Industry Leaders
Cisco Systems, Inc.
Hewlett Packard Enterprise Company
Fortinet, Inc.
Forescout Technologies, Inc.
Juniper Networks, Inc.
- *Disclaimer: Major Players sorted in no particular order

Recent Industry Developments
- July 2025: Hewlett Packard Enterprise completed its USD 14 billion acquisition of Juniper Networks to expand its AI-native networking and security portfolio.
- June 2025: Fortinet launched the AI-powered FortiMail Workspace Security suite for browser and collaboration tool protection.
- May 2025: Fortinet introduced FortiGate 700G next-generation firewall with 7× throughput improvement and post-quantum readiness.
- May 2025: Arista announced Q1 2025 revenue above USD 2 billion linked to AI networking demand and authorised a USD 1.5 billion share repurchase.
- May 2025: Fortinet reported Q1 2025 revenue of USD 1.54 billion with Unified SASE ARR up 26% year over year.


Global Network Access Control Market Report Scope
| Hardware Appliances | |
| Software | |
| Services | Implementation and Integration |
| Training and Consulting | |
| Support and Maintenance |
| On-Premises |
| Cloud-based |
| Hybrid |
| Small and Medium Enterprises (SMEs) |
| Large Enterprises |
| 802.1X |
| MAC Authentication Bypass (MAB) |
| Captive Portal |
| IT and Telecommunications |
| BFSI |
| Healthcare |
| Government and Public Sector |
| Retail and E-commerce |
| Manufacturing |
| Education |
| Energy and Utilities |
| Other End-user Industries |
| North America | United States | |
| Canada | ||
| Mexico | ||
| South America | Brazil | |
| Argentina | ||
| Chile | ||
| Rest of South America | ||
| Europe | Germany | |
| United Kingdom | ||
| France | ||
| Italy | ||
| Spain | ||
| Rest of Europe | ||
| Asia-Pacific | China | |
| Japan | ||
| India | ||
| South Korea | ||
| Australia | ||
| Singapore | ||
| Malaysia | ||
| Rest of Asia-Pacific | ||
| Middle East and Africa | Middle East | Saudi Arabia |
| United Arab Emirates | ||
| Turkey | ||
| Rest of Middle East | ||
| Africa | South Africa | |
| Nigeria | ||
| Rest of Africa | ||
| By Component | Hardware Appliances | ||
| Software | |||
| Services | Implementation and Integration | ||
| Training and Consulting | |||
| Support and Maintenance | |||
| By Deployment Model | On-Premises | ||
| Cloud-based | |||
| Hybrid | |||
| By Organization Size | Small and Medium Enterprises (SMEs) | ||
| Large Enterprises | |||
| By Authentication Method | 802.1X | ||
| MAC Authentication Bypass (MAB) | |||
| Captive Portal | |||
| By End-user Industry | IT and Telecommunications | ||
| BFSI | |||
| Healthcare | |||
| Government and Public Sector | |||
| Retail and E-commerce | |||
| Manufacturing | |||
| Education | |||
| Energy and Utilities | |||
| Other End-user Industries | |||
| By Geography | North America | United States | |
| Canada | |||
| Mexico | |||
| South America | Brazil | ||
| Argentina | |||
| Chile | |||
| Rest of South America | |||
| Europe | Germany | ||
| United Kingdom | |||
| France | |||
| Italy | |||
| Spain | |||
| Rest of Europe | |||
| Asia-Pacific | China | ||
| Japan | |||
| India | |||
| South Korea | |||
| Australia | |||
| Singapore | |||
| Malaysia | |||
| Rest of Asia-Pacific | |||
| Middle East and Africa | Middle East | Saudi Arabia | |
| United Arab Emirates | |||
| Turkey | |||
| Rest of Middle East | |||
| Africa | South Africa | ||
| Nigeria | |||
| Rest of Africa | |||


Key Questions Answered in the Report
What is the current value of the Network Access Control market?
The market reached USD 5.19 billion in 2025 and is projected to hit USD 14.72 billion by 2030 at a 23.2% CAGR.
Which component segment is growing fastest?
Services grow the quickest at a 24.3% CAGR because enterprises rely on implementation expertise for successful zero-trust roll-outs.
Why are SMEs adopting NAC solutions more rapidly than large enterprises?
Cloud delivery and simplified interfaces remove the infrastructure and skill barriers that previously limited SME deployments, driving a 25% CAGR for this group.
Which region is expanding at the highest pace?
Asia-Pacific leads with a 24.8% CAGR through 2030 due to smart city projects, IoT expansion and supportive government cyber-security mandates.
How does NAC support zero-trust architecture?
NAC enforces continuous device and user authentication, integrates with identity providers and supplies real-time posture data, making it a core zero-trust control.
What challenges restrain NAC market growth?
High integration cost and a shortage of 802.1X and certificate skills limit adoption, especially among SMEs and organisations with legacy infrastructure.
Page last updated on:


