SDN-Enabled Switch Market Size and Share
Market Overview
| Study Period | 2020 - 2031 |
|---|---|
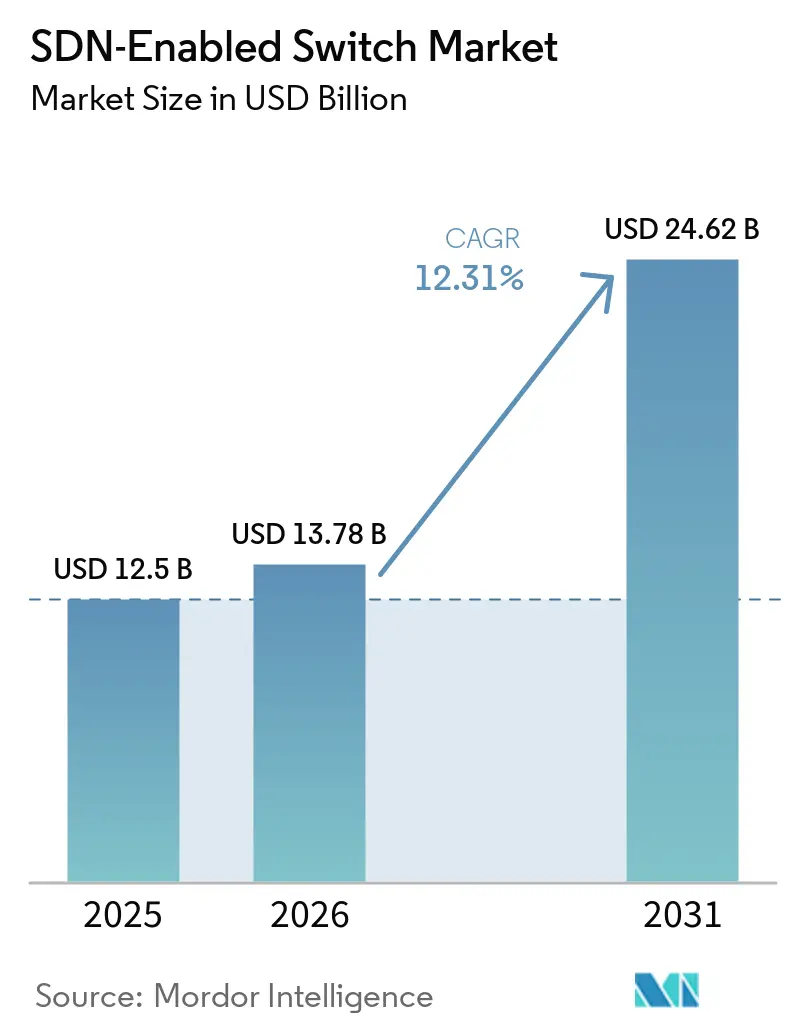
| Market Size (2026) | USD 13.78 Billion |
| Market Size (2031) | USD 24.62 Billion |
| Growth Rate (2026 - 2031) | 12.31% CAGR |
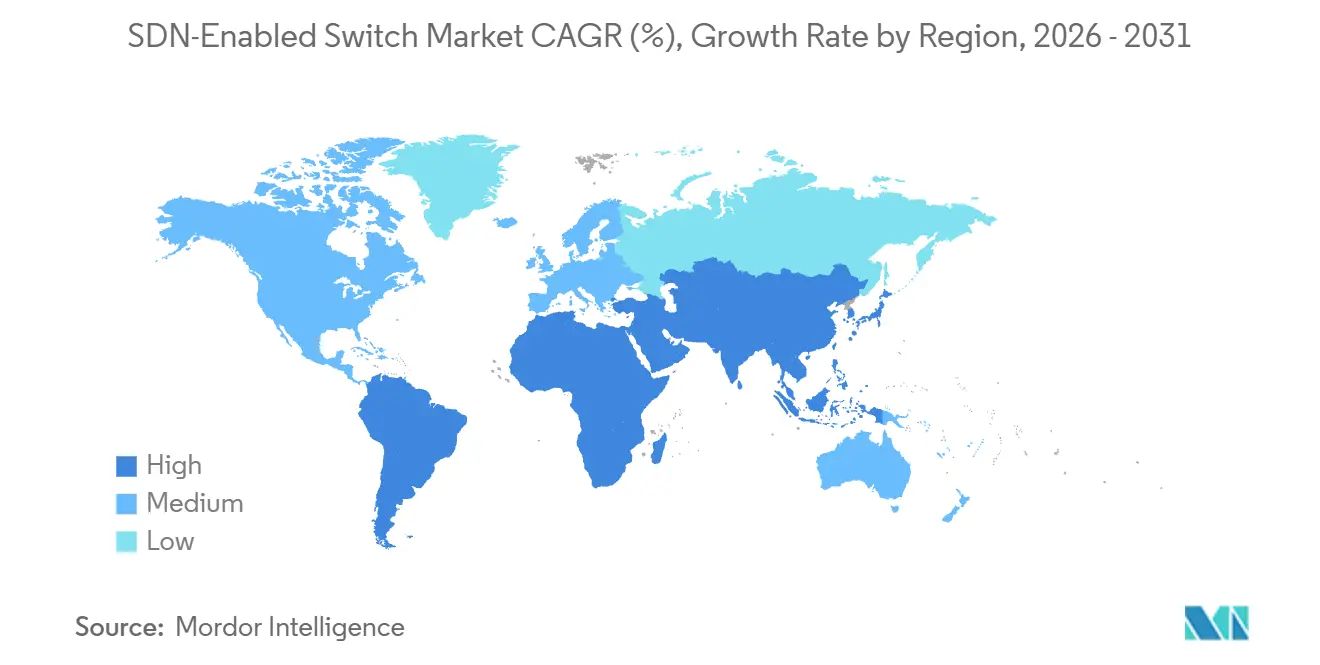
| Fastest Growing Market | Asia-Pacific |
| Largest Market | North America |
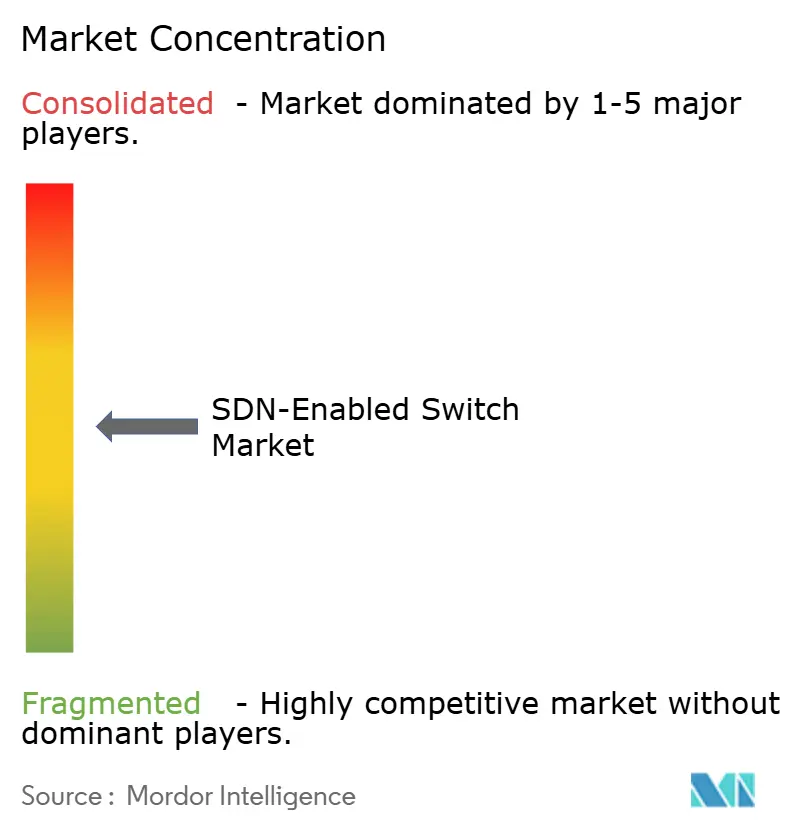
| Market Concentration | Medium |
Major Players *Disclaimer: Major Players sorted in no particular order Image © Mordor Intelligence. Reuse requires attribution under CC BY 4.0. | |
SDN-Enabled Switch Market Analysis by Mordor Intelligence
The SDN-enabled switch market size was valued at USD 12.5 billion in 2025 and estimated to grow from USD 13.78 billion in 2026 to reach USD 24.62 billion by 2031, at a CAGR of 12.31% during the forecast period (2026-2031). Hyperscale data-center operators continue to invest at record levels, creating demand for programmable fabrics that can reallocate bandwidth within seconds to AI training clusters and content-delivery nodes. Eight of the ten largest cloud providers shifted more than half of their top-of-rack estate to software-defined switching by late 2025, compressing refresh cycles from five years to three. White-box designs paired with open-source network operating systems cut total cost of ownership by as much as 30%, a saving that resonates with operators facing flat pricing for cloud services. Government funding for 5G transport and enterprise automation further widens the addressable base for SDN-enabled hardware in metro, campus, and edge locations.
Key Report Takeaways
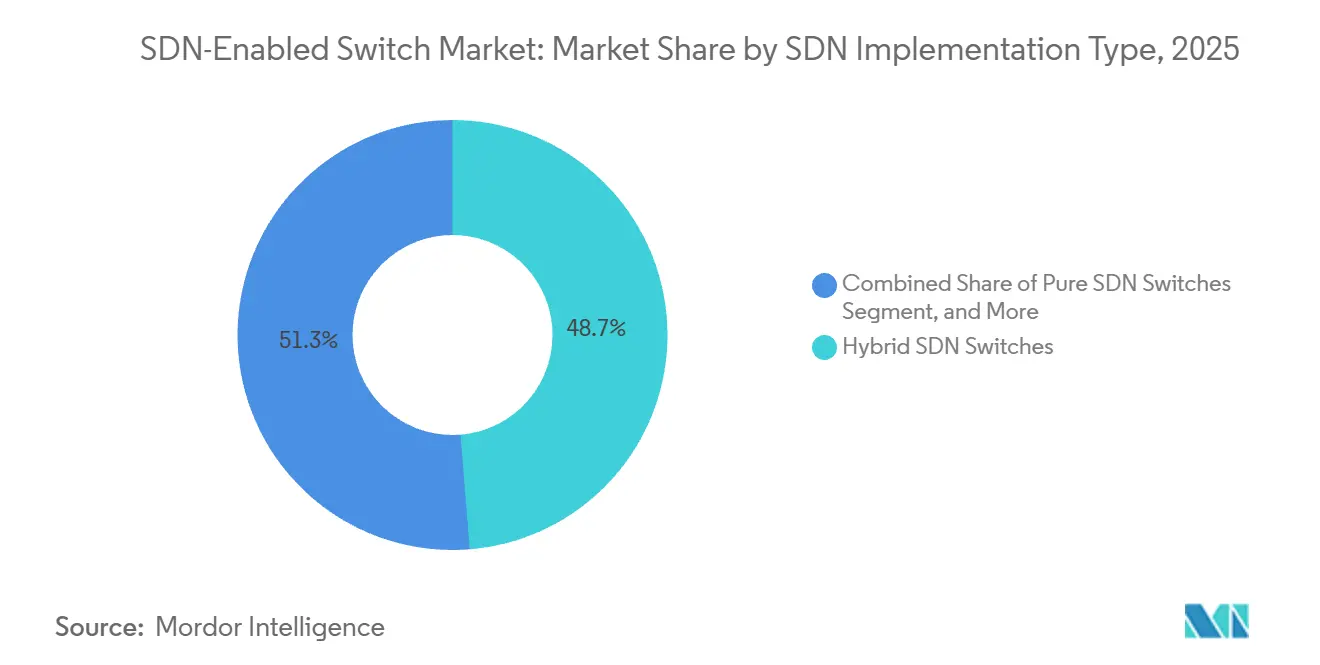
- By SDN implementation type, hybrid SDN switches led with 48.72% revenue share in 2025, while pure SDN switches are projected to expand at a 13.84% CAGR through 2031.
- By port speed, the 25/40 gigabit Ethernet category accounted for 27.91% of the SDN-enabled switch market share in 2025; 400 gigabit Ethernet and above is on pace to grow at an 18.63% CAGR to 2031.
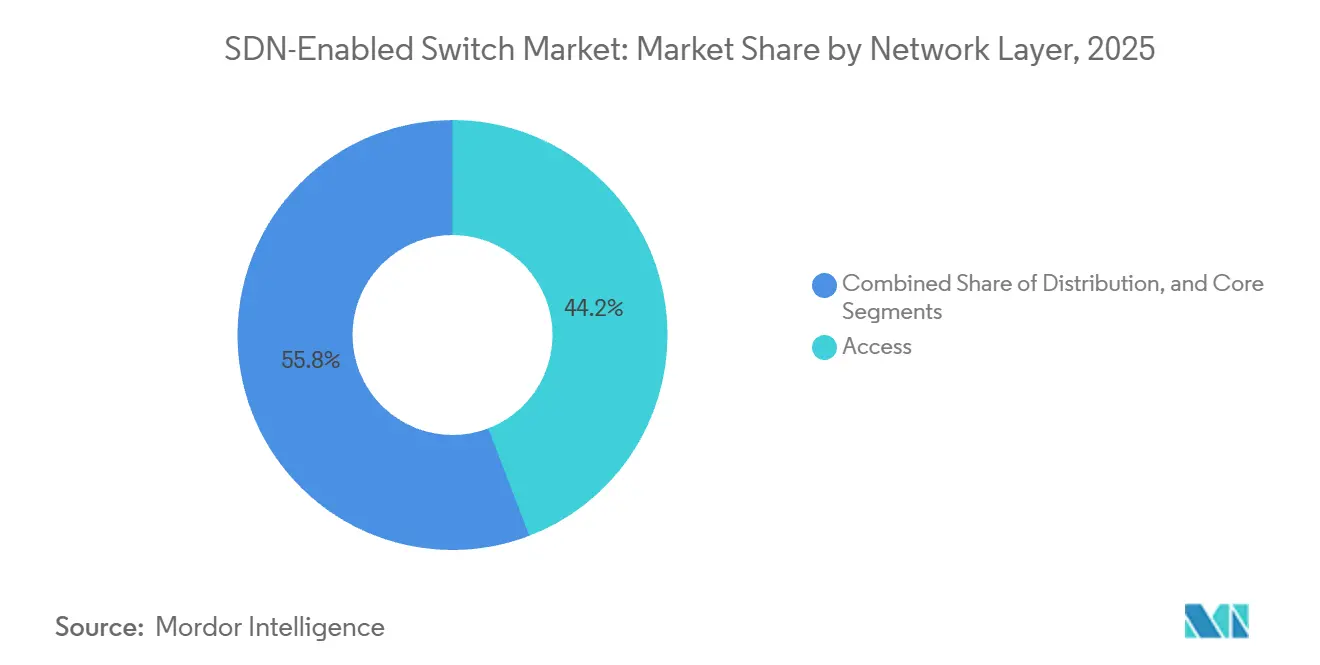
- By network layer, access switches accounted for 44.18% of deployments in 2025, whereas core switches are forecast to advance at a 14.72% CAGR over 2026-2031.
- By end-user, cloud and data center providers accounted for 41.63% of demand in 2025; telecommunication service providers are expected to record a 13.52% CAGR through 2031.
- By geography, North America commanded 36.84% of 2025 revenue, yet Asia-Pacific is projected to post a 15.94% CAGR through 2031.
Note: Market size and forecast figures in this report are generated using Mordor Intelligence’s proprietary estimation framework, updated with the latest available data and insights as of January 2026.
Global SDN-Enabled Switch Market Trends and Insights
Drivers Impact Analysis*
| Driver | (~) % Impact on CAGR Forecast | Geographic Relevance | Impact Timeline |
|---|---|---|---|
| Rapid scalability needs in hyperscale data centers | +3.20% | Global, concentrated in North America and Asia-Pacific | Short term (≤ 2 years) |
| Surge in east-west traffic owing to microservices architectures | +2.80% | Global, led by North America and Europe | Medium term (2-4 years) |
| Network automation mandates to lower OPEX | +2.40% | Global, with early traction in North America and Europe | Medium term (2-4 years) |
| Adoption of white-box switches by tier-1 cloud providers | +1.90% | North America, Asia-Pacific | Short term (≤ 2 years) |
| Disaggregation trend enabled by Open Compute Project | +1.50% | North America, Europe, emerging in Asia-Pacific | Long term (≥ 4 years) |
| Government initiatives funding 5G transport networks | +1.20% | Asia-Pacific, Middle East, North America | Medium term (2-4 years) |
| Source: Mordor Intelligence | |||
Rapid Scalability Needs in Hyperscale Data Centers
Traffic surges triggered by large-language-model training often spike without notice, making fixed-function switches impractical. SDN-enabled hardware with telemetry-driven congestion control lets operators reassign thousands of 400 GbE links in seconds, sustaining GPU utilization above 90%. Meta’s distributed switch fabric cut tail latency by 40% in clusters with more than 100,000 servers.[1]Meta Engineering Blog, “Distributed Switch Fabric Architecture for AI Workloads,” engineering.fb.com Similarly, Google and Amazon committed to next-generation spine-leaf fabrics in new Texas and Minnesota campuses. These outcomes reinforce the view that software-defined control is a prerequisite for operating at exascale.
Surge in East-West Traffic Owing to Microservices Architectures
Microservices now produce roughly 80% of intra–data-center packets, reversing the client-server model that dominated past decades. Legacy three-tier networks buckle under the chatter of service meshes that orchestrate hundreds of ephemeral pods. SDN-enabled spine-leaf designs offer non-blocking bandwidth and equal-cost multipath routing, preventing oversubscription bottlenecks. Kubernetes passed 5.6 million production clusters by mid-2025, each requiring policy enforcement that references pod labels, not static IP addresses. Open-source NOS options such as SONiC, integrated with Vector Packet Processing, process 100 million packets per second at sub-10 microsecond jitter, delivering carrier-grade performance without proprietary ASICs.[2]Linux Foundation Networking, “SONiC-VPP Integration Hits 100 Mpps,” lfnetworking.org
Network Automation Mandates to Lower OPEX
Operating expense still represents a vast majority of the life-cycle cost for enterprise networks. CIOs, therefore, champion zero-touch provisioning and intent-based policy that masks device-level syntax. Cisco’s Crosswork and comparable platforms halved mean-time-to-repair in 2025 trials, recapturing engineer hours for strategic work. Multi-vendor orchestration has matured; Gluware 5.5 added native SONiC hooks, enabling one workflow to span Cisco, Juniper, Arista, and white-box gear. The Switch Abstraction Interface, maintained by the Open Compute Project, standardizes silicon access, letting operators switch between vendors without rewriting automation logic.
Adoption of White-Box Switches by Tier-1 Cloud Providers
Cloud operators booked USD 2.13 billion in white-box revenue during 2025 and will likely surpass USD 5.30 billion by 2034. Designs such as UfiSpace’s S9700-76DX and Edgecore’s 32-port 100 GbE spines sell at about 40% below branded equivalents while supporting SONiC and SAI standards. Microsoft now runs more than 200,000 SONiC switches at five-nines availability, dispelling doubts around open-source reliability. Disaggregation also accelerates innovation; operators can deploy Intel Tofino 3 or Broadcom Jericho3-AI months after tape-out, whereas branded integrations require year-long qualification.
Restraints Impact Analysis*
| Restraint | (~) % Impact on CAGR Forecast | Geographic Relevance | Impact Timeline |
|---|---|---|---|
| Complexity of integrating legacy network management tools | -1.80% | Global, acute in Europe and North America enterprises | Medium term (2-4 years) |
| Limited skilled workforce for SDN programming languages | -1.40% | Global, most severe in Asia-Pacific and South America | Long term (≥ 4 years) |
| Perceived security risks around centralized controllers | -1.10% | Global, heightened in government and defense sectors | Short term (≤ 2 years) |
| Vendor interoperability gaps in southbound APIs | -0.90% | Global, concentrated in multi-vendor environments | Medium term (2-4 years) |
| Source: Mordor Intelligence | |||
Complexity of Integrating Legacy Network Management Tools
Legacy tools such as HP Network Node Manager and SolarWinds Network Performance Monitor rely on SNMP polling and syslog parsing, which cannot capture the sub-second telemetry streams that SDN controllers require for real-time policy enforcement. Migration projects frequently stall when operators discover that existing change-management workflows, built around manual configuration templates and approval chains, cannot accommodate the intent-based abstractions that SDN platforms expose. A 2025 survey of 340 network architects found that 62% cited integration complexity as the primary barrier to SDN adoption, ahead of budget constraints or vendor lock-in concerns.[3]IEEE Communications Society, “SDN Adoption Barriers Survey 2025,” comsoc.org
Limited Skilled Workforce for SDN Programming Languages
Fewer than 15% of network engineers presently code in Python or Go, yet these skills underpin controller customization and CI/CD pipelines. Asia-Pacific and South America feel the crunch most acutely as university syllabi trail market demand and English documentation raises entry hurdles. Talented practitioners command salaries 30-40% higher than classic network admins, and churn exceeds 25% as hyperscalers poach staff. Certification programs enrolled 18,000 candidates in 2025, still well short of the 50,000 enterprises targeting deployments by 2028.
*Our forecasts treat driver/restraint impacts as directional, not additive. The impact forecasts reflect baseline growth, mix effects, and variable interactions.
Segment Analysis
By SDN Implementation Type: Hybrid Deployments Dominate Transition Phase
Hybrid designs accounted for 48.72% of the SDN-enabled switch market share in 2025, as they allow operators to keep familiar OSPF and BGP processes alongside OpenFlow or NETCONF policies. This coexistence lowers the perceived risk of controller outages. Pure SDN switches, projected to grow at a 13.84% CAGR through 2031, gain traction in greenfield hyperscale campuses where no legacy tooling exists. The SDN-enabled switch market size for pure deployments is set to expand rapidly as NVIDIA Spectrum-4 and Arista 7060X6 platforms prove that centralized control can match proprietary features at line rate. Overlay-based variants, reliant on VXLAN or NVGRE, remain a bridge solution for branches and campuses constrained by hardware refreshes.
The gradual shift from dual-stack hybrids to pure SDN echoes the IPv4-to-IPv6 migration: early adopters absorb added complexity for a future of leaner operations. Arista’s P4-programmable pipelines enable operators to embed workload-specific telemetry, underscoring how software freedom, not port density, will differentiate next-generation silicons. Overlay appliances still retain importance where compliance frameworks such as PCI-DSS forbid large-scale hardware swaps, yet their share will decline once controller resilience myths fade.


By Port Speed: 400 Gigabit Ethernet Gains Momentum
The 25/40 GbE tier delivered 27.91% revenue in 2025, underpinned by enterprise top-of-rack refreshes. However, 400 GbE and above will accelerate at an 18.63% CAGR as AI factories saturate 200 Gbps-per-GPU thresholds. The SDN-enabled switch market size for 400 GbE spines is climbing fastest in North America and Asia-Pacific, where Juniper QFX5230 and Dell PowerSwitch Z9864F dominate new designs. Meanwhile, 1 GbE persists at the edge in industrial gateways, and 100 GbE balances cost versus density for database replication clusters.
Vendors already sample 800 GbE and 1.6 TbE line cards standardized under IEEE 802.3ck, preparing for post-2027 ramps once optics prices fall. NVIDIA’s Spectrum-SN5600 couples 64-port 400 GbE blocks with GPU-aware congestion control, hinting at a wave of workload-optimized silicon in place of generic port-count races.[4]NVIDIA Investor Relations, “Spectrum-X Ethernet Fabric Revenue FY2025,” investor.nvidia.com Additionally, ecosystem readiness across optics, cabling, and ASIC supply chains will be critical to accelerate commercialization timelines.
By Network Layer: Core Switches Capture AI Workload Growth
Access switches formed 44.18% of 2025 shipments, reflecting entrenched campus and branch footprints. Core switches, however, are poised for a 14.72% CAGR because AI training forces operators to aggregate terabit-scale flows into fewer nodes capable of microburst absorption. The SDN-enabled switch market size associated with core deployments will rise as enterprises collapse distribution tiers into leaf-spine constructs.
Access-layer switches remain the entry point for SDN adoption, where features such as zero-touch provisioning and role-based access control deliver immediate operational benefits without requiring wholesale network redesigns. Huawei's CloudEngine 8800 series, dominant in Asia-Pacific access layers, integrates with the iMaster NCE controller to provide intent-based segmentation for industrial IoT and smart manufacturing applications. Distribution-layer switches persist in hierarchical campus networks and service-provider aggregation points, where they terminate thousands of access-layer uplinks and enforce policy boundaries between customer segments.
By End-User: Telecom Providers Accelerate NFV Adoption
Cloud and data center operators held 41.63% of demand in 2025, yet telecom carriers will register the fastest growth at 13.52% CAGR through 2031. The SDN-enabled switch market size for telecoms expands as 5G standalone cores and network-slicing compel upgrades from fixed-function routers to programmable fabrics. VEON’s seven-country vEPC rollout verified that carrier-grade availability is achievable when dual-controller architectures and sub-50 ms failover are standard practice.
Enterprises in finance and healthcare increasingly seek intent-based segmentation embedded directly into switching infrastructure, reducing network provisioning and policy enforcement cycles from days to minutes while improving compliance visibility. This also enables tighter integration with zero-trust frameworks and automated threat containment at the network edge. Government and defense users, however, continue to adopt more cautiously due to stringent clearance requirements and data sovereignty mandates, often favoring on-premises control planes and locally manufactured silicon.
Geography Analysis
North America contributed 36.84% of 2025 revenue, anchored by more than USD 400 billion in hyperscale data-center spending across Virginia, Oregon, Texas, and Iowa. Continuous capacity additions and early adoption of 400 GbE fabrics place the region at the forefront of software-defined switching deployments for AI and cloud workloads. Stringent federal programs such as the United States Air Force’s Enterprise IT CONNECT further expand demand for programmable infrastructure in campus and wide-area domains.
Asia-Pacific is forecast to post a 15.94% CAGR through 2031, propelled by India’s plan to lift installed IT load from just above 2 GW in 2026 toward 8 GW by the early 2030s. Hyperscalers led by Google, Microsoft, and Amazon have committed more than USD 40 billion to the country, funneling switch orders to white-box original design manufacturers and branded incumbents alike. China remains the single-largest national market inside the region, where government mandates for domestically designed networking stacks favor Huawei, H3C, and Ruijie.
Europe advances at a steadier clip as fragmented data-sovereignty rules require localized infrastructure in each member state, adding cost and elongating refresh cycles. Even so, the NIS2 Directive, effective October 2024, obliges operators to centralize network visibility and policy, which aligns with SDN’s single-pane orchestration model. The Middle East and Africa, though smaller in revenue, are seeing first-wave commercial 5G-Advanced slicing projects that rely on SDN controllers to assure end-to-end quality of service, while South America shows early momentum as Brazil welcomes new cloud regions from AWS and Microsoft.

Competitive Landscape
The market is moderately concentrated: Arista, Cisco, Juniper, Hewlett Packard Enterprise, and NVIDIA together controlled roughly 55% of 2025 revenue, giving them purchasing leverage with silicon vendors yet still leaving room for white-box challengers to win on price. Incumbents defend margins by embedding predictive analytics in orchestration suites such as Cisco Crosswork and Arista CloudVision, which raise switching costs for operators considering a move to open-source alternatives.
Hewlett Packard Enterprise’s USD 14 billion acquisition of Juniper Networks will create an end-to-end portfolio that spans campus, data center, and wide-area segments.[5]HPE Press Release, “HPE to Acquire Juniper Networks for USD 14 Billion,” hpe.com The deal also positions HPE to better integrate AI-driven networking, security, and observability capabilities across its stack. The combination places immediate pressure on Cisco’s integrated stack and accelerates investment in cloud-ready control-plane software that can abstract both Aruba and Juniper hardware under a common interface.
White-box suppliers Edgecore, Cumulus, and NoviFlow continue to erode incumbents’ share in hyperscale and telecom tiers by packaging programmable ASICs from Intel and Broadcom with open-source network operating systems such as SONiC. NVIDIA’s Spectrum-X Ethernet fabric, which generated USD 11.8 billion in fiscal 2025, demonstrates that AI-optimized switching is shifting competitive focus from generic port density to workload-aware congestion control, forcing traditional vendors to introduce GPU-centric features to stay relevant.
SDN-Enabled Switch Industry Leaders
Arista Networks Inc.
Cisco Systems Inc.
Hewlett Packard Enterprise Company
Dell Technologies Inc.
Huawei Technologies Co. Ltd.
- *Disclaimer: Major Players sorted in no particular order

Recent Industry Developments
- April 2026: e& UAE and Huawei completed a live 5G-Advanced slicing proof-of-concept that provisioned service classes in under ten milliseconds, validating SDN controllers in radio and transport domains.
- January 2026: Google earmarked USD 185 billion for 2026 capex, including two U.S. data centers featuring 800 GbE fabrics and SDN-controlled telemetry.
- January 2026: Amazon Web Services announced USD 12 billion for Louisiana AI data centers, driving orders for switches optimized for all-reduce traffic.
- December 2025: Gluware shipped version 5.5 with native SONiC support, streamlining zero-touch provisioning across mixed-vendor estates.


Global SDN-Enabled Switch Market Report Scope
The SDN-enabled switch market refers to the global ecosystem of Ethernet switching hardware designed to operate within a Software-Defined Networking (SDN) architecture, where the control plane is decoupled from the data plane. These switches are centrally managed through software-based controllers, enabling dynamic traffic management, programmability, and automation across enterprise, data center, and service provider networks.
The SDN-Enabled Switch Market Report is Segmented by SDN Implementation Type (Pure SDN, Hybrid SDN, and Overlay-based SDN), Port Speed (1 GbE and Below, 2.5/5 GbE Multi-Gig, 10 GbE, 25/40 GbE, 100 GbE, and 400 GbE and Above), Network Layer (Access, Distribution, and Core), End-User (Cloud and Data Center Providers, Enterprise, Telecommunication Service Providers, Government and Defense, and Other End-Users), and Geography (North America, South America, Europe, Asia-Pacific, Middle East, and Africa). The Market Forecasts are Provided in Terms of Value (USD).
| Pure SDN Switches |
| Hybrid SDN Switches |
| Overlay-based SDN Switches |
| 1 GbE and Below |
| 2.5/5 GbE Multi-Gig |
| 10 GbE |
| 25/40 GbE |
| 100 GbE |
| 400 GbE and Above |
| Access |
| Distribution |
| Core |
| Cloud and Data Center Providers |
| Enterprise (Commercial Offices and Campuses) |
| Telecommunication Service Providers |
| Government and Defense |
| Other End Users |
| North America | United States |
| Canada | |
| Mexico | |
| South America | Brazil |
| Argentina | |
| Rest of South America | |
| Europe | Germany |
| United Kingdom | |
| France | |
| Italy | |
| Spain | |
| Russia | |
| Rest of Europe | |
| Asia-Pacific | China |
| Japan | |
| India | |
| South Korea | |
| Australia and New Zealand | |
| Rest of Asia-Pacific | |
| Middle East | Saudi Arabia |
| United Arab Emirates | |
| Turkey | |
| Rest of Middle East | |
| Africa | South Africa |
| Nigeria | |
| Rest of Africa |
| By SDN Implementation Type | Pure SDN Switches | |
| Hybrid SDN Switches | ||
| Overlay-based SDN Switches | ||
| By Port Speed | 1 GbE and Below | |
| 2.5/5 GbE Multi-Gig | ||
| 10 GbE | ||
| 25/40 GbE | ||
| 100 GbE | ||
| 400 GbE and Above | ||
| By Network Layer | Access | |
| Distribution | ||
| Core | ||
| By End User | Cloud and Data Center Providers | |
| Enterprise (Commercial Offices and Campuses) | ||
| Telecommunication Service Providers | ||
| Government and Defense | ||
| Other End Users | ||
| By Geography | North America | United States |
| Canada | ||
| Mexico | ||
| South America | Brazil | |
| Argentina | ||
| Rest of South America | ||
| Europe | Germany | |
| United Kingdom | ||
| France | ||
| Italy | ||
| Spain | ||
| Russia | ||
| Rest of Europe | ||
| Asia-Pacific | China | |
| Japan | ||
| India | ||
| South Korea | ||
| Australia and New Zealand | ||
| Rest of Asia-Pacific | ||
| Middle East | Saudi Arabia | |
| United Arab Emirates | ||
| Turkey | ||
| Rest of Middle East | ||
| Africa | South Africa | |
| Nigeria | ||
| Rest of Africa | ||


Key Questions Answered in the Report
How large is the SDN-enabled switch market today and where is it headed?
Mordor Intelligence values the market at USD 13.78 billion in 2026 and expects it to reach USD 24.62 billion by 2031, reflecting a 12.31% CAGR driven by hyperscale data-center expansion and 5G transport upgrades.
Which SDN implementation type currently dominates deployments?
Hybrid SDN switches held 48.72% revenue share in 2025 because enterprises prefer coexistence with legacy routing, according to Mordor Intelligence.
What port speed segment is growing the fastest?
The 400 GbE and above category is projected by Mordor Intelligence to advance at an 18.63% CAGR through 2031 as AI training clusters demand higher throughput.
Which end-user group will see the highest growth rate?
Telecommunications service providers are forecast by Mordor Intelligence to post a 13.52% CAGR through 2031 as 5G standalone cores adopt network-slicing.
Which region offers the most attractive growth opportunity?
Asia-Pacific shows the strongest outlook with a 15.94% CAGR to 2031, propelled by large-scale investments in India and ongoing hyperscale builds across Southeast Asia, per Mordor Intelligence.
Page last updated on:


