US-Canada Cross-Border Freight Transport Market Size and Share
Market Overview
| Study Period | 2020 - 2031 |
|---|---|
| Forecast Data Period | 2026 - 2031 |
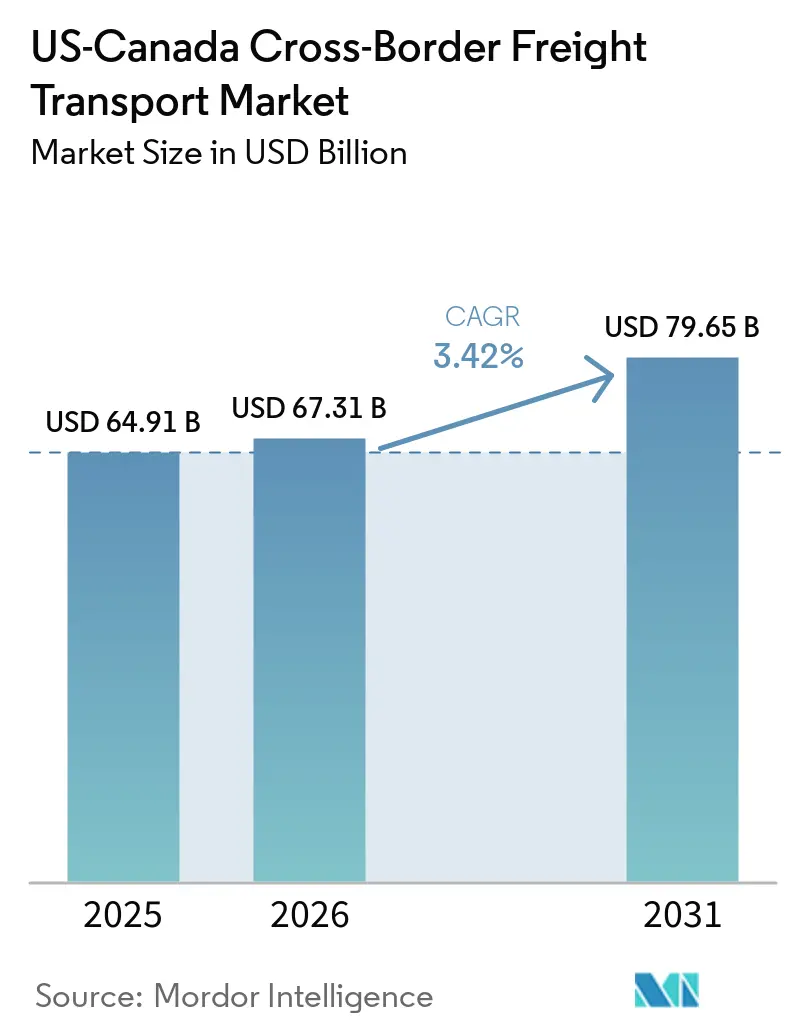
| Base Year Market Size (2025) | USD 64.91 Billion |
| Market Size (2026) | USD 67.31 Billion |
| Market Size (2031) | USD 79.65 Billion |
| Growth Rate (2026 - 2031) | 3.42% CAGR |
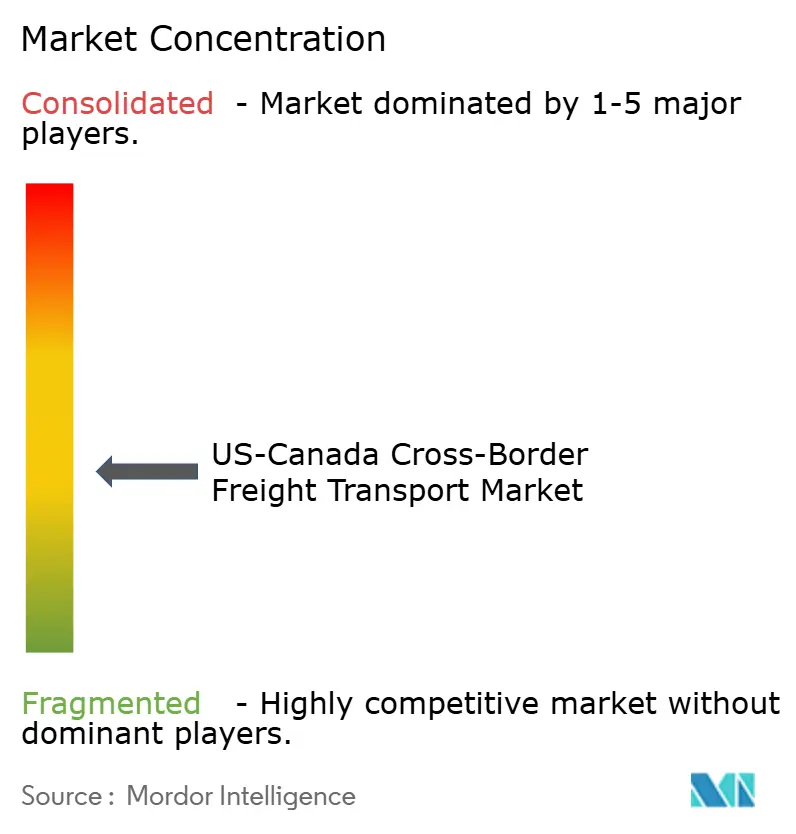
| Market Concentration | Medium |
Major Players *Disclaimer: Major Players sorted in no particular order Image © Mordor Intelligence. Reuse requires attribution under CC BY 4.0. | |
US-Canada Cross-Border Freight Transport Market Analysis by Mordor Intelligence
The US-Canada cross-border freight transport market size is expected to grow from USD 64.91 billion in 2025 to USD 67.31 billion in 2026 and is forecast to reach USD 79.65 billion by 2031 at a 3.42% CAGR over 2026-2031.
Resilient consumer spending in both countries, together with CUSMA-driven tightening of the rule of origin, is keeping freight volumes on an upward trajectory even as supply chain managers redesign networks to cut inventory dwell time. Digitized customs programs, such as the Automated Commercial Environment (ACE) and the Canada Border Services Agency single-window interface, are reducing average clearance time to under 15 minutes for compliant carriers, though capital-intensive technology requirements favor large incumbents. Persistent shortages of commercial drivers and mismatched northbound–southbound flows are sustaining rate premiums on the United States-to-Canada leg, prompting shippers to lock in multi-year, dedicated-capacity contracts. Infrastructure upgrades now under construction on Interstate 35, Interstate 94, and the Gordie Howe International Bridge promise future relief, yet near-term congestion continues to inflate operating costs for asset-based fleets.[1]U.S. Customs and Border Protection, “Automated Commercial Environment (ACE),” cbp.gov
Key Report Takeaways
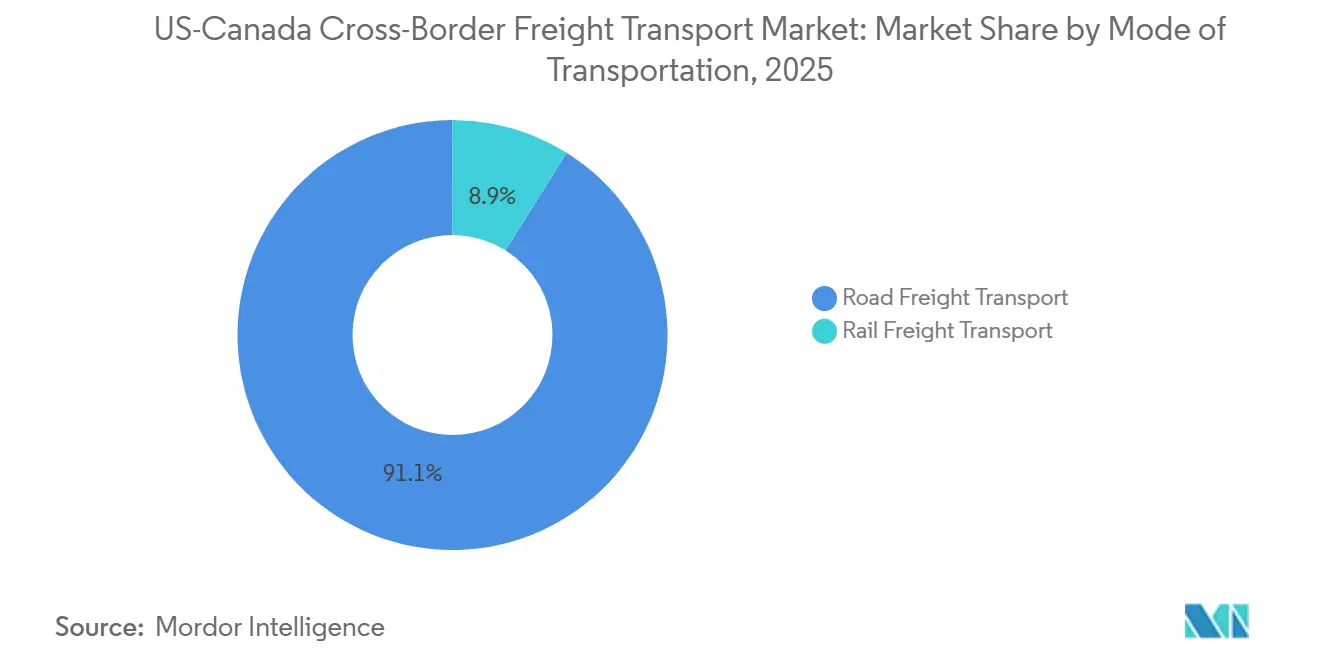
- By mode of transportation, road freight accounted for 91.09% of the US-Canada cross-border freight transport market in 2025 and is advancing at a 3.48% CAGR through 2031.
- By road freight transport, full truckload (FTL) led with a 78.68% share of the US-Canada cross-border freight transport market size in 2025, and less-than-truckload (LTL) is expanding at the fastest 3.84% CAGR to 2031.
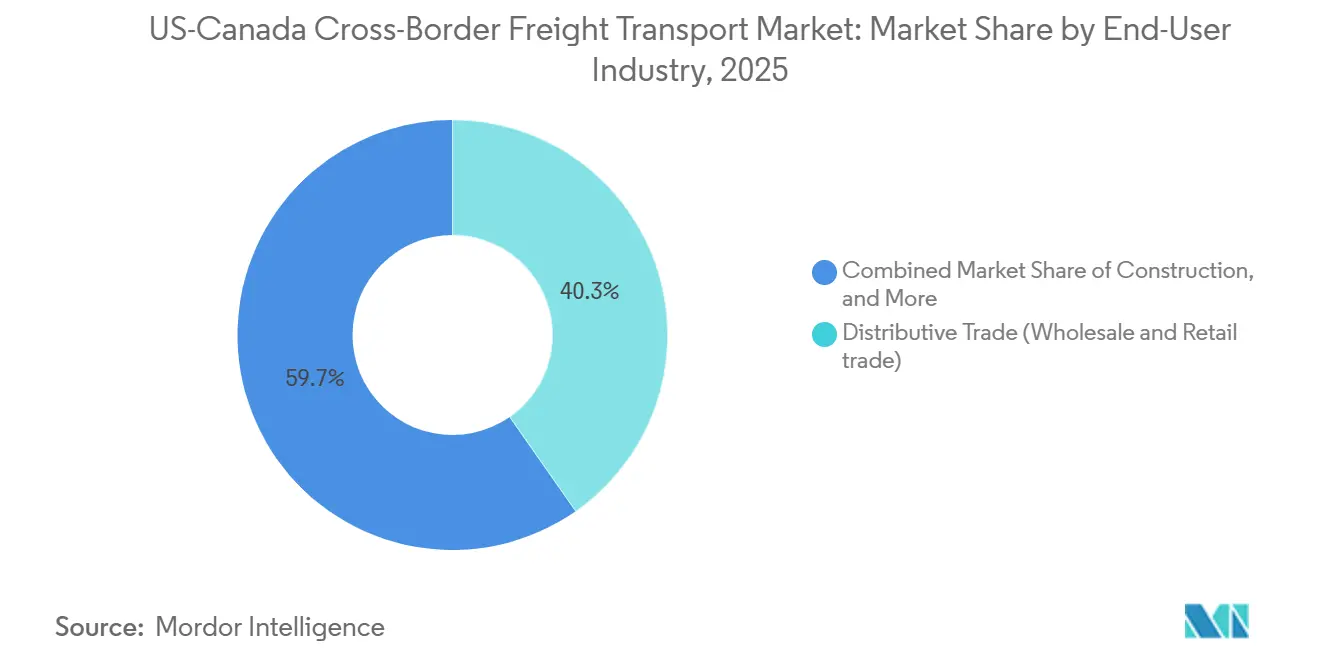
- By end-user industry, distributive trade commanded 40.28% of the US-Canada cross-border freight transport market share in 2025, while healthcare and pharmaceuticals are expanding at the fastest 5.12% CAGR to 2031.
- By cross-border lane, United States-to-Canada movements accounted for 60.03% of the US-Canada cross-border freight transport market in 2025; Canada-to-United States flows are projected to expand at a 3.81% CAGR between 2026 and 2031.
Note: Market size and forecast figures in this report are generated using Mordor Intelligence’s proprietary estimation framework, updated with the latest available data and insights as of January 2026.
US-Canada Cross-Border Freight Transport Market Trends and Insights
Drivers Impact Analysis*
| Drivers | (~) % Impact on CAGR Forecast | Geographic Relevance | Impact Timeline |
|---|---|---|---|
| OEM near-shoring of automotive supply chains | 0.9% | Ontario-Michigan corridor; Southern Ontario manufacturing belt | Medium term (2-4 years) |
| "E-commerce north" same-day delivery guarantees | 0.8% | Major metro pairs (Toronto-Buffalo, Vancouver-Seattle, Montreal-Burlington) | Short term (≤ 2 years) |
| CUSMA rules-of-origin tightening | 0.6% | Automotive-heavy lanes (Ontario-Michigan, Quebec-New York) | Long term (≥ 4 years) |
| Digitised e-Manifests & single-window customs | 0.5% | All major commercial crossings (Ambassador Bridge, Peace Bridge, Pacific Highway) | Short term (≤ 2 years) |
| Mid-continent trade corridor infrastructure upgrades | 0.4% | I-35 corridor (Texas-Manitoba), I-94 (Montana-Alberta), Pacific Northwest gateways | Long term (≥ 4 years) |
| Border infrastructure modernization and capacity expansion | 0.3% | Gordie Howe Bridge (Detroit-Windsor), Pacific Highway expansion (Blaine-Surrey) | Medium term (2-4 years) |
| Source: Mordor Intelligence | |||
OEM Near-Shoring of Automotive Supply Chains
Automakers are relocating part and module production to plants that satisfy CUSMA’s 75% regional value content threshold, concentrating freight into higher-volume corridors. In February 2026, General Motors invested USD 46 million to upgrade stamping operations for next-generation gas-powered pickups at its Oshawa, Ontario assembly plant, even as it trimmed shifts at the same facility earlier in the year, showing how re-investment and retrenchment can coexist. Stellantis likewise paused Brampton retooling in 2025 and redirected Jeep Compass production to the United States, shrinking northbound component moves while boosting southbound finished-vehicle hauls. Carriers with contract carriage and drop-and-hook fleets are better positioned to handle the surge-and-slump profile of parts demand, whereas spot-market players struggle to secure backhauls. Hours-of-Service limits imposed by the Federal Motor Carrier Safety Administration (FMCSA) still cap daily driving at 11 hours, making time-buffered relay points along the Ontario–Michigan corridor essential to maintaining just-in-time sequencing. Overall, near-shoring adds variability yet lifts total lane mileage, supporting incremental volume growth through 2031.
"E-Commerce North” Same-Day Delivery Guarantees
Consumer platforms now market two-day or even same-day delivery between major US and Canadian metros, forcing carriers to pre-position inventory in bonded facilities within 30 miles of high-volume crossings. Canada Post’s parcel market share had already eroded to 24% by 2024, even prior to its late-year labor disruptions, enabling private integrators such as FedEx and United Parcel Service to absorb volumes and re-optimize hub-and-spoke routes. FedEx integrated its Canada Ground unit into FedEx Express in 2024, eliminating intra-company hand-offs that had inflated northbound transit time by up to a full day. CBP’s forthcoming Electronic Truck Manifest mandate, scheduled for June 2026, allows compliant carriers to clear low-value shipments before arrival, compressing dwell time to below 15 minutes. Large integrators with proprietary brokerage systems will capture the lion’s share of those gains, widening cost gaps relative to regional LTL providers. The driver pool, already strained, must support additional night-shift and cross-dock operations to uphold 24-hour delivery promises.
CUSMA Rules-of-Origin Tightening
Labor Value Content requirements now require that 40-45% of the cost of an auto must originate from plants that pay at least USD 16 per hour. Canada’s retaliatory 25% tariff on US steel and aluminum, implemented in March 2025 and sustained even after broader trade rollbacks in September, further complicated compliance, prompting automakers to switch to in-region suppliers where possible. In late 2025, the Office of the United States Trade Representative enabled fully electronic origin certificates but increased data-granularity obligations, nudging shippers toward brokers that offer audit-ready documentation. For carriers, richer paperwork translates into longer pre-trip planning but reduces post-clearance disputes. As OEMs adjust bills of materials, component flows become less fragmented and more predictable, supporting higher trailer turn-rates.[2]Government of Canada, “Pricing Pollution: How It Will Work,” canada.ca
Digitized E-Manifests and Single-Window Customs
Full integration of the CBSA single-window and CBP-ACE platforms now allows real-time pre-arrival risk assessment. The ACE electronic ATA Carnet module launched in April 2026 lets trade-show exhibitors move equipment without standard entry paperwork, cutting processing time by 70%. CBSA’s automated CUSMA origin-verification engine runs tariff-line checks in seconds, slashing audit incidence and accelerating carrier accounts receivable cycles. Early adopters who connected back-office transportation management systems (TMS) via application programming interfaces report sub-15-minute crossings even during peak season. Carriers still using paper manifests face 60- to 90-minute waits, an efficiency penalty that is rapidly shrinking their addressable market share. The FMCSA and Transport Canada are piloting mutual recognition of electronic logging devices, an initiative that could eliminate redundant paperwork checks at the booth.[3]U.S. Customs and Border Protection, “Automated Commercial Environment (ACE),” cbp.gov
Restraints Impact Analysis*
| Restraints | (~) % Impact on CAGR Forecast | Geographic Relevance | Impact Timeline |
|---|---|---|---|
| Driver shortages & Hours-of-Service caps | -0.6% | US Midwest-Ontario corridor; Western Canada-Pacific Northwest | Short term (≤ 2 years) |
| Border inspection capacity bottlenecks | -0.4% | Ambassador Bridge (Detroit-Windsor), Peace Bridge (Buffalo-Fort Erie), Pacific Highway | Medium term (2-4 years) |
| Carbon-pricing surcharge divergence | -0.3% | Canada federal backstop provinces (Alberta, Saskatchewan, Manitoba, Ontario) | Long term (≥ 4 years) |
| Geopolitical trade policy uncertainty and tariff volatility | -0.2% | All cross-border lanes, particularly automotive and steel/aluminum sectors | Short term (≤ 2 years) |
| Source: Mordor Intelligence | |||
Driver Shortages and Hours-of-Service Caps
North America’s driver pool is aging out faster than replacements enter, pushing median ages to 47 in the United States and 49 in Canada. FMCSA limits of 11 hours behind the wheel and mandated 10-hour rest breaks effectively shrink daily range on cross-border hauls, forcing carriers to set up relay nodes or deploy two-person teams that raise line-haul cost by as much as 30%. While the double-digit wage hikes of the pandemic era have plateaued, driver compensation remains structurally elevated, and these higher baselines have yet to reverse the overall shortfall. Meanwhile, tighter medical-fitness rules have disqualified a growing share of applicants. Carriers are experimenting with driver-assist systems and automated gear-shifting to ease the workload, but full autonomy remains beyond the forecast horizon. Until recruitment pipelines stabilize, capacity constraints will remain the most immediate ceiling on volume growth.
Border Inspection Capacity Bottlenecks
Physical infrastructure has lagged freight growth at key crossings that together handle more than half of bilateral trade by value. Average queue times on the Ambassador Bridge can spike significantly during peak manufacturing shifts or system outages, wiping out some of the gains from paperless customs. The six-lane Gordie Howe International Bridge, entering service in late 2025, adds much-needed inspection plazas, yet may simply redistribute congestion if toll differentials push price-sensitive drivers toward lower-cost routes. Staffing budgets at both CBSA and CBP remain constrained, and new officers require up to nine months of training before full deployment. Trusted-trader programs such as FAST (Free and Secure Trade) provide priority lanes, but enrollment costs sideline many owner-operators. As volumes grow, these persistent infrastructure and staffing gaps remain a tangible ceiling on the market's overall growth potential.
*Our forecasts treat driver/restraint impacts as directional, not additive. The impact forecasts reflect baseline growth, mix effects, and variable interactions.
Segment Analysis
By Mode of Transportation: Road Dominance Reflects Just-in-Time Imperatives
Road freight accounted for 91.09% of the US-Canada cross-border freight transport market size in 2025, and is projected to grow at 3.48% CAGR through 2031, eclipsing rail and pipeline alternatives. Trucking’s supremacy stems from the just-in-time sequencing used by automotive and e-commerce supply chains, which cannot tolerate the 2- to 3-day dwell time typical of rail transloads. Major carriers like Old Dominion Freight Line and TFI International continue to expand their service centers near key crossings, such as the Ambassador and Peace Bridges, to strategically consolidate freight and minimize empty miles.
Rail remains the cost-efficient workhorse for grain, coal, and petroleum products moving through the mid-continent energy corridor. Canadian Pacific Kansas City’s merger created the only single-line network linking Canada, the United States, and Mexico, providing one-stop service for Houston-to-Toronto plastic resin shippers. Concurrently, Canadian National continues to leverage its extensive cross-border network to compete for intermodal traffic feeding US Midwest manufacturing hubs. Even so, shippers cite 3- to 5-day transits and limited final-mile options as barriers to converting from truck. Unless rapid-reloading intermodal terminals proliferate near the border, rail’s share will hover in the single digits.


By Road Freight Transport: Trucking’s outsized role underpins just-in-time trade
Full Truckload (FTL) dominated road movements, accounting for 78.68% of value, due to contract-dedicated lanes that shuttle powertrain modules, stamped metal, and finished vehicles between Southern Ontario and the US Midwest. Less-than-Truckload (LTL) is the fastest-growing road sub-segment, expanding at a 3.84% CAGR through 2026-2031 as e-commerce sellers split orders into smaller, higher-frequency shipments. The push for 24-hour delivery is encouraging integrators such as FedEx and UPS to pre-position inventory in bonded hubs near major crossings, such as the Ambassador and Peace Bridges, leveraging Automated Commercial Environment (ACE) compliance to significantly reduce border dwell times. Driver shortages persist, yet fleets that guarantee home-daily routes near border crossings are filling seats faster and securing rate premiums that offset wage inflation.
Technology further widens performance gaps inside the road segment. Carriers that link transportation management systems directly to the CBSA single-window platform achieve highly expedited crossings even during seasonal peaks, whereas paper-manifest operators experience much longer idle times. Major LTL carriers continue to invest heavily in cross-dock facilities near key border gateways, consolidating northbound and southbound freight to optimize linehaul density and reduce empty-mile ratios. Furthermore, cross-border fleets increasingly utilize regional relay yards to shorten average haul lengths, strategically keeping trips within the FMCSA’s 11-hour Hours-of-Service limit to maximize tractor utilization.
By End-User Industry: Distributive Trade Leads, Healthcare Accelerates
Distributive trade held a 40.28% of the US-Canada cross-border freight transport market share in 2025, riding a surge in electronics, apparel, and fast-moving consumer goods. Retailers increasingly treat the two-nation corridor as a highly integrated fulfillment zone, leveraging cross-border logistics and customs provisions such as Section 321 to accelerate regional deliveries. The fastest-growing end-user is healthcare and pharmaceuticals, projected to log a 5.12% CAGR between 2026 and 2031. Close regulatory alignment and information-sharing between Health Canada and the US Food and Drug Administration streamlines compliance, enabling drug makers to consolidate plants serving both markets via multi-temperature reefers. Major logistics providers continue to expand validated cold-chain capacity across the corridor to capture rising biologic flows.
Manufacturing and automotive remain volume pillars but exhibit mixed momentum as OEMs shuffle model allocations to balance labor cost, tariff exposure, and battery logistics. General Motors previously shifted Chevrolet Equinox production to Mexico while retooling its Ontario capacity for electric vehicles, illustrating a move toward component centralization alongside the dispersal of assembly. Forestry exports from British Columbia and Quebec ride US housing starts, contributing to seasonal volume surges that tighten capacity during the warmer months. Energy bulk freight crude oil, natural-gas liquids, diluted bitumen adds steady baseline volume but seldom fills high-margin trailers, limiting upside for carriers chasing yield.
By Cross-Border Lane : Persistent imbalance shapes pricing power
United States-to-Canada routes captured 60.03% of the US-Canada cross-border freight transport market share in 2025, reflecting US export strength in consumer goods, automotive parts, and processed foods. This volume dominance allows carriers to charge a 10-15% northbound rate premium to hedge against empty backhauls. Southbound Canada-to-United States traffic, while smaller today, is forecast to expand at a 3.81% CAGR as industrial materials, lumber, and active pharmaceutical ingredients stream toward US manufacturing hubs and East Coast distribution centers. The rising southbound share is already boosting backhaul utilization, squeezing the historical rate spread and nudging brokers to lock in multi-year, round-trip contracts.
Infrastructure and policy changes will recalibrate lane economics over the forecast period. The six-lane Gordie Howe International Bridge, opening late 2025, is expected to cut Detroit–Windsor crossing times by up to 30% for FAST-enrolled fleets, reducing queuing that historically delayed time-sensitive freight. Carbon-pricing divergence, however, still adds roughly USD 0.50 per gallon to diesel burned on the Canadian leg. Because the International Fuel Tax Agreement (IFTA) mandates taxes based on miles driven by jurisdiction, carriers cannot avoid them through US registration, prompting widespread use of localized fuel surcharges on cross-border moves. Digital e-Manifest mandates will benefit high-volume lanes first, letting compliant carriers pre-clear both directions and shave at least 15 minutes per crossing, a saving that compounds quickly for parcel integrators running 10-plus loops a day. As southbound volumes climb, the lane split will move gradually toward equilibrium, tempering rate volatility yet preserving incentives for carriers that can orchestrate perfectly balanced round trips.
Geography Analysis
Canada-to-United States southbound traffic, projected to advance significantly through 2031, continues to leverage the nation’s comparative advantages in energy, forestry, and specialized pharmaceuticals. Alberta’s oil sands ship crude and diluent south via pipeline and manifest rail, guaranteeing base load even as price volatility nudges modal splits. Quebec’s pharma cluster exports active pharmaceutical ingredients under reciprocal GMP protocols, shortening shelf-to-patient cycles. Forestry flows from British Columbia, and Quebec meet the United States construction demand for dimensional lumber and corrugated packaging, with rates spiking each summer building season.
Northbound United States-to-Canada moves still amarket value in 2025, reflecting American supply dominance in consumer staples, processed foods, and automotive sub-assemblies. The imbalance inflates US outbound rates by 10-15% as carriers factor in the risk of empty returns. Shippers increasingly book round-trip contracts that obligate carriers to return fertilizer or food ingredients to Canada, nudging the empty-mile rate downward over time. The six-lane Gordie Howe International Bridge, slated for a late 2025 opening, is expected to reduce crossing time by 20-30% for FAST-enrolled fleets. However, its toll structure could drive price-sensitive operators back to the incumbent, the Ambassador Bridge.
Cross-border trade remains concentrated along three mega-corridors. The Southern Ontario–United States Midwest cluster anchors automotive and heavy machinery moves. The Pacific Northwest lane, linking Vancouver to Seattle and Portland, is e-commerce-heavy and increasingly temperature-controlled for seafood and produce. The Prairie-Great Plains axis funnels grain, oil, and fertilizer along I-35 toward Gulf Coast refineries. Each corridor faces distinct chokepoints from bridge queues in Windsor to winter weather on the High Plains, requiring carriers to fine-tune asset deployment and reserve surge capacity during peak seasons.[4]Transport Canada, “Gordie Howe International Bridge Project Update,” tc.gc.ca
Competitive Landscape
The US-Canada cross-border freight transport market is moderately fragmented, with the ten largest operators capturing a significant but minority share of total revenue, falling well short of the concentration levels required for oligopolistic control. Integrated parcel giants such as FedEx, UPS, and Purolator dominate high-value, time-critical lanes, capitalizing on end-to-end customs brokerage, proprietary linehaul, and aircraft belly capacity. TFI International, Schneider National, and J.B. Hunt leverage large tractor fleets and drop-trailer pools to lock in automotive and big-box retail contracts that guarantee round-trip utilization.
Asset-light brokers such as C.H. Robinson and XPO Logistics aggregate spot-market freight, applying algorithmic pricing and predictive border-delay analytics to squeeze margin from volatility others avoid. Rail incumbents CN and Canadian Pacific Kansas City fill the bulk commodities niche, yet poach truck freight when shippers prioritize cost over speed. Technology now separates winners from laggards: fleets that deploy real-time visibility APIs, electronic logging integration, and machine-learning-based customs-document validation report on-time delivery gains of 2-3 percentage points.
The US-Canada cross-Border Freight Transport market is moderately fragmented, with the ten largest operators capturing a significant but minority share of total revenue, falling well short of the concentration levels required for oligopolistic control. Integrated parcel giants such as FedEx, UPS, and Purolator dominate high-value, time-critical lanes, capitalizing on end-to-end customs brokerage, proprietary linehaul, and aircraft belly capacity. TFI International, Schneider National, and J.B. Hunt leverage large tractor fleets and drop-trailer pools to lock in automotive and big-box retail contracts that guarantee round-trip utilization.e of scale.
US-Canada Cross-Border Freight Transport Industry Leaders
Canadian National Railway Company
FedEx
United Parcel Service of America, Inc. (UPS)
C.H. Robinson Worldwide, Inc.
Canadian Pacific Kansas City Limited
- *Disclaimer: Major Players sorted in no particular order

Recent Industry Developments
- April 2026: General Motors committed USD 505 million (CAD 691 million) to produce next-generation V-8 engines at its St. Catharines, Ontario powertrain plant, signaling a major recommitment to internal combustion truck and SUV production in the region.
- March 2026: US Customs and Border Protection rolled out the electronic ATA Carnet module inside the ACE Truck Manifest portal, slashing clearance time for temporary imports of professional equipment by digitizing previously paper-heavy processes.
- October 2025: Stellantis shifted next-generation Jeep Compass assembly from Brampton, Ontario to a US facility in Illinois, cutting northbound component freight but boosting southbound finished-vehicle exports.
- October 2025: Canada reduced tariff-free import quotas for General Motors and Stellantis by up to 50% in response to domestic production cuts, signaling a willingness to deploy trade policy defensively to protect its automotive manufacturing base.


US-Canada Cross-Border Freight Transport Market Report Scope
| Road Freight Transport | Full Truckload (FTL) |
| Less-than-Truckload (LTL) | |
| Rail Freight Transport |
| Agriculture, Fishing, and Forestry |
| Construction |
| Distributive Trade (Wholesale and Retail trade) |
| Healthcare and Pharmaceutical |
| Manufacturing and Automotive |
| Oil and Gas, Mining and Quarrying |
| Other End-user Industries |
| United States to Canada |
| Canada to United States |
| By Mode of Transportation | Road Freight Transport | Full Truckload (FTL) |
| Less-than-Truckload (LTL) | ||
| Rail Freight Transport | ||
| By End-User Industry | Agriculture, Fishing, and Forestry | |
| Construction | ||
| Distributive Trade (Wholesale and Retail trade) | ||
| Healthcare and Pharmaceutical | ||
| Manufacturing and Automotive | ||
| Oil and Gas, Mining and Quarrying | ||
| Other End-user Industries | ||
| By Cross-Border Lane | United States to Canada | |
| Canada to United States |


Key Questions Answered in the Report
How large is the US-Canada Cross-Border Freight Transport market in 2026?
The US-Canada cross-border freight transport market size is USD 67.31 billion in 2026 and is on track to reach USD 79.65 billion by 2031.
Which mode of transport carries the most cross-border freight?
Road freight dominates with 91.09% market share in 2025, thanks to the flexibility needed for automotive and e-commerce supply chains.
What is the fastest-growing end-user segment?
Healthcare and pharmaceuticals lead growth at a 5.12% CAGR through 2026-2031 as biologics and temperature-controlled drugs drive demand.
Why are northbound freight rates higher than southbound?
US exports outweigh Canadian backhaul volumes, so carriers charge a 10-15% premium on northbound hauls to absorb the risk of empty miles.
How will the Gordie Howe International Bridge affect transit times?
The six-lane span is expected to cut crossing times by up to 30% for FAST-enrolled fleets once it opens in late 2025, improving reliability on the busy Detroit-Windsor corridor.
What impact does carbon pricing have on carriers?
Canadian carbon levies add about USD 0.50 per gallon to diesel costs inside Canada, putting Canadian-based fleets at a cost disadvantage versus US rivals that operate under a patchwork of state-level rules.
Page last updated on:


