Market Overview
| Study Period | 2020 - 2031 |
|---|---|
| Forecast Data Period | 2026 - 2031 |
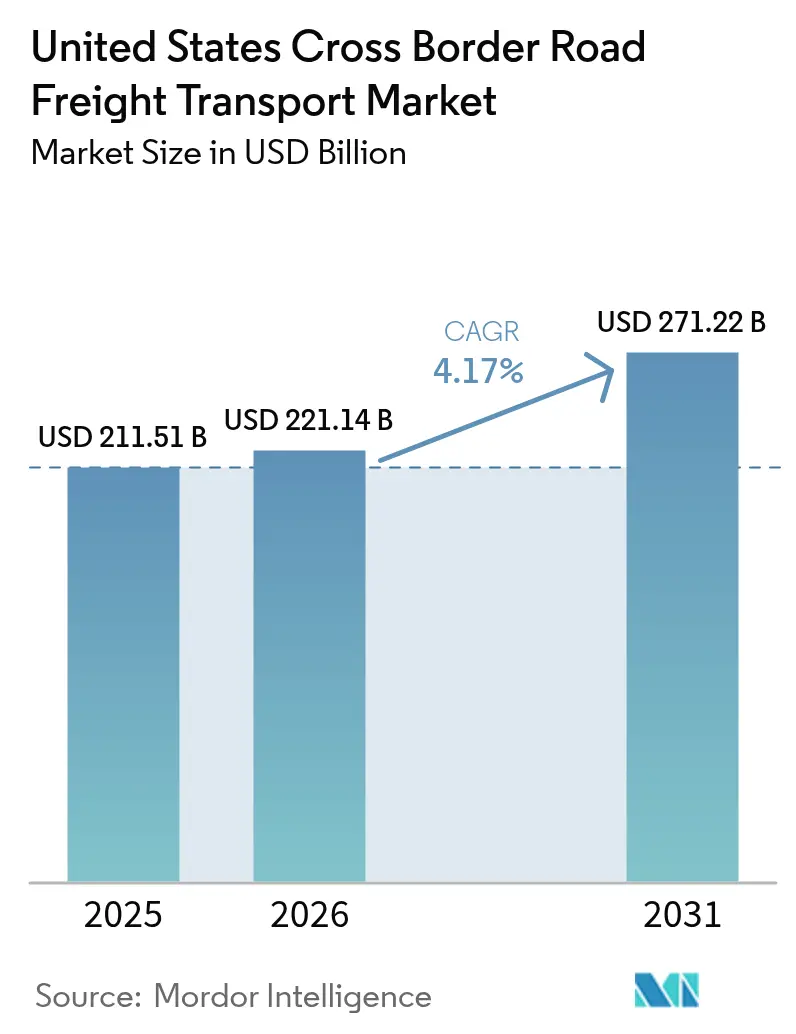
| Base Year Market Size (2025) | USD 211.51 Billion |
| Market Size (2026) | USD 221.14 Billion |
| Market Size (2031) | USD 271.22 Billion |
| Growth Rate (2026 - 2031) | 4.17% CAGR |
| Market Concentration | Low |
Major Players *Disclaimer: Major Players sorted in no particular order Image © Mordor Intelligence. Reuse requires attribution under CC BY 4.0. | |
United States Cross Border Road Freight Transport Market Analysis by Mordor Intelligence
The United States cross-border road freight transport market size is projected to expand from USD 211.51 billion in 2025 and USD 221.15 billion in 2026 to USD 271.22 billion by 2031, registering a CAGR of 4.17% between 2026 and 2031. Inflation Reduction Act incentives are reshaping freight corridors, cold-chain demand is intensifying, and electronic documentation pilots are compressing transit times. Dedicated hazmat lanes for lithium-ion batteries and high-specification reefer capacity for pharmaceuticals are attracting premium pricing. Meanwhile, regulatory coordination between U.S. and Mexican agencies is cutting repeat inspections and shortening border dwell times, although infrastructure shortfalls and zero-emission mandates are adding cost pressure. Consolidation led by global forwarders signals a shift toward scale-driven network economics, but niche specialists continue to flourish in temperature-controlled, reverse-logistics, and hazmat sub-segments. These cross-currents position the United States cross-border road freight transport market for steady, supply-chain-led expansion through 2031.
Key Report Takeaways
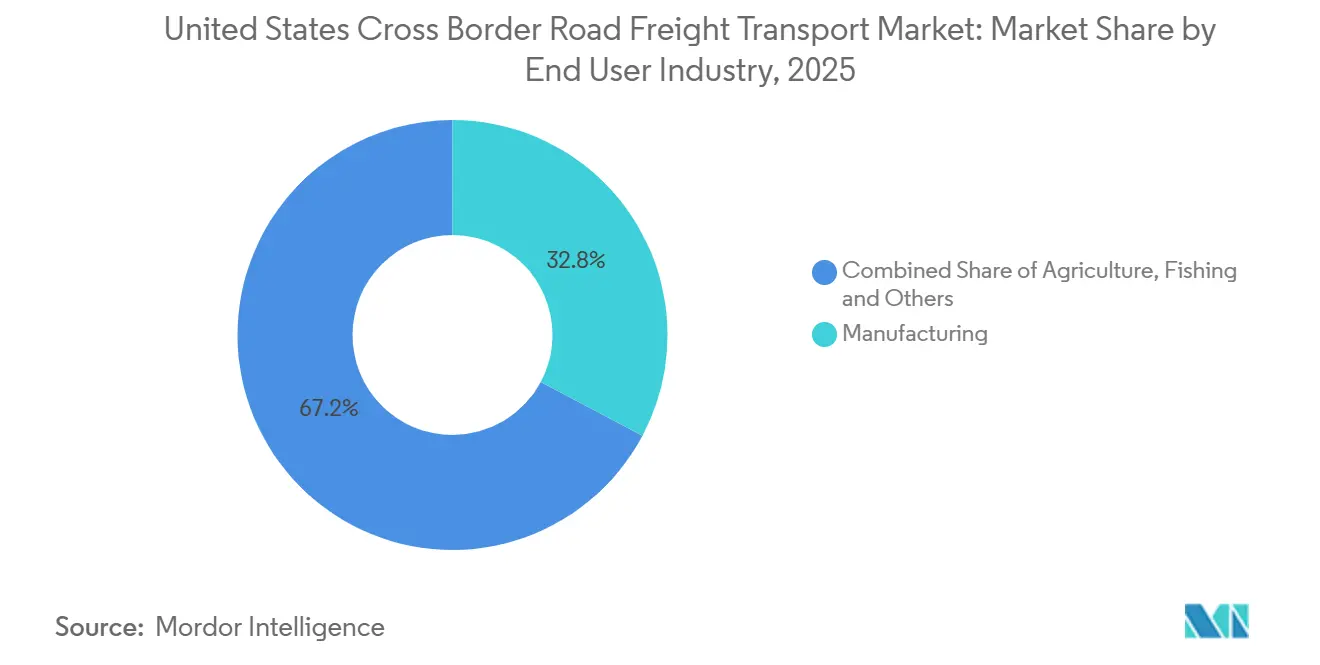
- By end user, manufacturing captured 32.77% of the United States cross-border road freight transport market share in 2025, while Wholesale and Retail Trade is forecast to expand at a 4.92% CAGR through 2031.
- By truckload specification, full-truck-load (FTL) captured 79.18% of the revenue share in 2025, while less-than-truck-load (LTL) is forecast to expand at a 5.02% CAGR through 2031.
- By containerization, non-containerized captured 85.27% of the revenue share in 2025, while containerized is forecast to expand at a 4.81% CAGR through 2031.
- By distance, long haul captured 69.20% of the United States cross-border road freight transport market size in 2025, while short Haul is forecast to expand at a 5.10% CAGR through 2031.
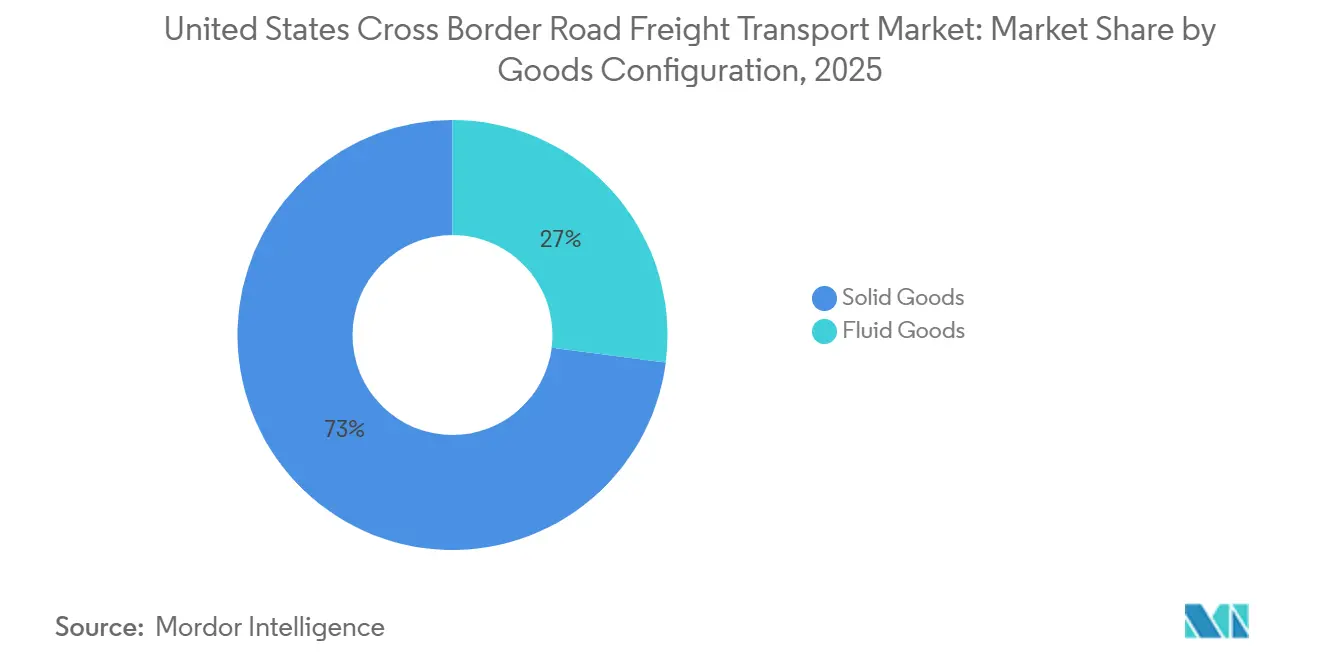
- By goods configuration, solids captured 72.96% of the revenue size in 2025, while fluids are forecast to expand at a 4.74% CAGR through 2031.
- By temperature control, non-temperature-controlled captured 94.61% of the revenue share in 2025, while temperature-controlled is forecast to expand at a 4.89% CAGR through 2031.
Note: Market size and forecast figures in this report are generated using Mordor Intelligence’s proprietary estimation framework, updated with the latest available data and insights as of 2026.
United States Cross Border Road Freight Transport Market Trends and Insights
Drivers Impact Analysis*
| Driver | (~) % Impact on CAGR Forecast | Geographic Relevance | Impact Timeline |
|---|---|---|---|
| IRA-driven North-American EV battery supply-chain flows | 1.1% | Mexico battery belt (Nuevo León, Coahuila), US Midwest assembly hubs | Medium term (2-4 years) |
| Cold-chain expansion for high-value biologics & produce | 0.8% | US-Mexico border states, pharmaceutical corridors | Medium term (2-4 years) |
| Near-border industrial parks are accelerating south-north OEM shipments | 0.9% | Within a 50-mile radius of Laredo, Otay Mesa, and El Paso crossings | Short term (≤ 2 years) |
| Harmonized USDA-SENASICA phytosanitary protocols cutting border re-inspections | 0.5% | Agricultural trade corridors, Texas-Mexico crossings | Short term (≤ 2 years) |
| Reverse-logistics boom from cross-border e-commerce returns | 0.6% | US-Mexico border distribution hubs, returns processing centers | Medium term (2-4 years) |
| E-CMR & blockchain pilots slashing documentation lead-time | 0.4% | Major border crossings with digital infrastructure | Long term (≥ 4 years) |
| Source: Mordor Intelligence | |||
IRA-Driven North-American EV Battery Supply-Chain Flows
North American battery makers have pledged USD 110 billion in capacity through 2027, with 43% of new gigafactories sited in Mexico. Dedicated hazmat-certified lanes now move 2.4 million tons of lithium-ion cells annually, a 287% jump since 2023. Temperature-stabilized trailers maintain 15-25 °C ranges, and real-time shock monitoring meets UN 3480 packaging rules. With the USD 7,500 tax credit tied to regional content, automotive assemblers forecast 22% yearly growth in cross-border battery moves through 2030, and carriers earn 35-40% rate premiums for this traffic[1]International Trade Administration, “Cold Chain Logistics Opportunities in North America,” trade.gov.
Cold-Chain Expansion for High-Value Biologics and Produce
Pharmaceutical cold-chain volume crossing the border surged 124% since 2022 as biologics plants in Jalisco and Toluca feed U.S. demand. Reefer utilization tops 92% on northbound lanes versus the 78% truckload average, lifting spot rates 18-25% above dry-van benchmarks. Mexican avocado and berry exports worth USD 14.8 billion in 2024 require continuous 2-8 °C integrity, and carriers pre-certified under FDA-COFEPRIS criteria clear customs 40% faster than peers[2]USDA Animal and Plant Health Inspection Service, “Mexico Phytosanitary Agreement Achievements,” aphis.usda.gov.
Near-Border Industrial Parks Accelerating South-North OEM Shipments
Industrial real estate within 50 miles of key crossings absorbed 47 million ft² in 2024. Facilities in Nuevo Laredo and Otay Mesa cut plant-to-border transit to under seven hours and reduce empty miles on backhauls from 38% to 22%. OEM clustering saves 23-28% in logistics cost compared with interior Mexican sites and lowers CO₂ emissions by 31% thanks to shorter hauls.
Harmonized USDA-SENASICA Phytosanitary Protocols Cutting Border Re-inspections
The 2023 mutual-recognition pact covers 47 produce categories and trims physical inspection rates from 42% to 14% for certified shippers. Average crossing time for tomatoes and peppers fell from 4.2 hours to 2.8 hours, while spoilage dropped 1.7 points. Forwarders report 15-20% freight cost savings as dwell and insurance charges recede.
Restraints Impact Analysis*
| Restraint | (≈) % Impact on CAGR Forecast | Geographic Relevance | Impact Timeline |
|---|---|---|---|
| Chronic truck-parking deficit at Laredo, El Paso & Detroit ports | -0.6% | Major border crossings with high commercial traffic | Short term (≤ 2 years) |
| California ACF & CARB rules are raising compliance costs for cross-border fleets | -0.5% | California border crossings, Pacific Southwest corridor | Long term (≥ 4 years) |
| Ad-hoc border security operations are causing volatile dwell times | -0.4% | All US-Mexico and US-Canada border crossings | Short term (≤ 2 years) |
| Limited cargo-insurance penetration in Mexico is heightening risk exposure | -0.3% | Mexico-originating freight, high-value cargo lanes | Medium term (2-4 years) |
| Source: Mordor Intelligence | |||
Chronic Truck-Parking Deficit at Laredo, El Paso, and Detroit Ports
Secure spaces cover only 42% of peak demand, forcing detours of up to 50 miles. At Laredo’s World Trade Bridge, 14,000 commercial moves vie for 340 spaces, lengthening dwell by 3.2 hours. The Bipartisan Infrastructure Law sets aside USD 185 million for relief, but capacity will not come online until 2027.
California ACF and CARB Rules Raising Compliance Costs for Cross-Border Fleets
Large fleets must buy only zero-emission trucks after 2036, adding USD 180,000-240,000 per Class 8 unit. Drayage rules already bar pre-2010 diesels, prompting early retirement of 18,000 trucks. Just 340 public heavy-duty chargers serve the state against a need for 2,100 by 2030[3]California Air Resources Board, “Advanced Clean Fleets Regulation Implementation,” ww2.arb.ca.gov.
*Our forecasts treat driver/restraint impacts as directional, not additive. The impact forecasts reflect baseline growth, mix effects, and variable interactions.
Segment Analysis
By End User Industry: Manufacturing Anchors Growth While Retail Gains Pace
Manufacturing captured 32.77% of the United States cross-border road freight transport market share in 2025 by value. Automotive and electronics OEMs run synchronized flows that rely on 99% on-time delivery targets and account for the largest block of hazmat battery moves.
Wholesale and retail trade is the fastest climber, expanding at a 4.92% CAGR to 2031. E-commerce now fuels 56% of retail sales growth, and reverse-logistics returns alone move 2.8 million parcels each month. Retail shippers use contract LTL and consolidation hubs to bridge customer-facing service promises with border security requirements. Construction freight mirrors federal infrastructure cycles, while oil and gas volumes track refinery turnarounds and pipeline outages.


By Truckload Specification: FTL Dominates but Digital LTL Rises
Full-truck-load services held 79.18% of the United States cross-border road freight transport market size in 2025, thanks to scale economies in automotive, bulk commodity, and machinery moves. The segment benefits from dedicated lanes, drop-and-hook operations, and higher asset turns.
Less-than-truck-load volumes are expanding at a 5.02% CAGR to 2031. Digital marketplaces match fragmented shipper demand to carrier capacity, cutting empty miles to 18%. The United States cross border road freight transport industry is witnessing heavy investment in border-region consolidation docks, with USD 180 million poured into Laredo and El Paso facilities during 2024. Returns processing and small-parcel e-commerce are the engines behind this ascent.
By Containerization: Direct Trucking Prevails, Yet Intermodal Gains Traction
Non-containerized moves represented 85.27% of the United States cross-border road freight transport market share in 2025, reflecting the preference for direct, sealed truck transit on tight automotive and electronics timetables. Door-to-door trucking saves 18-24 hours over rail-truck alternatives between Monterrey and Dallas.
Containerized freight is growing at 4.81% CAGR to 2031. Asian imports discharged at Mexican Pacific ports now ride rail inland before trucking into the United States, taking advantage of capacity headroom at border intermodal ramps. Blockchain tracking has shortened paperwork by 62%, making intermodal transport more competitive in terms of reliability.
By Distance: Long-Haul Corridors Drive Volume, Short-Haul Lanes Gain Density
Long-haul routes secured 69.20% of total value in 2025, reflecting their critical role in moving high-volume freight across vast distances. Lanes from the Bajío to the U.S. Midwest, stretching roughly 1,400 miles, are increasingly benefiting from technological advancements such as autonomous pilot systems on Interstate 45, hinting at significant future labor savings and enhanced operational efficiency.
Meanwhile, short-haul operations are showing strong momentum, projected to grow at a 5.10% CAGR through 2031. This growth is driven by manufacturers strategically clustering near key border crossings, allowing for faster turnaround and just-in-time delivery. Daily home-time schedules make short-haul roles more attractive to drivers, helping mitigate but not entirely offset a labor shortage expected to reach 160,000 by 2032.
By Goods Configuration: Solid Goods Predominate; Fluid Freight Grows in Chemicals
Solid goods commanded 72.96% in 2025 and mirror the manufacturing tilt of bilateral trade. Palletized auto parts and boxed electronics achieve up to 96% cube utilization, helping carriers keep cost per unit low. High levels of standardization in packaging and handling further streamline cross-border logistics, reducing dwell times at ports and distribution hubs. Additionally, consistent demand patterns in the automotive and consumer electronics sectors provide carriers with predictable volumes, enabling better route optimization and asset utilization.
Fluid goods are progressing at 4.74% CAGR to 2031 as refined fuels and chemical intermediates move by stainless-steel tanker. Specialized hazmat rules and asset scarcity support 15-22% rate premiums. Food-grade liquids such as edible oils add cleaning-cycle downtime that pushes costs an additional USD 340–480 per load.
By Temperature Control: Cold Chain Gains Share from Ambient Freight
Non-temperature-controlled freight dominated with 94.61% share in 2025. Automotive, electronics, and general merchandise continue to move ambient. This segment benefits from lower operating costs and simpler handling requirements, as it does not rely on specialized refrigeration equipment or monitoring systems. As a result, carriers can scale capacity more efficiently and maintain higher fleet availability across major trade corridors.
Temperature-controlled traffic is growing at 4.89% CAGR to 2031. Reefer trailers operate above 92% utilization on northbound lanes, and biologics producers require GDP-compliant sensors and backup units. Pre-validated carriers record 40% faster customs release, reinforcing competitive advantage
Geography Analysis
Southern border lanes with Mexico generated 72% of surface trade value in 2024. Laredo processed USD 283 billion, and infrastructure projects worth USD 1.8 billion aim to cut wait times by two-thirds when Otay Mesa East opens in 2027. Dedicated lithium-ion corridors from Nuevo León and Coahuila to Midwest assembly plants run hazmat-certified fleets under strict temperature controls.
Northern routes with Canada moved USD 382 billion in 2024. Detroit, Buffalo, and Blaine handle 60% of the traffic, dominated by automotive parts. A USD 33.2 million expansion at the Pacific Highway crossing will add four primary lanes by late 2026. Wildfire-related closures in British Columbia forced 240-mile detours in 2024 and raised per-load cost by up to USD 580.
Digital-document pilots are most advanced at high-volume southern crossings, slashing border processing 62% for enrolled fleets. Cold-chain infrastructure spans both borders but is densest near Laredo and Pharr, where GDP-compliant carriers save two hours per crossing on average. Carrier selection increasingly hinges on corridor specialization that balances regulatory variance, security risk, and equipment mix across the trinational network[4]Texas Department of Transportation, “Laredo World Trade Bridge Statistics 2024,” txdot.gov.
Competitive Landscape
Market concentration is low, with the top five carriers controlling just under 30% of cross-border revenue.Technology is the main differentiator, as fleets using blockchain and e-CMR shave customs clearance by 62% and secure higher on-time scores.
Vertical integration is deepening. C.H. Robinson and XPO fold warehousing and brokerage into transportation to offer one-stop managed logistics, winning higher-margin contracts. Cold-chain, reverse-logistics, and battery hazmat lanes remain niche strongholds for specialists who leverage equipment depth and regulatory expertise. Driver recruitment tactics such as home-daily routes and USD 75,000-95,000 compensation attract talent 2.3 times faster than the industry norm.
Regulation creates both hurdles and openings. California’s zero-emission mandate strains smaller fleets with steep capital outlays, accelerating consolidation. FAST and C-TPAT credentials are now baseline requirements, covering 52% of imports and cutting clearance 40%. Market entrants must weigh the cost of compliance and technology adoption against opportunities in underserved, high-specification lanes.
United States Cross Border Road Freight Transport Industry Leaders
Schneider National, Inc.
C.H. Robinson Worldwide, Inc.
J.B. Hunt Transport, Inc.
United Parcel Service of America, Inc. (UPS)
FedEx Freight
- *Disclaimer: Major Players sorted in no particular order

Recent Industry Developments
- March 2026: Fedex Expanded cross border services via FedEx Trade Networks to support shifting manufacturing and nearshoring trends (e.g., lanes between the United States and Mexico/Vietnam).
- May 2025: J.B. Hunt, BNSF Railway & GMXT launched “Quantum de México” cross border intermodal service, improving U.S.–Mexico freight flows and lowering carbon footprint.
- March 2025: DSV completed its EUR 14.3 billion (USD 15.7 billion) purchase of DB Schenker, pledging EUR 1 billion for German hubs while boosting North American cross-border reach.
- January 2025: Knight-Swift bought ten Yellow Corp. terminals for USD 2.2 million to scale its LTL footprint across six states.


United States Cross Border Road Freight Transport Market Report Scope
End User Industry
| Agriculture, Fishing, and Forestry |
| Construction |
| Manufacturing |
| Oil and Gas, Mining and Quarrying |
| Wholesale and Retail Trade |
| Others |
Truckload Specification
| Full-Truck-Load (FTL) |
| Less than-Truck-Load (LTL) |
Containerization
| Containerized |
| Non-Containerized |
Distance
| Long Haul |
| Short Haul |
Goods Configuration
| Fluid Goods |
| Solid Goods |
Temperature Control
| Non-Temperature Controlled |
| Temperature Controlled |
| End User Industry | Agriculture, Fishing, and Forestry |
| Construction | |
| Manufacturing | |
| Oil and Gas, Mining and Quarrying | |
| Wholesale and Retail Trade | |
| Others | |
| Truckload Specification | Full-Truck-Load (FTL) |
| Less than-Truck-Load (LTL) | |
| Containerization | Containerized |
| Non-Containerized | |
| Distance | Long Haul |
| Short Haul | |
| Goods Configuration | Fluid Goods |
| Solid Goods | |
| Temperature Control | Non-Temperature Controlled |
| Temperature Controlled |


Key Questions Answered in the Report
What is the current value of the United States cross border road freight transport market?
The market stands at USD 221.14 billion in 2026 and is forecast to reach USD 271.22 billion by 2031.
How fast is cross-border LTL freight growing?
Less-than-truck-load services are expanding at 5.02% CAGR as e-commerce returns and digital platforms raise demand.
Which end-user sector moves the most cross-border freight?
Manufacturing leads with 32.77% share, driven by automotive and electronics supply chains.
What impact do California zero-emission rules have on fleets?
Compliance adds USD 180,000-240,000 per new Class 8 truck and is accelerating consolidation among carriers.
Why is cold-chain freight a growth hotspot?
Biologics, plants, and premium produce exports require strict 2-8 °C control, pushing reefer utilization above 92% and supporting rate premiums.
How does electronic documentation affect border clearance?
Blockchain bills of lading and e-CMR notes shorten paperwork by 62% and cut cash-conversion cycles from 45 days to 12 days. |
Page last updated on:


