Market Overview
| Study Period | 2020 - 2031 |
|---|---|
| Forecast Data Period | 2026 - 2031 |
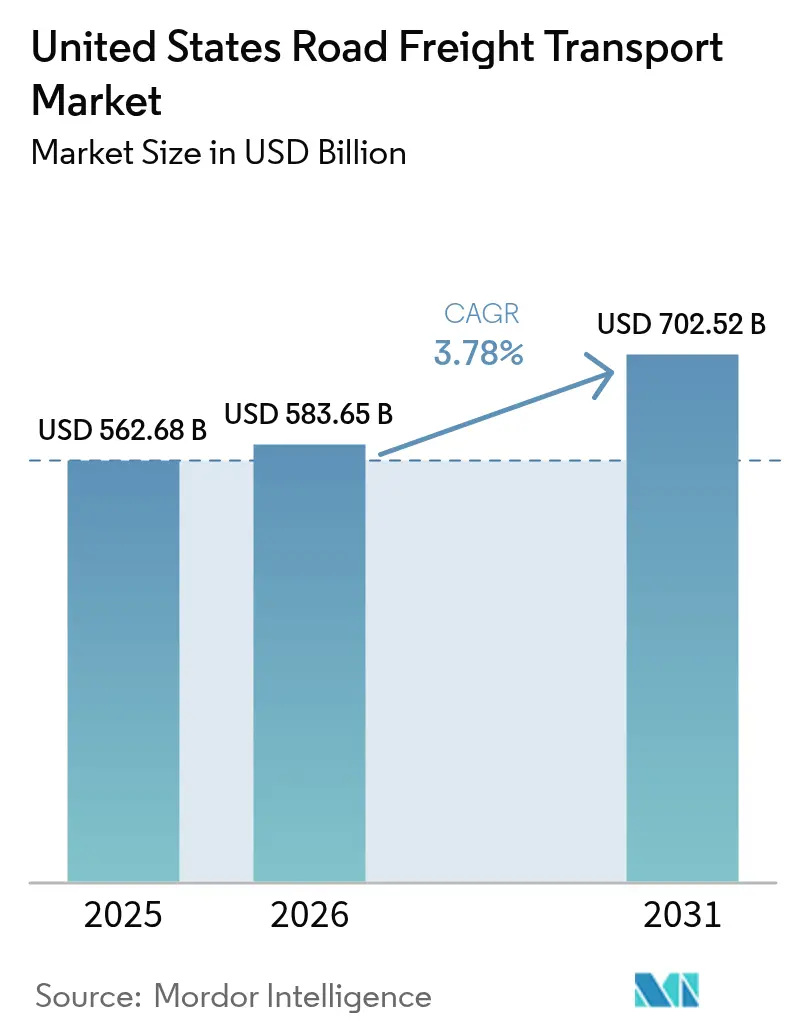
| Base Year Market Size (2025) | USD 562.68 Billion |
| Market Size (2026) | USD 583.65 Billion |
| Market Size (2031) | USD 702.52 Billion |
| Growth Rate (2026 - 2031) | 3.78% CAGR |
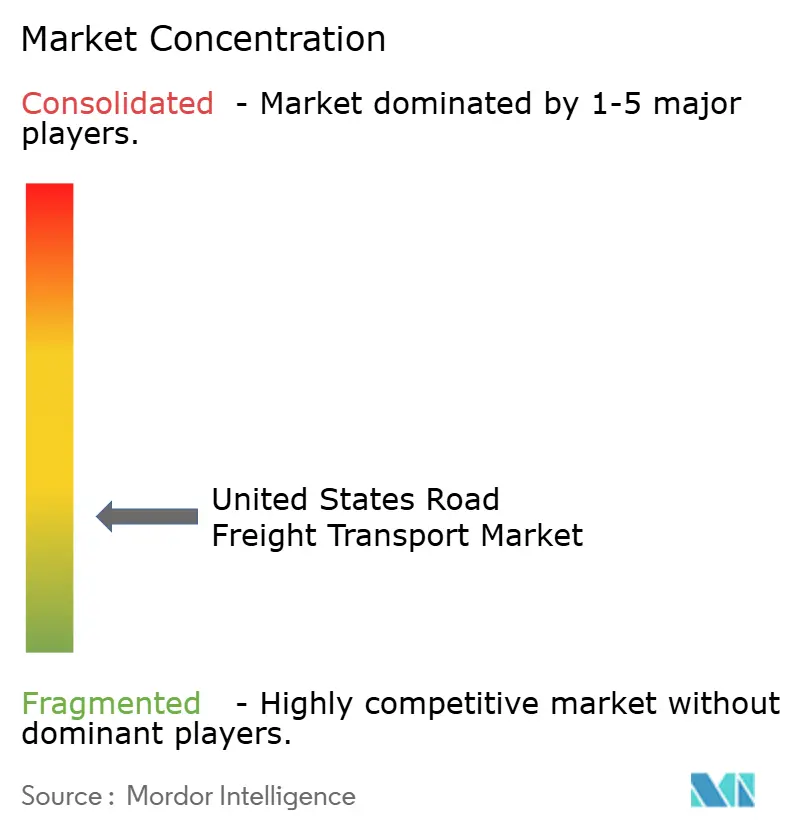
| Market Concentration | Low |
Major Players
*Disclaimer: Major Players sorted in no particular order Image © Mordor Intelligence. Reuse requires attribution under CC BY 4.0. |
|
United States Road Freight Transport Market Analysis by Mordor Intelligence
The United States road freight transport market size is expected to grow from USD 562.68 billion in 2025 to USD 583.65 billion in 2026 and is forecast to reach USD 702.52 billion by 2031 at 3.78% CAGR over 2026-2031.
E-commerce fulfillment, biologics manufacturing reshoring, and cross-border USMCA trade are reshaping route density and service models, prompting carriers to favor regional micro-fulfillment lanes and same-day LTL networks. Temperature-controlled trailers fetch premium rates because biologics and meal-kit firms demand 2-8 °C integrity with narrow ±0.5 °C tolerances, while rail chassis shortages continue to route high-value containers onto highways despite cost premiums. Blockchain proof-of-delivery platforms shorten the cash-conversion cycle for asset-heavy fleets, and state-level alternative-fuel credits accelerate tractor upgrades that lower carbon intensity and position carriers for zero-emission mandates. At the same time, soaring nuclear verdict insurance costs, aging bridges, and persistent truck-parking deficits erode operating margins and temper capacity growth.
Key Report Takeaways
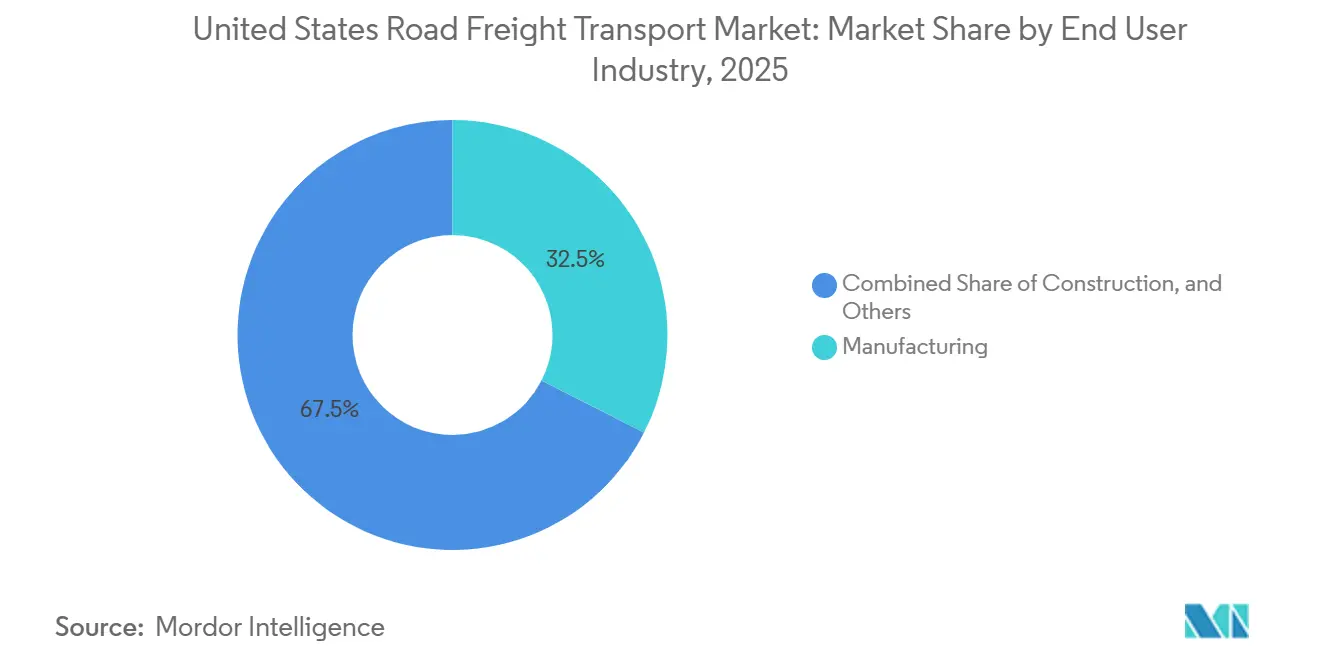
- By end-user industry, manufacturing led with 32.5% of the United States road freight transport market share in 2025, while wholesale and retail trade is forecast to expand at a 5.43% CAGR through 2031.
- By destination, domestic moves held 63.7% of the United States road freight transport market size in 2025; international freight is projected to advance at a 4.71% CAGR over 2026-2031.
- By truckload specification, full-truck-load commanded 79.4% share in 2025, but less-than-truck-load services are set to grow faster at 6.01% CAGR to 2031.
- By containerization, non-containerized freight accounted for an 85.3% share in 2025, whereas containerized lanes are anticipated to rise at a 4.37% CAGR through 2031.
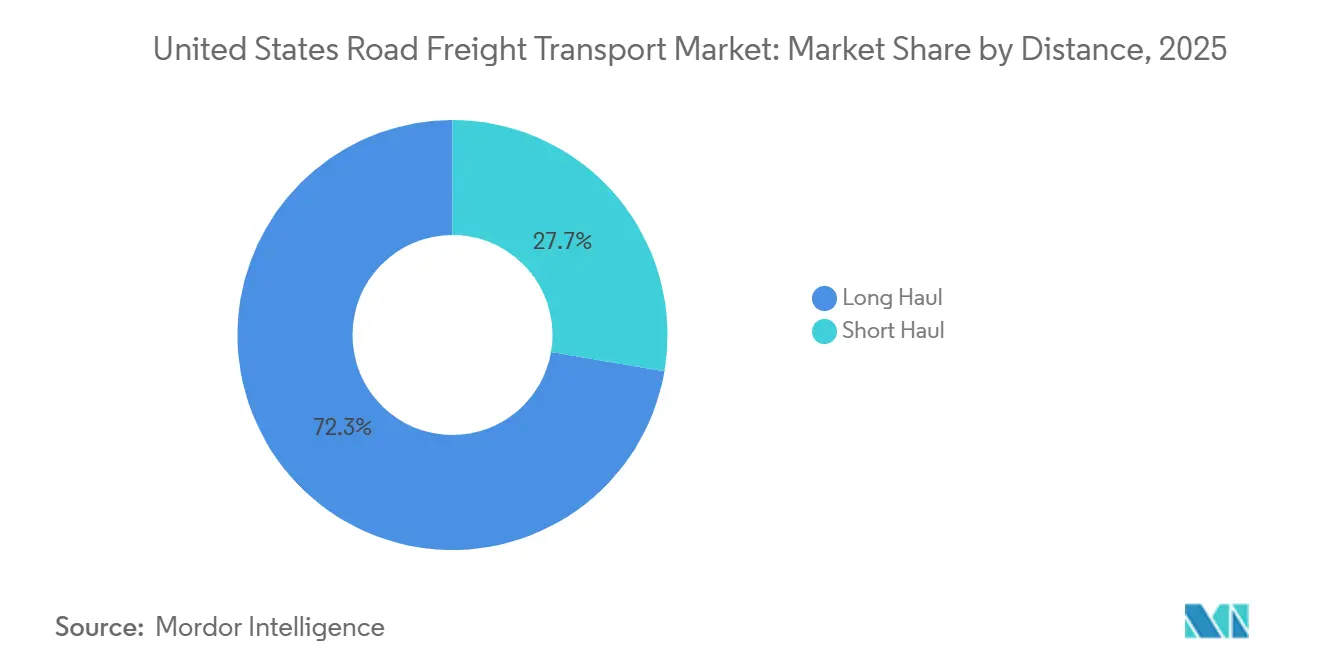
- By distance, long-haul operations represented 72.3% of 2025 traffic volume, and are expected to grow at a CAGR of 3.94% between 2026-2031.
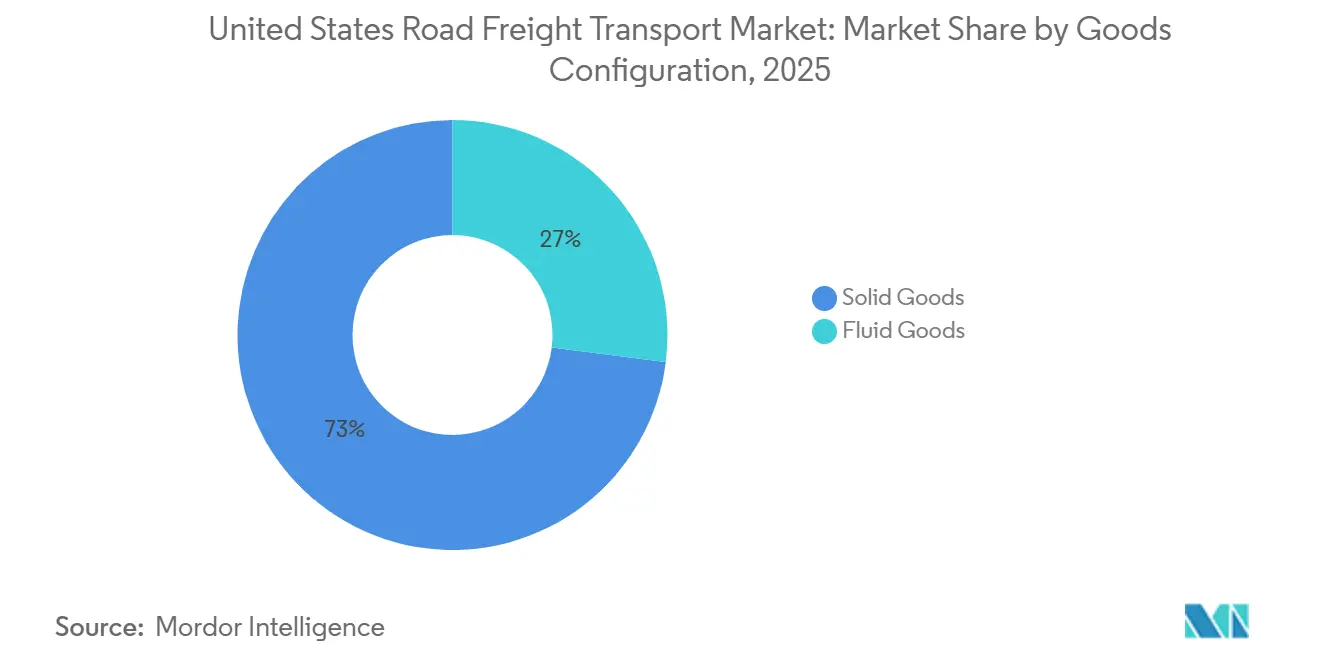
- By goods configuration, solid goods dominated with 73% of the United States road freight transport market size in 2025; fluid goods are projected to advance at a 3.85% CAGR through 2031.
- By temperature control, non-refrigerated shipments held 93.5% share in 2025, while temperature-controlled freight is poised for the steepest growth at 5.2% CAGR up to 2031.
Note: Market size and forecast figures in this report are generated using Mordor Intelligence’s proprietary estimation framework, updated with the latest available data and insights as of 2026.
United States Road Freight Transport Market Trends and Insights
Drivers Impact Analysis*
| Driver | (~) % Impact on CAGR Forecast | Geographic Relevance | Impact Timeline |
|---|---|---|---|
| Rapid build-out of regional micro-fulfillment DCs (<250 mi radius) by national retailers | +0.7% | National, concentrated in top 50 metropolitan areas | Medium term (2-4 years) |
| Explosive expansion of United States temperature-controlled logistics for biologics & meal-kits | +0.6% | National, pharmaceutical hub concentration | Long term (≥ 4 years) |
| Intermodal rail chassis shortages diverting high-value loads to time-critical trucking | +0.5% | National, port gateway regions | Short term (≤ 2 years) |
| Accelerated e-commerce generating same-day LTL demand spikes | +0.6% | National, urban market focus | Medium term (2-4 years) |
| Blockchain-enabled e-Proof-of-Delivery trimming invoice cycles and empty miles | +0.3% | National, technology adoption clusters | Medium term (2-4 years) |
| State tax credits for LNG & renewable-diesel heavy trucks catalyzing fleet renewal | +0.4% | Regional, California and Northeast states | Long term (≥ 4 years) |
| Source: Mordor Intelligence | |||


Micro-Fulfillment Centers Compress Regional Trucking Cycles
Retailers such as Walmart and Target are installing micro-fulfillment centers within a 250-mile radius to guarantee same-day service, pushing carriers toward dense regional lanes where equipment turns rise and empty miles fall. Dedicated sortation hubs opened by Target in 2024 lifted truck utilization rates by 18-22%, encouraging fleets to redeploy tractors from long-haul routes into multi-run regional loops[1]Corporate Author, “Target Opens New Distribution Center in Texas,” Target Corporation, corporate.target.com. Higher daily cycle counts improve asset productivity, yet they heighten competition for scarce urban parking and loading bay space. Carriers that integrate route-optimization software capture peak-hour efficiency gains, while analog operators struggle with dead-head trips. The United States road freight transport market, therefore, rewards fleets that align with omnichannel retail calendars and flexible dock-time scheduling.
Biologics Manufacturing Drives Cold-Chain Investment
The life-sciences carve-out in the CHIPS and Science Act has spurred USD 1.7 billion in capacity at Moderna’s Massachusetts campus, triggering demand for trailers certified to maintain 2-8 °C with tight temperature control. Meal-kit firms such as HelloFresh rely on refrigerated lanes for 120 million deliveries recorded in 2024, driving a 35-40% rate premium over dry vans. Carriers fitting telematics sensors are gaining shipper preference because real-time temperature alerts cut spoilage risk. These specialized assets raise capital intensity, yet they shield operators from commoditized dry-van price swings. Consequently, the United States road freight transport market experiences durable cold-chain contract tenures that stabilize revenue streams for qualified fleets.
Rail Chassis Constraints Redirect Intermodal Freight
Chassis availability at United States ports fell to 78% in 2024, lengthened dwell time by three days, and pushed importers toward truck-only moves despite 15-18% higher freight bills[2]Association of American Railroads, “Intermodal Equipment Issues,” AAR, aar.org . Time-sensitive electronics and apparel pivoted particularly at Los Angeles and Long Beach, where container velocity dictates seasonal shelf placement. Long-haul truckers who guarantee transit predictability tap this diversion, yet they must backhaul creatively to retain margin once equipment reaches inland depots. The episode underlines how infrastructure bottlenecks outside a carrier’s control can quickly pivot modal split inside the United States road freight transport market.
Same-Day Delivery Mandates Fragment LTL Patterns
Amazon, Walmart, and Target reached 85% population coverage for same-day service by 2025, inflating shipment counts under 500 lb LTL hubs deploy automated sortation and data-driven dispatching that slice handling costs by up to 15%, yet the extra stops per route magnify exposure to urban congestion. Carriers counter this by opening local cross-docks that allow consolidation near the recipient, thereby maintaining service reliability while reducing stem mileage. The LTL growth narrative complements the broader tilt of the United States road freight transport market toward smaller, high-frequency consignments.
Restraints Impact Analysis*
| Restraint | (~) % Impact on CAGR Forecast | Geographic Relevance | Impact Timeline |
|---|---|---|---|
| Escalating "nuclear verdict" insurance premiums inflating per-mile operating costs | -0.8% | National, concentrated in high-litigation states | Long term (≥ 4 years) |
| California Advanced Clean Fleets (ACF) mandate raising capital outlays for zero-emission tractors | -0.5% | Regional, California with spillover to Northeast | Long term (≥ 4 years) |
| Chronic shortage of secure truck-parking capacity reducing driver productivity | -0.4% | National, rural corridor concentration | Medium term (2-4 years) |
| Aging bridges & secondary roads driving detours and maintenance downtime | -0.3% | Regional, Midwest and Southeast infrastructure gaps | Medium term (2-4 years) |
| Source: Mordor Intelligence | |||
Nuclear-Verdict Litigation Inflates Insurance Costs
Awards above USD 10 million accounted for 23% of trucking cases in 2024, up from 12% in 2020, doubled average verdicts to USD 22.3 million, and spiked annual liability premiums by 40-60% for midsize fleets. Smaller carriers sometimes drop coverage or exit interstate authority, reducing competition on low-margin lanes. High-profile judgments concentrate in Florida, Texas, and California, where jury pools historically favor plaintiffs. Insurers now demand telematics data and collision-avoidance technology before quoting, raising compliance complexity. The resulting cost drag trims the United States road freight transport market CAGR potential, especially for new entrants with limited balance sheets.
Zero-Emission Mandates Raise Fleet Capital Requirements
California’s Advanced Clean Fleets rule requires 100% zero-emission purchases by 2036 for large fleets, lifting tractor cost to USD 350,000-450,000 compared with USD 150,000-180,000 diesel equivalents. Battery-electric range caps at 250 miles, limiting applicability to regional shuttles, and require dual-fleet strategies for long-haul coverage. Charger installation adds USD 50,000-150,000 per depot, delaying breakeven despite USD 45,000-65,000 state incentives. Carriers headquartered outside California but operating intrastate freight still must comply, pressuring national dispatch flexibility. The regulation, therefore, subtracts momentum from the United States road freight transport market until equipment cost curves fall.
*Our forecasts treat driver/restraint impacts as directional, not additive. The impact forecasts reflect baseline growth, mix effects, and variable interactions.
Segment Analysis
By End-User Industry: Retail Freight Growth Overtakes Manufacturing
Wholesale and retail trade lanes grew faster than any peer category and are projected to record a 5.43% CAGR from 2026 to 2031, narrowing the gap with manufacturing, which held 32.5% of the United States road freight transport market share in 2025. This momentum stems from omnichannel inventory strategies where retailers split replenishment between stores and direct-to-consumer parcel nodes. Regional distribution nodes within 250 miles reduce transit slack, thereby increasing trailer turns and stabilizing carrier revenue. Manufacturing continues to dominate heavy truckload demand across automotive, machinery, and electronics supply chains that favor full-truck-load economics, yet its yearly advance trails retail due to plateauing domestic factory utilization.
Construction and oil-and-gas freight follow cyclical patterns linked to commodity prices and infrastructure awards, creating seasonal peaks that absorb spare dry-van and flatbed capacity. Agricultural, fishing, and forestry movements rely on harvest calendars, flooding refrigerated networks each fall with perishable produce that commands premium prices. Niche freight for renewable-energy components and pharmaceutical inputs falls into the others category but punches above its weight in pricing due to its special handling requirements. Hours-of-service rules constrain driver scheduling on these long-distance manufacturing moves, while retail volumes benefit from short-haul loops that align with relay networks, helping fleets optimize the United States road freight transport market size captured per tractor.


By Destination: Domestic Dominance With International Upswing
Domestic hauls accounted for 63.7% of the United States road freight transport market size in 2025, buoyed by reshoring initiatives and improved highway funding that cut port detours, while International freight is forecast to outpace domestic with a 4.71% CAGR to 2031 as USMCA clauses remove legacy tariffs and automate customs clearance through ACE, trimming border dwell by up to 30%. Infrastructure Investment and Jobs Act disbursements target chokepoints on I-10, I-40, and I-95, smoothing hub-to-hub moves and supporting higher average payloads. Manufacturers in Ohio, Michigan, and Indiana feed hub-and-spoke systems where trailer pools minimize idle time, while Sunbelt warehouse proliferation absorbs incremental capacity as population shifts southward.
Mexican near-shoring of electronics and automotive assemblies creates high-velocity northbound lanes that complement southbound raw-material flows, boosting equipment utilization. Carriers that invest in bilingual driver pools and C-TPAT certification win these transnational contracts. Canadian cross-border activity remains steady yet constrained by driver shortages and winter weather, whereas future growth hinges on harmonized hours-of-service negotiations. Handling documentation complexity remains a cost headwind, but profit per mile often exceeds domestic averages, reinforcing the attractiveness of this slice of the United States road freight transport market.
By Truckload Specification: LTL Networks Capture E-Commerce Upsurge
Full-truck-load still led with 79.4% share in the United States road freight transport market share in 2025 due to bulk manufacturing moves, but less-than-truck-load voices the growth story at 6.01% CAGR through 2031. LTL carriers invested in conveyor automation and dynamic pricing, improving terminal throughput by 18-22% and reallocating labor savings toward network expansion. Shippers favor LTL for sub-pallet consignments destined for micro-fulfillment nodes, where dock appointments mirror parcel slice times rather than fixed windows.
FTL operators grapple with driver scarcity and insurance inflation, yet maintain margin by deploying modern aerodynamic tractors and diesel-replacement fuels that shave operating costs. Increasing warehouse velocity nudges some FTL lines into dedicated contract carriage for omnichannel customers, blending the two models. Minimum insurance thresholds under 49 CFR 387 weigh slightly heavier on LTL because multi-stop routing inflates aggregate exposure, whereas FTL’s point-to-point simplicity mutes claim frequency. Over the forecast horizon, balanced network design is expected to decide carrier share capture within the United States road freight transport market.
By Containerization: Chassis Shortfall Lifts Containerized Hauls
Containerized freight is projected to climb at a 4.37% CAGR even though non-containerized loads commanded an 85.3% share in 2025. Port dwell reductions of 35-40% at Los Angeles and Long Beach have improved scheduling confidence and encouraged truck drayage carriers to commit additional chassis for inland legs. Shippers appreciate container integrity that slashes handling touchpoints and aligns with global RFID seal standards.
Non-containerized freight spans oversized machinery, construction beams, and finished autos that require specialized trailers and driver certifications. Such moves avoid port congestion but demand route surveys and pilot cars, capping trip frequency compared with standard boxes. ISO container rules dictate asset upgrades, yet many small carriers hesitate to acquire twist-lock chassis, slowing wider adoption. Nevertheless, the chassis crunch highlights a structural lever that could redirect latent demand, preserving upside for the containerized slice of the United States road freight transport market.
By Distance: Long-Haul Holds Mass, Short-Haul Gains Speed
Long-haul corridors retained a 72.3% share in the United States road freight transport market size in 2025 and are expected to grow at a 3.94% CAGR through 2031, as cross-continental supply chains remain anchored by dispersed manufacturing and retail footprints. Yet parking deficits of 98,000 spaces cost drivers 30-60 minutes per shift, injecting waste totaling 15-20% productivity loss[3]Federal Highway Administration, “Bipartisan Infrastructure Law,” FHWA, fhwa.dot.gov . Fleets now install real-time parking apps and negotiate reserved-space subscriptions to mitigate downtime.
Drivers value predictable home-time, easing recruitment and lowering turnover relative to long-haul positions. Autonomous tech pilots also prioritize point-to-point interstate legs that may, in the long run, offset the parking challenge. The resulting mix signals a gradual tilt in the United States road freight transport market toward shorter cycles without dislodging the foundational long-haul volume cornerstone.
By Goods Configuration: Specialized Tankers Drive Fluid Gain
Solid goods remained dominant at 73% share of the United States road freight transport market share in 2025, with finished products, consumer staples, and building materials moving in standard vans or flatbeds. Rising e-commerce orders added parcel-ready volumes that mesh well with dry equipment pools, sustaining volume headroom.
Fluid cargoes such as chemicals, fuel blends, and liquid food ingredients are forecast to post a 3.85% CAGR as United States petrochemical capacity augments Gulf Coast output pipeline capacity. Tanker carriers must meet PHMSA 49 CFR Parts 100-185, which impose rigorous vessel testing, driver endorsements, and cargo segregation, elevating the barrier to entry. Premium rates offset asset idleness caused by incompatible loads, supporting higher-margin profiles relative to dry vans. This specialization underpins a profitable niche within the United States road freight transport market.
By Temperature Control: Cold-Chain Freight Surges on Biologics and Meals
Non-Temperature-Controlled shipments accounted for 93.5% of 2025 tonnage, while temperature-controlled shipments are projected to grow at a 5.2% CAGR through 2031 in the United States road freight transportation market share, mirroring the expansion of biologics and fresh-food logistics. Trailer telematics now generates continuous logs to comply with the FDA Food Safety Modernization Act, and shippers frequently embed data feeds into quality-assurance dashboards to trigger exception handling in real time.
Refrigerated fleets face steeper equipment depreciation but enjoy multi-year contract stability from pharma and grocery accounts. These factors, combined, underscore how cold-chain advances improve the qualitative mix within the broader United States road freight transport market.
Geography Analysis
Industrial Midwest states funnel auto parts and steel eastward, while Sunbelt warehouse corridors absorb inbound consumer goods for last-mile dispersion. E-commerce giants operate more than 1,000 fulfillment nodes nationwide, fundamentally redrawing regional lane density and prompting asset relocation to population-growth states.
International haulage is set to outpace domestic through 2031 as United States-Mexico trade is expected to flourish under USMCA tariff removals and ACE digital paperwork, slicing border queue time by up to 30%. Electronics and automotive components shuttle northbound, offset by southbound steel coils and resins, resulting in balanced flows that curb empty legs on both sides. Canadian corridors sustain stable volumes, though winter storms and driver scarcity restrain upside, making dedicated drayage yards and pre-clearance programs indispensable for on-time performance.
Port-centric metros along the Gulf and Atlantic coasts benefit from improved berth capacity and widened ship channels, easing import surges and creating denser drayage loops. Intermountain states see spillover traffic as inland rail delays push time-critical loads onto direct truck lanes, amplifying service needs at regional transload facilities. Altogether, these geographic currents continue to shape carrier network designs across the United States road freight transport market.
Competitive Landscape
The carrier universe numbers more than 750,000 active motor authorities, leaving the United States road freight transport market fragmented and ripe for technology-driven consolidation. Large fleets leverage blockchain-based proof of delivery, AI route planning, and automated sortation to reduce transit variance and secure shipper premiums, while smaller operators often depend on third-party brokers for load access. Digital freight platforms already control one-fifth of contractual brokerage, pairing algorithmic matching with instant pricing that shaves empty backhauls.
Strategic differentiation centers on specialized capacity. Refrigerated carriers invest in real-time temperature telemetry to win biologics accounts, while hazardous-materials operators bank on robust insurance coverage and driver endorsements. Same-day LTL networks race to saturate urban coverage by opening micro-hubs that feed parcel flows within tight cut-off windows. Carriers embracing alternative fuels secure early compliance with state mandates and appeal to retailers with science-based emission targets.
Mergers and acquisitions intensify scale economics: Knight-Swift’s USD 1.8 billion purchase of United States Xpress added 7,200 tractors and deepened contract carriage depth in retail and automotive lanes[4]Nasdaq, “Knight‑Swift to Acquire U.S. Xpress,” Nasdaq, nasdaq.com, whereas XPO’s terminal acquisition from Yellow unlocked 128 high-value cross-docks across the Midwest and Southeast corridors. EV infrastructure outlays by J.B. Hunt and Schneider position those fleets ahead of 2030 zero-emission thresholds. Meanwhile, rising insurance deductibles weed out thin-capital fleets, nudging market share toward data-mature incumbents within the United States road freight transport market.
United States Road Freight Transport Industry Leaders
-
FedEx
-
J.B. Hunt Transport, Inc.
-
XPO, Inc.
-
United Parcel Service of America, Inc. (UPS)
-
Knight Swift Transportation
- *Disclaimer: Major Players sorted in no particular order

Recent Industry Developments
- February 2026: J.B. Hunt Transport stock fell ~3.5% on a weak day but still outperformed some peer carriers.
- November 2025: UPS completed the acquisition of Andlauer Healthcare Group to strengthen its healthcare and temperature-controlled logistics offerings in the United States and globally.
- June 2025: DHL Group signed a partnership with Daimler Truck and Hylane for the rental deployment of 30 Mercedes-Benz eActros 600 electric trucks for long-haul transport, with delivery expected by mid-2026.
- February 2025: FedEx completed the acquisition of RouteSmart Technologies, a route optimization and planning firm, to strengthen its delivery efficiency and data capabilities.


United States Road Freight Transport Market Report Scope
End User Industry
| Agriculture, Fishing, and Forestry |
| Construction |
| Manufacturing |
| Oil and Gas, Mining and Quarrying |
| Wholesale and Retail Trade |
| Others |
Destination
| Domestic |
| International |
Truckload Specification
| Full-Truck-Load (FTL) |
| Less than-Truck-Load (LTL) |
Containerization
| Containerized |
| Non-Containerized |
Distance
| Long Haul |
| Short Haul |
Goods Configuration
| Fluid Goods |
| Solid Goods |
Temperature Control
| Non-Temperature Controlled |
| Temperature Controlled |
| End User Industry | Agriculture, Fishing, and Forestry |
| Construction | |
| Manufacturing | |
| Oil and Gas, Mining and Quarrying | |
| Wholesale and Retail Trade | |
| Others | |
| Destination | Domestic |
| International | |
| Truckload Specification | Full-Truck-Load (FTL) |
| Less than-Truck-Load (LTL) | |
| Containerization | Containerized |
| Non-Containerized | |
| Distance | Long Haul |
| Short Haul | |
| Goods Configuration | Fluid Goods |
| Solid Goods | |
| Temperature Control | Non-Temperature Controlled |
| Temperature Controlled |


Market Definition
- Agriculture, Fishing, and Forestry (AFF) - This end user industry segment captures the external (outsourced) logistics expenditure incurred by the AFF industry players on road freight transport service. The end user players considered are the establishments primarily engaged in growing crops, raising animals, harvesting timber, harvesting fish & other animals from their natural habitats and providing related support activities. Herein, across the value chain, Logistics Service Providers (LSPs) play a crucial role in acquisition, storage, handling, transportation, and distribution activities for the optimal & continuous flow of inputs (seeds, pesticides, fertilizers, equipment, and water) from manufacturers or suppliers to the producers and smooth flow of output (produce, agro-goods) to distributors/ consumers. This includes both termperature controlled and non-temperature controlled logistics, as and when required according to the shelf life of goods being transported or stored.
- Construction - This end user industry segment captures the external (outsourced) logistics expenditure incurred by the construction industry players, on road freight transport service. The end user players considered are the establishments primarily engaged in constructing, repairing and renovating residential & commercial buildings, infrastructure, engineering works, subdividing and developing land. Logistics Service Providers (LSPs) play a crucial role in increasing profitability of construction projects by maintaing the inventory of raw materials & equipment, time-critical supplies and by providing other value added services for effective project management.
- Containerized Road Freight Transport - The segment captures the external (outsourced) logistics expenditure incurred by the road freight transport service end users on Full-Truck-Load (FTL) services. FTL road freight transport is characterized as a full single load not combined with other shipments. It comprises of shipments (i) devoted to the goods of a single shipper (ii) taken directly from a point of origin to one or more destination points (iii) comprising of bulk mail truck transportation (iv) comprising of both Container (Full Container Load, FCL)/Non-Container trucking services (v)comprsing of goods requiring temperature controlled or non-temperature controlled transportation services (vi) comprising of bulk liquid tankering (vii) invoving trucking of waste (viii) hazardous material trucking. Related value added services (VAS) of sorting, consolidation, deconslidation are included in the other services segment of freight and logistics market.
- Export Trends and Import Trends - Overall logistics performance of an economy is positively and significantly (statistically) correlated to its trade performance (exports and imports). Hence, in this industry trend, total value of trade, major commodities/ commodity groups and the major trade partners, for the studied geography (country or region as per the scope of report) have been analysed alongside the impact of major trade/logistics infrastructure investments & regulatory environment.
- Fluid Goods - The segment captures the external (outsourced) logistics expenditure incurred by the road freight transport service end users for the transport of bulk liquids, that are often used in extraction, manufacturing, food processing, agriculture industries among others. It includes transportation of liquids like (i) Chemicals/ hazardous goods (for instance acids) (ii) Water (potable as well as waste) (iii) Oil and gas (upstream as well as downstream like gasoline, fuel, crude oil, or propane), (iv) Food grade bulk liquids (like milk, or juice), (v) Rubber, (vi) Agrichemical products, among others. These goods are generally transported through tanker trucking.
- Fuel Price - Fuel price spikes can cause delays and diruption for logistics service providers (LSPs), while drops in the same can result in higher short-term profitability and increased market rivalry to offer consumers with the best deals. Hence, the fuel price variations have been studied over the review period and presented along with the causes as well as market impacts.
- Full-Truck-Load (FTL) Road Freight Transport - The segment captures the external (outsourced) logistics expenditure incurred by the road freight transport service end users on Full-Truck-Load (FTL) services. FTL road freight transport is characterized as a full single load not combined with other shipments. It comprises of shipments (i) devoted to the goods of a single shipper (ii) taken directly from a point of origin to one or more destination points (iii) comprising of bulk mail truck transportation (iv) comprising of both Container (Full Container Load, FCL)/Non-Container trucking services (v)comprsing of goods requiring temperature controlled or non-temperature controlled transportation services (vi) comprising of bulk liquid tankering (vii) invoving trucking of waste (viii) hazardous material trucking. Related value added services (VAS) of sorting, consolidation, deconslidation are included in the other services segment of freight and logistics market.
- GDP Distribution by Economic Activity - Nominal Gross Domestic Product and distribution of the same, across major economic sectors in the geography studied (country or region as per scope of the report) have been studied and presented in this industry trend. As GDP is positively related to the profitability and growth of logistics industry, this data has been used in adjunction to the input-output tables/ supply-use tables for analyzing the potential major contributing sectors towards the logistics demand.
- GDP Growth by Economic Activity - Growth of Nominal Gross Domestic Product across major economic sectors, for the geography studied (country or region as per scope of the report) have been presented in this industry trend. This data has been utilized for assessing the growth of logistics demand from all the market end users (economic sectors considered here).
- Inflation - Variations in both Wholesale Price Inflation (YoY change in producer price index) and Consumer Price Inflation have been presented in this industry trend. This data has been used to assess the inflationary environment as it plays a vital role in smooth functioning of the supply chain, directly impacting the logistics operational cost components e.g., pricing of tyres, driver wages & benefits, energy/fuel prices, maintenace costs, toll charges, warehousing rents, custom brokerage, forwarding rates, courier rates etc. hence impacting the overall freight and logistics market.
- Key Industry Trends - The report section named "Key Industry Trends" include all the key variables/parameters studied to better analyze the market size estimates and forecasts. All the trends have been presented in the form of data points (time series or latest available data points) along with analysis of the paramter in the form of concise market relevant commentary, for the geography studied (country or region as per the scope of report).
- Key Strategic Moves - The action taken by a company to differentiate from its competitor or used as a general strategy is referred to as a key strategic move (KSM). This includes (1) Agreements (2) Expansions (3) Financial Restructuring (4) Mergers and Acquisitions (5) Partnerships, and (6) Product Innovations. Key players (Logistics Service Providers, LSPs) in the market have been shortlisted, their KSM have been studied and presented in this section.
- Less than-Truck-Load (LTL) Road Freight Transport - The segment captures the external (outsourced) logistics expenditure incurred by the road freight transport service end users on Less than-Truck-Load (LTL) services. LTL road freight transport is characterized as multiple shipments combined onto a single truck for multiple deliveries within a network. It comprises of establishments (i) primarily engaged in general and specialized freight trucking of less than complete truck-loads, (ii) characterized by the use of terminals to consolidate shipments, generally from several shippers, into a single truck for haulage between a load assembly terminal and a disassembly terminal, where the load is sorted and shipments are re-routed for delivery (iv) Less than-Container-Load (LCL) shipping/ Groupage Shipping in case of trucking services. The activities in scope include (i) local pick-up, (ii) line-haul, and (iii) local delivery. Related value added services (VAS) of sorting, consolidation, deconslidation are included in the other services segment of freight and logistics market.
- Logistics Performance - Logistics Performance and Logistics Costs are the backbone of trade, and influences trade costs, making countries compete globally. Logistics performance is influenced by market wide adopted supply chain management strategies, government services, investments & policies, fuel/ energy costs, inflationary environment etc. Hence, in this industry trend, the logistics performance of the geography studied (country/ region as per the scope of report) has been analysed and presented over the review period.
- Major Truck Suppliers - Market share of truck brands is influenced by factors like geographical preferences, portfolio of truck types, truck prices, local production, truck repair & maintenance service peneteration, customer support, technological innovations (like electric vehicles, digitalization, autonomous trucks), fuel efficiency, financing options, annual maintenance costs, availability of substitutes, marketing startegies etc. Hence, the distribution (share % for base year of the study) of truck sales volume for leading truck brands and commentary on current market scenario & market anticipation over the forecast period have been presented in this industry trend.
- Manufacturing - This end user industry segment captures the external (outsourced) logistics expenditure incurred by the Manufacturing industry players, on road freight transport service. The end user players considered are the establishments primarily engaged in the chemical, mechanical or physical transformation of materials or substances into new products. Logistics Service Providers (LSPs) play a crucial role in maintaining a smooth flow of raw materials across the supply chain, enabling timely delivery of finished goods to distributors or end customers and storing & supplying the raw materials to clients for just-in-time manufacturing.
- Modal Share - Freight Modal Share is influenced by factors like modal productivity, government regulations, containerization, distance of shipment, temperature control requirements, type of goods, international trade, terrain, speed of delivery, shipment weight, bulk shipments, etc. Also, modal share by tonnage (tons) and modal share by freight turnover (ton-km) differ as per average distance of shipments, weight of major commodity groups transported in the economy and number of trips. This industry trend represents the distribution of freight transported by mode of transport (tons as well as ton-km), for the study base year.
- Oil and Gas, Mining and Quarrying - This end user industry segment captures the external (outsourced) logistics expenditure incurred by the extraction industry players, on road freight transport service. The end user players considered are the establishments that extract naturally occurring mineral solids, such as coal and ores; liquid minerals, such as crude petroleum; and gases, such as natural gas. Logistics Service Providers (LSPs) covers entire phases from upstream to downstream and plays a crucial role in the transportation of machinery, drilling equipments, extracted minerals, crude oil & natural gas and refined/ processed products from one place to another.
- Other End Users - Other end user segment captures the external (outsourced) logistics expenditure incurred by the financial services (BFSI), real estate, educational services, healthcare, and professional services (administrative, waste management, legal, architectural, engineering, design, consulting, scientific R&D), on road freight transport service. Logistics Service Providers (LSPs) plays a crucial role in the reliable movement of supplies and documents to/from these industries such as transporting any equipment or resources required, shipping confidential documents and files, movement of medical goods & supplies (surgical supplies and instruments, including gloves, masks, syringes, equipment) to name a few.
- Producer Price Inflation - It indicates inflation from viewpoint of the producers viz. the average selling price received for their output over a period of time. Annual change (YoY) of producer price index is reported as wholesale price inflation in the "Inflation" industry trend. As WPI captures dynamic price movements in most comprehensive way, it is widely used by governments, banks, industry, business circles and is deemed important in formulation of trade, fiscal and other economic policies. The data has been used in adjunction to consumer price inflation for better understanding the inflationary environment.
- Road Freight Pricing Trends - Freight pricing by mode of transport (USD/tonkm), over the review period, has been presented in this industry trend. The data has been used in assessing the inflationary environment, impact on trade, freight turnover (tonkm), road freight transport market demand and hence the road freight transport market size.
- Road Freight Tonnage Trends - Freight tonnage (weight of goods in tons) handled by mode of transport, over the review period, has been presented in this industry trend. The data has been used as one of the parameters apart from average distance per shipment (km), freight volume (tonkm), and freight pricing (USD/tonkm) to assess the freight transport market size.
- Road Freight Transport - Hiring a road freight transport logistics service provider (LSP) or haulier (outsourced logistics), for the transport of commodities constitutes road freight transport market. The scope of study includes (i) road transport of goods reported by hauliers registered in the reporting countries (ii) transport of raw materials or manufactured goods (solids as well as fluids) (iii) transport using commerical motor vehicles (rigid trucks or tractor-trailers, (iv) Full-Truck-Load (FTL) or Less than-Truck-Load (LTL) transport (v) containerized or non-containerized transport (vi) temperature controlled or non-temperature controlled trasnport, (vii) short haul or long haul (Over-the-road, OTR) transport, (viii) used office or household goods transport (movers and packers), (ix) other specialized cargo transport (dangerous goods, oversized cargo) and (x) outsourced first mile/ middle mile/last mile delivery shipments undertaken by road freight transport players. The scope does not include (i) transport undertaken by hauliers registered in other countries (ii) last mile meal delivery market (iii) grocery delivery market (iv) transportation via road network undertaken/ reported by Courier, Express, and Parcel (CEP) players.
- Road Length - As infrastructure plays a vital role in an economy's logistics performance, variables like length of roads, distribution of road length by surface category (paved v/s unpaved), distribution of road length by road classification (expressways v/s highways v/s other roads), have been analysed and presented in this industry trend.
- Segmental Revenue - Segmental Revenue has been triangulated or computed and presented for all the major players in the market. It refers to the road freight transport market specific revenue earned by the company, over the base year of study, in the geography studied (country or region as per the scope of report). It is computed through the study and analysis of major parameters like financials, service portfolio, employee strength, fleet size, investments, number of countries present in, major economies of concern, etc. that have been reported by the company in its annual reports, webpage. For companies having scarce financial disclosures, paid databases like D&B Hoovers, Dow Jones Factiva have been resorted to and verified through industry/expert interactions.
- Short Haul Road Freight Transport - The segment captures the external (outsourced) logistics expenditure incurred by the road freight transport service end users on local trucking (less than 100 miles). It includes the road transport of goods (i) within a single administrative area and its hinterland, (ii) by smaller trucks and pickup trucks (iii) via containerized as well as dry bulk services (iv) intermodal from ports, container terminals or airports, and (v) outsourced first mile/ last mile delivery shipments undertaken by road freight transport players.
- Transport and Storage Sector GDP - Value and growth of Transport and Storage Sector GDP has a direct relation to the freight and logistics market size, and hence road freight transport market size. Therefore, this variable has been studied and presented over the review period, in value terms (USD) and as share % of total GDP, in this industry trend. The data has been supported by concise and relevant commentary around the investments, developments, and current market scenario.
- Trends in E-Commerce Industry - Enhanced internet connectivity and boom in smartphone penetration, coupled with increasing disposable incomes, has led to a phenomenal growth in the e-commerce market globally. Online shoppers require fast and efficient delivery of their orders leading to an increase in the demand for logistics services especially e-commerce fulfilment services. Hence, the Gross Merchandise Value (GMV), historial and projected growth, breakup of major commodity groups in e-commerce industry for the studied geography (country or region as per scope of the report) have been analysed and presented in this industry trend.
- Trends in Manufacturing Industry - Manufacturing industry involves the transformation of raw materials into finished products, while logistics industry ensures the efficient flow of raw materials to the factory, and the transport of manufactured products to the distributors & consumers. Demand-Supply of both industries are highly cross-linked and critical for a seamless supply chain. Hence, the Gross Value Added (GVA), breakup of GVA into major manufacturing sectors, and growth of manufacturing industry over the review period have been analysed and presented, in this industry trend.
- Trucking Fleet Size By Type - Market share of truck types is influenced by factors like geographical preferences, major end user industries, truck prices, local production, truck repair & maintenance service peneteration, customer support, technological disruptions (like electric vehicles, digitalization, autonomous trucks) etc. Hence, the distribution (share % for base year of study) of truck parc volume by type of truck, market disruptors, truck manufacturing investments, truck specifications, truck use & import regulations, and market anticipation over the forecast period have been presented in this industry trend.
- Trucking Operational Costs - The prime reasons for measuring/ benchmarking logistics performance of any trucking company are to reduce operational costs and increase profitability. On the other hand, measuring operational costs helps to identify whether and where to make operational changes to control expenses and identify areas for improved performance. Hence, in this industry trend, trucking operational costs and the variables involved viz. driver wages & benefits, fuel prices, repairs & maintenance costs, tyre costs etc. have been studied over the base year of study, and presented for the geography studied (country or region as per the scope of report).
- Wholesale and Retail Trade - This end user industry segment captures the external (outsourced) logistics expenditure incurred by the wholesalers and retailers, on road freight transport service. The end user players considered are the establishments primarily engaged in wholesaling or retailing merchandise, generally without transformation, and rendering services incidental to the sale of merchandise. Logistics Service Providers (LSPs) plays a crucial role in the reliable movement of supplies to and finished products from production houses to the distributors and finally to the end customer covering activites like material sourcing, transportation, order fulfillment, warehousing & storage, demand forecasting, inventory management etc.
| Keyword | Definition |
|---|---|
| Cabotage | Road transport by a motor vehicle registered in a country performed on the national territory of another country. |
| Cross Docking | Cross docking is a logistics procedure where products from a supplier or manufacturing plant are distributed directly to a customer or retail chain with marginal to no handling or storage time. Cross docking takes place in a distribution docking terminal; usually consisting of trucks and dock doors on two (inbound and outbound) sides with minimal storage space. The name ‘cross docking’ explains the process of receiving products through an inbound dock and then transferring them across the dock to the outbound transportation dock. |
| Cross Trade | International road transport between two different countries performed by a road motor vehicle registered in a third country. A third country is a country other than the country of loading/embarkation and than the country of unloading/disembarkation. |
| Dangerous Goods | The classes of dangerous goods carried by Road are those defined by the fifteenth revised edition of the UN Recommendations on the Transport of Dangerous Goods, United Nations, Geneva 2007. They include Class 1: Explosives; Class 2: Gases; Class 3: Flammable Liquids; Class 4: Flammable solids- substances liable to spontaneous combustion; substances which, on contact with water, emit flammable gases; Class 5: Oxidizing substances and organic peroxides; Class 6: Toxic and infectious substances; Class 7: Radioactive material and Class 8: Corrosive substances, Class 9: Miscellaneous dangerous substances and articles. |
| Direct Shipment | Direct shipment is a method of delivering goods from the supplier or the product owner to the customer directly. In most cases, the customer orders the goods from the product owner. This delivery scheme reduces transportation and storage costs, but requires additional planning and administration. |
| Drayage | A drayage is a form of trucking service that connects the different modes of shipping (intermodal), such as ocean freight or air freight. It’s a short-haul trip that transports goods from one place to another, usually before or after its long-haul shipping process. Drayage trucks move cargo to and from various destinations, such as container ships, storage lots, order fulfillment warehouses, and rail yards. Typically, drayage only transports goods in short distances and operates only in one metropolitan area. It also requires only one trucker in a single shift. But despite this, but it plays an important role in long-haul shipping because it gets the goods to the cargo and vice versa. It makes intermodal transport much more efficient and enables the seamless transfer of goods to the end customer. |
| Dry van | A dry van is a type of semi-trailer that's fully enclosed to protect shipments from outside elements. Designed to carry palletized, boxed or loose freight, dry vans aren't temperature-controlled (unlike refrigerated “reefer” units) and can't carry oversized shipments (unlike flatbed trailers). |
| Final Demand | Final demand includes all types of commodities (goods as well as services) consumed as final use and might include personal consumption, or consumption by government, by businesses as capital investment, and as exports. includes all types of commodities (goods as well as services) consumed as final use and might include personal consumption, or consumption by government, by businesses as capital investment, and as exports. |
| Flatbed Truck | A flatbed truck is a type of truck with rigid design. It has a back body that is flatly shaped for easy loading and unloading of goods. The flatbed truck is mostly used to transport heavy, oversized, wide and indelicate goods such as machinery, building supplies or equipment. Due to the truck open body, the goods transported with it must not be vulnerable to rain. By functionality, the flatbed truck is comparable to a flatbed trailer. |
| Inbound Logistics | Inbound logistics is the way materials and other goods are brought into a company. This process includes the steps to order, receive, store, transport and manage incoming supplies. Inbound logistics focuses on the supply part of the supply-demand equation. |
| Intermediate Demand | Intermediate demand includes goods, services, and maintenance and repair construction sold to businesses, excluding capital investment. |
| International Loaded | Place of loading of goods in reporting country (i.e., country in which the vehicle performing the transport is registered) and place of unloading in a different country. |
| International Unloaded | Place of unloading of goods in reporting country (i.e., country in which the vehicle performing the transport is registered) and place of loading in a different country. |
| OOG cargo | Out of Gauge (OOG) cargo is any cargo that can not be loaded into six-sided shipping containers simply because it is too large. The term is a very loose classification of all cargo with dimensions beyond the maximum 40HC container dimensions. That is a length beyond 12.05 meters – a width beyond 2.33 meters – or a height beyond 2.59 meters. |
| Pallets | Raised platform, intended to facilitate the lifting and stacking of goods. |
| Part load | A part load describes goods which only fills a truck partially. In essence, the quantity of the shipment is bigger than the Less Than Truckload (LTL) shipment. Also, the shipment cannot fully occupy a truck i.e. its capacity is much lower than a Full Truckload (FTL) shipment. |
| Paved Road | Road surfaced with crushed stone (macadam) with hydrocarbon binder or bituminized agents, with concrete or with cobblestone. |
| Reverse Logistics | Reverse logistics comprises of the sector of supply chains that process anything returning inwards through the supply chain or traveling ‘backward’ through the supply chain. |
| Road Freight Transport Service | Hiring a trucking agency for transport of commodities (raw materials or manufactured goods including both solids and liquids) form the origin to a destination within the country (domestic) or cross-border (international) constitutes road freight transport market. The service might be Full-Truck-Load or Less than-Truck-Load, containerized or non-containerized, temperature controlled or non temperature controlled, short haul or long haul. |
| Tautliner vehicle | Tautliner and curtainsider are used as generic names for curtain sided trucks/trailers. The curtains are permanently fixed to a runner at the top and detachable rails/poles at front and rear, allowing the curtains to be drawn open and forklifts used all along the sides for easy and efficient loading and unloading. When closed for travel, vertical load restraint straps are attached to a rope rail beneath the truck bed, connecting the truck bed and curtain along both sides. Winches at either end of the curtain tension it, hence the 'Tautliner' name. This stops the curtain from flapping or drumming in the wind and can also help retain light loads from slipping sideways. |
| Transport for hire or reward | The carriage for remuneration of goods. |
| Unpaved Road | Road with a stabilized base not surfaced with crushed stone, hydrocarbon binder or bituminized agents, concrete or cobblestone. |


Research Methodology
Mordor Intelligence follows a four-step methodology in all our reports.
- Step-1: Identify Key Variables: In order to build a robust forecasting methodology, the variables and factors identified in Step-1 are tested against available historical market numbers. Through an iterative process, the variables required for market forecast are set and the model is built on the basis of these variables.
- Step-2: Build a Market Model: Market-size estimations for the forecast years are in nominal terms. Inflation is considered to be a part of the pricing, and the average selling price (ASP) is varying throughout the forecast period for each country
- Step-3: Validate and Finalize: In this important step, all market numbers, variables and analyst calls are validated through an extensive network of primary research experts from the market studied. The respondents are selected across levels and functions to generate a holistic picture of the market studied.
- Step-4: Research Outputs: Syndicated Reports, Custom Consulting Assignments, Databases & Subscription Platforms


