Market Overview
| Study Period | 2020 - 2031 |
|---|---|
| Forecast Data Period | 2026 - 2031 |
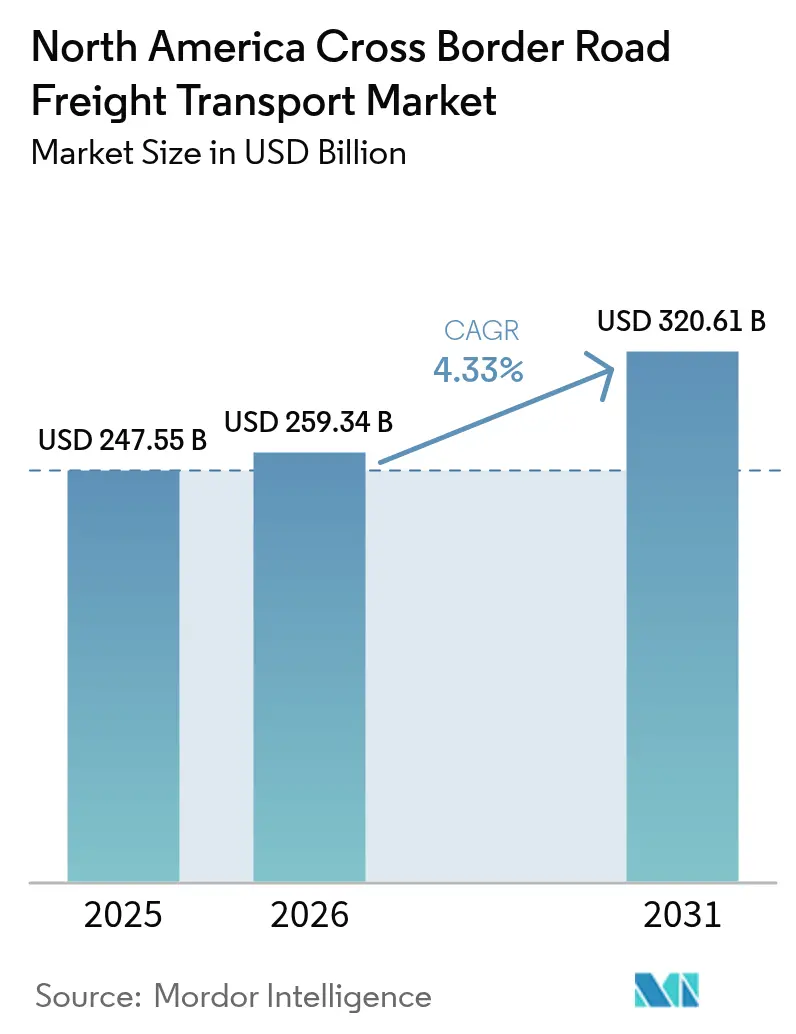
| Base Year Market Size (2025) | USD 247.55 Billion |
| Market Size (2026) | USD 259.34 Billion |
| Market Size (2031) | USD 320.61 Billion |
| Growth Rate (2026 - 2031) | 4.33% CAGR |
| Market Concentration | Low |
Major Players *Disclaimer: Major Players sorted in no particular order Image © Mordor Intelligence. Reuse requires attribution under CC BY 4.0. | |
North America Cross Border Road Freight Transport Market Analysis by Mordor Intelligence
The North America Cross Border Road Freight Transport Market size is expected to increase from USD 247.55 billion in 2025 to USD 259.34 billion in 2026 and reach USD 320.61 billion by 2031, growing at a CAGR of 4.33% over 2026-2031. Intensifying trade integration under the United States-Mexico-Canada Agreement (USMCA) keeps daily truck volumes elevated, while technology investments from automated customs documentation to artificial-intelligence wait-time prediction strip hours from crossing windows and unlock fresh capacity. Nearshoring continues to redraw freight corridors as manufacturers relocate production from Asia to Mexico, converting traditional ocean moves into rapid regional trucking lanes. Rail consolidation, highlighted by the Canadian Pacific Kansas City (CPKC) merger, introduces single-line competition that pushes premium truckload providers to differentiate on speed, visibility, and security. Meanwhile, federal incentives for battery production trigger high-value, time-critical flows of lithium-ion cells and cathode materials, anchoring long-term demand for specialized cross-border trucking capacity in the North America cross-border road freight transport market.
Key Report Takeaways
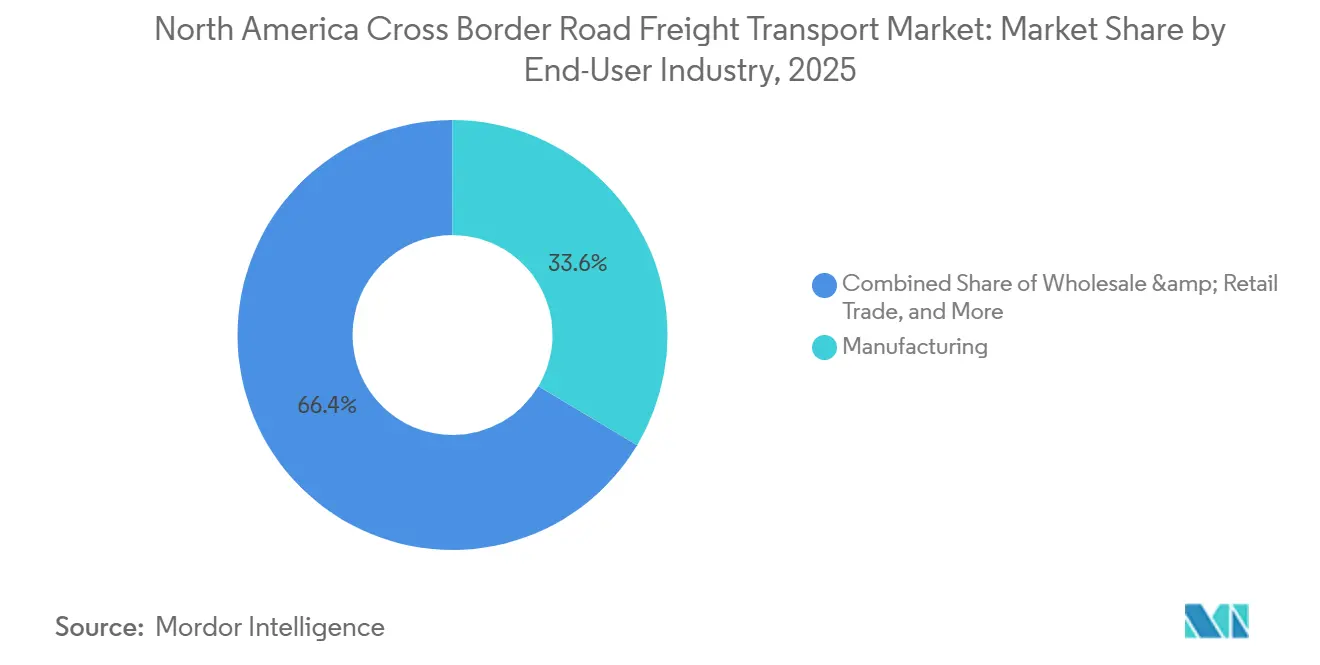
- By end-user industry, manufacturing held 33.56% of the North America cross border road freight transport market share in 2025, while wholesale and retail trade is forecast to grow at a 5.11% CAGR through 2031.
- By geography, the United States accounted for 86.72% of the North America cross border road freight transport market size in 2025, and Mexico is advancing at a 5.78% CAGR to 2031.
Note: Market size and forecast figures in this report are generated using Mordor Intelligence’s proprietary estimation framework, updated with the latest available data and insights as of 2026.
North America Cross Border Road Freight Transport Market Trends and Insights
Drivers Impact Analysis*
| Driver | (~) % Impact on CAGR Forecast | Geographic Relevance | Impact Timeline |
|---|---|---|---|
| USMCA de-minimis revision increases flows | +0.7% | United States-Mexico e-commerce corridors | Short term (≤ 2 years) |
| CPKC single-line rail competition | +0.6% | I-35 manufacturing belt | Medium term (2-4 years) |
| AI border wait-time prediction | +0.5% | Laredo, El Paso, Detroit crossings | Short term (≤ 2 years) |
| Scope-3 emissions mandates | +0.4% | California and Northeast corporate lanes | Medium term (2-4 years) |
| Smart chassis and trailer telematics | +0.6% | Bidirectional North American corridors | Medium term (2-4 years) |
| Inflation Reduction Act EV credits | +0.5% | Mexico battery hubs and United States assembly plants | Long term (≥ 4 years) |
| Source: Mordor Intelligence | |||


USMCA De-minimis Revision Increases Cross-border Cargo Flows
Proposed harmonization of de-minimis thresholds prompts shippers to accelerate parcel movements ahead of potential rule changes, elevating daily crossings and driving investment in adaptive customs-brokerage software that can recalibrate duty calculations on the fly. E-commerce merchants split orders into multiple sub-USD 800 parcels to sustain duty-free status, swelling transaction counts and intensifying demand for agile less-than-truckload capacity. The North America cross-border road freight transport market records a visible uptick in small-package volumes as a direct consequence of this defensive shipping posture[1]“USMCA Implementation and De Minimis Thresholds,” Office of the United States Trade Representative, ustr.gov .
CPKC Single-Line Rail Competition Triggers Premium Truckload Repositioning
Completion of the CPKC merger in 2024 creates a seamless tri-national rail spine from British Columbia to Veracruz. Shippers quickly test the new rail option for grain, chemicals, and auto parts, compelling premium truckload operators to double down on transit-time guarantees, cold-chain compliance, and 24/7 visibility. Cross-border spot truck rates for expedited services rose 8-12% in 2024 as carriers repositioned fleets toward value-added lanes, a shift that continues to reshape the North America cross-border road freight transport market in 2026[2]“Rail Merger Analysis and Competitive Impact,” Surface Transportation Board, stb.gov.
AI-Powered Border Wait-Time Prediction Optimizes Scheduling
Machine-learning engines that fuse historical Customs and Border Protection (CBP) data with live traffic and staffing feeds now predict border dwell with up to 90% accuracy, enabling dispatchers to stage departures for the lowest-congestion windows. Early adopters report 12-15% asset-turn gains plus 18-22% total-transit reductions on dense Laredo and Detroit corridors, tightening capacity in other day-of-week windows and setting new performance norms that lagging fleets must match.
Scope-3 Emissions Mandates Push Lane Consolidation
Mandatory SEC climate disclosures propel Fortune 500 shippers to quantify transportation footprints and eliminate empty miles. Carriers capable of combining compatible north- and south-bound loads gain favor, using consolidated manifests to cut vehicle-miles traveled by up to 11% on pilot programs. Emissions dashboards become standard in requests for proposal, making sustainability performance a decisive bid criterion throughout the North America cross-border road freight transport market.
Restraints Impact Analysis*
| Restraint | (~) % Impact on CAGR Forecast | Geographic Relevance | Impact Timeline |
|---|---|---|---|
| Extreme-weather border closures | -0.7% | Northern crossings and winter-storm corridors | Short term (≤ 2 years) |
| Border-zone warehousing shortage | -0.5% | Laredo, El Paso, Detroit | Medium term (2-4 years) |
| Divergent state-level zero-emission rules | -0.4% | California, New York, Oregon, Washington | Long term (≥ 4 years) |
| Escalating cargo-theft insurance premiums | -0.6% | High-theft I-35 and I-10 corridors | Short term (≤ 2 years) |
| Source: Mordor Intelligence | |||
Extreme-weather Border Closures Disrupt Corridor Reliability
Volatile weather forces periodic shutdowns at key bridges such as Ambassador and Peace, leaving just-in-time plants idled once buffer stocks deplete[3]“Extreme Weather Events and Border Impacts,” National Weather Service, weather.gov. During the 2024 winter season alone, cumulative closures exceeded 84 hours, triggering emergency airfreight shipments at cost multiples of 8-10 times truck rates and eroding the North America cross-border road freight transport market’s overall efficiency.
Border-Zone Warehousing Shortage Inflates Dwell
Vacancy rates near Laredo plunged to 2.3% in 2024, pushing rents up 45-60% and extending truck dwell as freight awaits scarce dock doors. Carriers with owned or controlled border facilities cope better, while smaller operators face higher delays and costs. Added drayage legs of 50-80 miles inflate costs and clog access roads, a structural challenge expected to persist through 2028 unless accelerated permitting unlocks new capacity[4]“Warehouse Capacity and Rental Rates,” U.S. Bureau of Labor Statistics, bls.gov.
*Our forecasts treat driver/restraint impacts as directional, not additive. The impact forecasts reflect baseline growth, mix effects, and variable interactions.
Segment Analysis
By End-User Industry: Manufacturing Integration Drives Cross-border Complexity
The manufacturing segment commanded 33.56% of the North America cross-border road freight transport market share in 2025, underpinned by tightly synchronized automotive and electronics supply chains that shuttle components across borders multiple times before final assembly. The segment’s reliance on just-in-time inventory exposes it to minute-level delays, prompting carriers to deploy customs-pre-clearance tools and bonded shuttles that safeguard production uptime. Enhanced border infrastructure coupled with AI wait-time forecasting is expected to sustain mid-single-digit growth as original equipment manufacturers expand Mexican capacity for vehicle electrification.
Wholesale and retail trade is expanding at a 5.11% CAGR through 2031, fueled by e-commerce marketplaces shipping parcel-sized orders region-wide. Shipment-splitting strategies designed around current de-minimis thresholds generate dense volumes of low-weight consignments that favor asset-light consolidation specialists. As omnichannel retailers build micro-fulfillment centers near both primary borders, the North America cross-border road freight transport market size for retail distribution networks is projected to climb steadily, especially for value-added services such as returns management and last-mile re-sortation.


Geography Analysis
The United States dominates regional flows with 86.72% 2025 market share, processing more than 5.2 million commercial truck crossings annually and handling USD 288 billion in trade value through Laredo alone during 2024. Federal infrastructure spending directs USD 15 billion to modernize CBP facilities, deploy nonintrusive inspection tech, and widen connector highways, a slate that promises measurable capacity gains by 2028. Robust domestic demand, deep third-party logistics ecosystems, and widespread C-TPAT security certifications strengthen the United States’ hold on the North America cross-border road freight transport market.
Mexico’s network enjoys the fastest expansion at a 5.78% CAGR as OEMs ramp battery, electronics, and consumer-durable output for the United States markets. Digital customs mandates enhance transparency and reduce processing times, yet chronic border-zone warehousing shortages and periodic security incidents necessitate continued carrier investment in yard fencing, surveillance, and bonded terminals. The government’s Pro-Nearshoring agenda earmarks toll-road extensions and cold-chain funding that will reinforce growth corridors along Monterrey-Nuevo Laredo and Queretaro-El Paso.
Canada contributes stable volumes tied to lumber, grain, and automotive parts, but winter adversity challenges service reliability. The CPKC rail line offers a cost-efficient alternative for bulky southbound commodities; still, premium truck services retain share for time-critical parts and perishables. Planned bridge replacements at Windsor-Detroit and infrastructure hardening against lake-effect snow should preserve Canadian competitiveness inside the North America cross border road freight transport market through 2031.
Competitive Landscape
Market concentration is fragmented, with the top five carriers and brokers estimated to control a slightly significant share of regional revenue. Technology leadership sets the competitive tempo as fleets embed AI scheduling, automated brokerage, and end-to-end tracking to comply with shipper visibility mandates. Cross-border specialists differentiate through integrated customs brokerage arms, bilingual driver pools, and secure yard networks that deter cargo theft, a growing threat since 2024.
Strategic mergers continue, exemplified by DSV’s USD 16.3 billion acquisition of DB Schenker, which instantly scaled tri-national brokerage and warehousing capacities. TFI International’s purchase of Daseke fortified heavy-haul and flatbed offerings along United States-Canada construction corridors, while C.H. Robinson’s bonded-warehouse launch in 2025 underscores the pivot toward combined consolidation, clearance, and final-mile delivery.
Opportunity white spaces concentrate in electric-vehicle battery logistics, cross-border returns management for fashion e-commerce, and temperature-controlled pharma moves requiring GDP-compliant monitoring. Autonomous-truck pilots at select ports-of-entry hint at longer-term disruption, yet regulatory harmonization and infrastructure investments remain prerequisites before self-driving assets can materially alter the competitive order in the North America cross border road freight transport market.
North America Cross Border Road Freight Transport Industry Leaders
United Parcel Service of America, Inc. (UPS)
C.H. Robinson Worldwide, Inc.
Landstar System, Inc.
Schneider National, Inc.
Knight-Swift Transportation Holdings, Inc.
- *Disclaimer: Major Players sorted in no particular order


Recent Industry Developments
- September 2025: C.H. Robinson unveiled a bundled service that merges freight consolidation in Mexico, bonded warehousing, and AI-optimized United States delivery, cutting shipper costs by up to 40%.
- April 2025: DSV completed its EUR 14.3 billion (USD 16.3 billion) takeover of DB Schenker, forming the world’s largest logistics firm with expanded tri-national brokerage and drayage capacity.
- January 2025: UPS added UPS Ground Saver® and UPS® Ground with Freight Pricing, offering economical small-parcel and heavy-parcel options integrated into its Smart Logistics Network.
- April 2024: TFI International bought Daseke for USD 1.1 billion, scaling flatbed and heavy-haul expertise on the United States-Canada lanes.


North America Cross Border Road Freight Transport Market Report Scope
By End-User Industry
| Agriculture, Fishing, and Forestry |
| Construction |
| Manufacturing |
| Oil and Gas, Mining and Quarrying |
| Wholesale and Retail Trade |
| Others |
Country
| United States |
| Canada |
| Mexico |
| Rest of North America |
| By End-User Industry | Agriculture, Fishing, and Forestry |
| Construction | |
| Manufacturing | |
| Oil and Gas, Mining and Quarrying | |
| Wholesale and Retail Trade | |
| Others | |
| Country | United States |
| Canada | |
| Mexico | |
| Rest of North America |


Market Definition
- Agriculture, Fishing, and Forestry (AFF) - This end user industry segment captures the external (outsourced) logistics expenditure incurred by the AFF industry players on road freight transport service. The end user players considered are the establishments primarily engaged in growing crops, raising animals, harvesting timber, harvesting fish & other animals from their natural habitats and providing related support activities. Herein, across the value chain, Logistics Service Providers (LSPs) play a crucial role in acquisition, storage, handling, transportation, and distribution activities for the optimal & continuous flow of inputs (seeds, pesticides, fertilizers, equipment, and water) from manufacturers or suppliers to the producers and smooth flow of output (produce, agro-goods) to distributors/ consumers. This includes both termperature controlled and non-temperature controlled logistics, as and when required according to the shelf life of goods being transported or stored.
- Construction - This end user industry segment captures the external (outsourced) logistics expenditure incurred by the construction industry players, on road freight transport service. The end user players considered are the establishments primarily engaged in constructing, repairing and renovating residential & commercial buildings, infrastructure, engineering works, subdividing and developing land. Logistics Service Providers (LSPs) play a crucial role in increasing profitability of construction projects by maintaing the inventory of raw materials & equipment, time-critical supplies and by providing other value added services for effective project management.
- Containerized Road Freight Transport - The segment captures the external (outsourced) logistics expenditure incurred by the road freight transport service end users on Full-Truck-Load (FTL) services. FTL road freight transport is characterized as a full single load not combined with other shipments. It comprises of shipments (i) devoted to the goods of a single shipper (ii) taken directly from a point of origin to one or more destination points (iii) comprising of bulk mail truck transportation (iv) comprising of both Container (Full Container Load, FCL)/Non-Container trucking services (v)comprsing of goods requiring temperature controlled or non-temperature controlled transportation services (vi) comprising of bulk liquid tankering (vii) invoving trucking of waste (viii) hazardous material trucking. Related value added services (VAS) of sorting, consolidation, deconslidation are included in the other services segment of freight and logistics market.
- Export Trends and Import Trends - Overall logistics performance of an economy is positively and significantly (statistically) correlated to its trade performance (exports and imports). Hence, in this industry trend, total value of trade, major commodities/ commodity groups and the major trade partners, for the studied geography (country or region as per the scope of report) have been analysed alongside the impact of major trade/logistics infrastructure investments & regulatory environment.
- Fluid Goods - The segment captures the external (outsourced) logistics expenditure incurred by the road freight transport service end users for the transport of bulk liquids, that are often used in extraction, manufacturing, food processing, agriculture industries among others. It includes transportation of liquids like (i) Chemicals/ hazardous goods (for instance acids) (ii) Water (potable as well as waste) (iii) Oil and gas (upstream as well as downstream like gasoline, fuel, crude oil, or propane), (iv) Food grade bulk liquids (like milk, or juice), (v) Rubber, (vi) Agrichemical products, among others. These goods are generally transported through tanker trucking.
- Fuel Price - Fuel price spikes can cause delays and diruption for logistics service providers (LSPs), while drops in the same can result in higher short-term profitability and increased market rivalry to offer consumers with the best deals. Hence, the fuel price variations have been studied over the review period and presented along with the causes as well as market impacts.
- Full-Truck-Load (FTL) Road Freight Transport - The segment captures the external (outsourced) logistics expenditure incurred by the road freight transport service end users on Full-Truck-Load (FTL) services. FTL road freight transport is characterized as a full single load not combined with other shipments. It comprises of shipments (i) devoted to the goods of a single shipper (ii) taken directly from a point of origin to one or more destination points (iii) comprising of bulk mail truck transportation (iv) comprising of both Container (Full Container Load, FCL)/Non-Container trucking services (v)comprsing of goods requiring temperature controlled or non-temperature controlled transportation services (vi) comprising of bulk liquid tankering (vii) invoving trucking of waste (viii) hazardous material trucking. Related value added services (VAS) of sorting, consolidation, deconslidation are included in the other services segment of freight and logistics market.
- GDP Distribution by Economic Activity - Nominal Gross Domestic Product and distribution of the same, across major economic sectors in the geography studied (country or region as per scope of the report) have been studied and presented in this industry trend. As GDP is positively related to the profitability and growth of logistics industry, this data has been used in adjunction to the input-output tables/ supply-use tables for analyzing the potential major contributing sectors towards the logistics demand.
- GDP Growth by Economic Activity - Growth of Nominal Gross Domestic Product across major economic sectors, for the geography studied (country or region as per scope of the report) have been presented in this industry trend. This data has been utilized for assessing the growth of logistics demand from all the market end users (economic sectors considered here).
- Inflation - Variations in both Wholesale Price Inflation (YoY change in producer price index) and Consumer Price Inflation have been presented in this industry trend. This data has been used to assess the inflationary environment as it plays a vital role in smooth functioning of the supply chain, directly impacting the logistics operational cost components e.g., pricing of tyres, driver wages & benefits, energy/fuel prices, maintenace costs, toll charges, warehousing rents, custom brokerage, forwarding rates, courier rates etc. hence impacting the overall freight and logistics market.
- Key Industry Trends - The report section named "Key Industry Trends" include all the key variables/parameters studied to better analyze the market size estimates and forecasts. All the trends have been presented in the form of data points (time series or latest available data points) along with analysis of the paramter in the form of concise market relevant commentary, for the geography studied (country or region as per the scope of report).
- Key Strategic Moves - The action taken by a company to differentiate from its competitor or used as a general strategy is referred to as a key strategic move (KSM). This includes (1) Agreements (2) Expansions (3) Financial Restructuring (4) Mergers and Acquisitions (5) Partnerships, and (6) Product Innovations. Key players (Logistics Service Providers, LSPs) in the market have been shortlisted, their KSM have been studied and presented in this section.
- Less than-Truck-Load (LTL) Road Freight Transport - The segment captures the external (outsourced) logistics expenditure incurred by the road freight transport service end users on Less than-Truck-Load (LTL) services. LTL road freight transport is characterized as multiple shipments combined onto a single truck for multiple deliveries within a network. It comprises of establishments (i) primarily engaged in general and specialized freight trucking of less than complete truck-loads, (ii) characterized by the use of terminals to consolidate shipments, generally from several shippers, into a single truck for haulage between a load assembly terminal and a disassembly terminal, where the load is sorted and shipments are re-routed for delivery (iv) Less than-Container-Load (LCL) shipping/ Groupage Shipping in case of trucking services. The activities in scope include (i) local pick-up, (ii) line-haul, and (iii) local delivery. Related value added services (VAS) of sorting, consolidation, deconslidation are included in the other services segment of freight and logistics market.
- Logistics Performance - Logistics Performance and Logistics Costs are the backbone of trade, and influences trade costs, making countries compete globally. Logistics performance is influenced by market wide adopted supply chain management strategies, government services, investments & policies, fuel/ energy costs, inflationary environment etc. Hence, in this industry trend, the logistics performance of the geography studied (country/ region as per the scope of report) has been analysed and presented over the review period.
- Major Truck Suppliers - Market share of truck brands is influenced by factors like geographical preferences, portfolio of truck types, truck prices, local production, truck repair & maintenance service peneteration, customer support, technological innovations (like electric vehicles, digitalization, autonomous trucks), fuel efficiency, financing options, annual maintenance costs, availability of substitutes, marketing startegies etc. Hence, the distribution (share % for base year of the study) of truck sales volume for leading truck brands and commentary on current market scenario & market anticipation over the forecast period have been presented in this industry trend.
- Manufacturing - This end user industry segment captures the external (outsourced) logistics expenditure incurred by the Manufacturing industry players, on road freight transport service. The end user players considered are the establishments primarily engaged in the chemical, mechanical or physical transformation of materials or substances into new products. Logistics Service Providers (LSPs) play a crucial role in maintaining a smooth flow of raw materials across the supply chain, enabling timely delivery of finished goods to distributors or end customers and storing & supplying the raw materials to clients for just-in-time manufacturing.
- Modal Share - Freight Modal Share is influenced by factors like modal productivity, government regulations, containerization, distance of shipment, temperature control requirements, type of goods, international trade, terrain, speed of delivery, shipment weight, bulk shipments, etc. Also, modal share by tonnage (tons) and modal share by freight turnover (ton-km) differ as per average distance of shipments, weight of major commodity groups transported in the economy and number of trips. This industry trend represents the distribution of freight transported by mode of transport (tons as well as ton-km), for the study base year.
- Oil and Gas, Mining and Quarrying - This end user industry segment captures the external (outsourced) logistics expenditure incurred by the extraction industry players, on road freight transport service. The end user players considered are the establishments that extract naturally occurring mineral solids, such as coal and ores; liquid minerals, such as crude petroleum; and gases, such as natural gas. Logistics Service Providers (LSPs) covers entire phases from upstream to downstream and plays a crucial role in the transportation of machinery, drilling equipments, extracted minerals, crude oil & natural gas and refined/ processed products from one place to another.
- Other End Users - Other end user segment captures the external (outsourced) logistics expenditure incurred by the financial services (BFSI), real estate, educational services, healthcare, and professional services (administrative, waste management, legal, architectural, engineering, design, consulting, scientific R&D), on road freight transport service. Logistics Service Providers (LSPs) plays a crucial role in the reliable movement of supplies and documents to/from these industries such as transporting any equipment or resources required, shipping confidential documents and files, movement of medical goods & supplies (surgical supplies and instruments, including gloves, masks, syringes, equipment) to name a few.
- Producer Price Inflation - It indicates inflation from viewpoint of the producers viz. the average selling price received for their output over a period of time. Annual change (YoY) of producer price index is reported as wholesale price inflation in the "Inflation" industry trend. As WPI captures dynamic price movements in most comprehensive way, it is widely used by governments, banks, industry, business circles and is deemed important in formulation of trade, fiscal and other economic policies. The data has been used in adjunction to consumer price inflation for better understanding the inflationary environment.
- Road Freight Pricing Trends - Freight pricing by mode of transport (USD/tonkm), over the review period, has been presented in this industry trend. The data has been used in assessing the inflationary environment, impact on trade, freight turnover (tonkm), road freight transport market demand and hence the road freight transport market size.
- Road Freight Tonnage Trends - Freight tonnage (weight of goods in tons) handled by mode of transport, over the review period, has been presented in this industry trend. The data has been used as one of the parameters apart from average distance per shipment (km), freight volume (tonkm), and freight pricing (USD/tonkm) to assess the freight transport market size.
- Road Freight Transport - Hiring a road freight transport logistics service provider (LSP) or haulier (outsourced logistics), for the transport of commodities constitutes road freight transport market. The scope of study includes (i) road transport of goods reported by hauliers registered in the reporting countries (ii) transport of raw materials or manufactured goods (solids as well as fluids) (iii) transport using commerical motor vehicles (rigid trucks or tractor-trailers, (iv) Full-Truck-Load (FTL) or Less than-Truck-Load (LTL) transport (v) containerized or non-containerized transport (vi) temperature controlled or non-temperature controlled trasnport, (vii) short haul or long haul (Over-the-road, OTR) transport, (viii) used office or household goods transport (movers and packers), (ix) other specialized cargo transport (dangerous goods, oversized cargo) and (x) outsourced first mile/ middle mile/last mile delivery shipments undertaken by road freight transport players. The scope does not include (i) transport undertaken by hauliers registered in other countries (ii) last mile meal delivery market (iii) grocery delivery market (iv) transportation via road network undertaken/ reported by Courier, Express, and Parcel (CEP) players.
- Road Length - As infrastructure plays a vital role in an economy's logistics performance, variables like length of roads, distribution of road length by surface category (paved v/s unpaved), distribution of road length by road classification (expressways v/s highways v/s other roads), have been analysed and presented in this industry trend.
- Segmental Revenue - Segmental Revenue has been triangulated or computed and presented for all the major players in the market. It refers to the road freight transport market specific revenue earned by the company, over the base year of study, in the geography studied (country or region as per the scope of report). It is computed through the study and analysis of major parameters like financials, service portfolio, employee strength, fleet size, investments, number of countries present in, major economies of concern, etc. that have been reported by the company in its annual reports, webpage. For companies having scarce financial disclosures, paid databases like D&B Hoovers, Dow Jones Factiva have been resorted to and verified through industry/expert interactions.
- Short Haul Road Freight Transport - The segment captures the external (outsourced) logistics expenditure incurred by the road freight transport service end users on local trucking (less than 100 miles). It includes the road transport of goods (i) within a single administrative area and its hinterland, (ii) by smaller trucks and pickup trucks (iii) via containerized as well as dry bulk services (iv) intermodal from ports, container terminals or airports, and (v) outsourced first mile/ last mile delivery shipments undertaken by road freight transport players.
- Transport and Storage Sector GDP - Value and growth of Transport and Storage Sector GDP has a direct relation to the freight and logistics market size, and hence road freight transport market size. Therefore, this variable has been studied and presented over the review period, in value terms (USD) and as share % of total GDP, in this industry trend. The data has been supported by concise and relevant commentary around the investments, developments, and current market scenario.
- Trends in E-Commerce Industry - Enhanced internet connectivity and boom in smartphone penetration, coupled with increasing disposable incomes, has led to a phenomenal growth in the e-commerce market globally. Online shoppers require fast and efficient delivery of their orders leading to an increase in the demand for logistics services especially e-commerce fulfilment services. Hence, the Gross Merchandise Value (GMV), historial and projected growth, breakup of major commodity groups in e-commerce industry for the studied geography (country or region as per scope of the report) have been analysed and presented in this industry trend.
- Trends in Manufacturing Industry - Manufacturing industry involves the transformation of raw materials into finished products, while logistics industry ensures the efficient flow of raw materials to the factory, and the transport of manufactured products to the distributors & consumers. Demand-Supply of both industries are highly cross-linked and critical for a seamless supply chain. Hence, the Gross Value Added (GVA), breakup of GVA into major manufacturing sectors, and growth of manufacturing industry over the review period have been analysed and presented, in this industry trend.
- Trucking Fleet Size By Type - Market share of truck types is influenced by factors like geographical preferences, major end user industries, truck prices, local production, truck repair & maintenance service peneteration, customer support, technological disruptions (like electric vehicles, digitalization, autonomous trucks) etc. Hence, the distribution (share % for base year of study) of truck parc volume by type of truck, market disruptors, truck manufacturing investments, truck specifications, truck use & import regulations, and market anticipation over the forecast period have been presented in this industry trend.
- Trucking Operational Costs - The prime reasons for measuring/ benchmarking logistics performance of any trucking company are to reduce operational costs and increase profitability. On the other hand, measuring operational costs helps to identify whether and where to make operational changes to control expenses and identify areas for improved performance. Hence, in this industry trend, trucking operational costs and the variables involved viz. driver wages & benefits, fuel prices, repairs & maintenance costs, tyre costs etc. have been studied over the base year of study, and presented for the geography studied (country or region as per the scope of report).
- Wholesale and Retail Trade - This end user industry segment captures the external (outsourced) logistics expenditure incurred by the wholesalers and retailers, on road freight transport service. The end user players considered are the establishments primarily engaged in wholesaling or retailing merchandise, generally without transformation, and rendering services incidental to the sale of merchandise. Logistics Service Providers (LSPs) plays a crucial role in the reliable movement of supplies to and finished products from production houses to the distributors and finally to the end customer covering activites like material sourcing, transportation, order fulfillment, warehousing & storage, demand forecasting, inventory management etc.
| Keyword | Definition |
|---|---|
| Cabotage | Road transport by a motor vehicle registered in a country performed on the national territory of another country. |
| Cross Docking | Cross docking is a logistics procedure where products from a supplier or manufacturing plant are distributed directly to a customer or retail chain with marginal to no handling or storage time. Cross docking takes place in a distribution docking terminal; usually consisting of trucks and dock doors on two (inbound and outbound) sides with minimal storage space. The name ‘cross docking’ explains the process of receiving products through an inbound dock and then transferring them across the dock to the outbound transportation dock. |
| Cross Trade | International road transport between two different countries performed by a road motor vehicle registered in a third country. A third country is a country other than the country of loading/embarkation and than the country of unloading/disembarkation. |
| Dangerous Goods | The classes of dangerous goods carried by Road are those defined by the fifteenth revised edition of the UN Recommendations on the Transport of Dangerous Goods, United Nations, Geneva 2007. They include Class 1: Explosives; Class 2: Gases; Class 3: Flammable Liquids; Class 4: Flammable solids- substances liable to spontaneous combustion; substances which, on contact with water, emit flammable gases; Class 5: Oxidizing substances and organic peroxides; Class 6: Toxic and infectious substances; Class 7: Radioactive material and Class 8: Corrosive substances, Class 9: Miscellaneous dangerous substances and articles. |
| Direct Shipment | Direct shipment is a method of delivering goods from the supplier or the product owner to the customer directly. In most cases, the customer orders the goods from the product owner. This delivery scheme reduces transportation and storage costs, but requires additional planning and administration. |
| Drayage | A drayage is a form of trucking service that connects the different modes of shipping (intermodal), such as ocean freight or air freight. It’s a short-haul trip that transports goods from one place to another, usually before or after its long-haul shipping process. Drayage trucks move cargo to and from various destinations, such as container ships, storage lots, order fulfillment warehouses, and rail yards. Typically, drayage only transports goods in short distances and operates only in one metropolitan area. It also requires only one trucker in a single shift. But despite this, but it plays an important role in long-haul shipping because it gets the goods to the cargo and vice versa. It makes intermodal transport much more efficient and enables the seamless transfer of goods to the end customer. |
| Dry van | A dry van is a type of semi-trailer that's fully enclosed to protect shipments from outside elements. Designed to carry palletized, boxed or loose freight, dry vans aren't temperature-controlled (unlike refrigerated “reefer” units) and can't carry oversized shipments (unlike flatbed trailers). |
| Final Demand | Final demand includes all types of commodities (goods as well as services) consumed as final use and might include personal consumption, or consumption by government, by businesses as capital investment, and as exports. includes all types of commodities (goods as well as services) consumed as final use and might include personal consumption, or consumption by government, by businesses as capital investment, and as exports. |
| Flatbed Truck | A flatbed truck is a type of truck with rigid design. It has a back body that is flatly shaped for easy loading and unloading of goods. The flatbed truck is mostly used to transport heavy, oversized, wide and indelicate goods such as machinery, building supplies or equipment. Due to the truck open body, the goods transported with it must not be vulnerable to rain. By functionality, the flatbed truck is comparable to a flatbed trailer. |
| Inbound Logistics | Inbound logistics is the way materials and other goods are brought into a company. This process includes the steps to order, receive, store, transport and manage incoming supplies. Inbound logistics focuses on the supply part of the supply-demand equation. |
| Intermediate Demand | Intermediate demand includes goods, services, and maintenance and repair construction sold to businesses, excluding capital investment. |
| International Loaded | Place of loading of goods in reporting country (i.e., country in which the vehicle performing the transport is registered) and place of unloading in a different country. |
| International Unloaded | Place of unloading of goods in reporting country (i.e., country in which the vehicle performing the transport is registered) and place of loading in a different country. |
| OOG cargo | Out of Gauge (OOG) cargo is any cargo that can not be loaded into six-sided shipping containers simply because it is too large. The term is a very loose classification of all cargo with dimensions beyond the maximum 40HC container dimensions. That is a length beyond 12.05 meters – a width beyond 2.33 meters – or a height beyond 2.59 meters. |
| Pallets | Raised platform, intended to facilitate the lifting and stacking of goods. |
| Part load | A part load describes goods which only fills a truck partially. In essence, the quantity of the shipment is bigger than the Less Than Truckload (LTL) shipment. Also, the shipment cannot fully occupy a truck i.e. its capacity is much lower than a Full Truckload (FTL) shipment. |
| Paved Road | Road surfaced with crushed stone (macadam) with hydrocarbon binder or bituminized agents, with concrete or with cobblestone. |
| Reverse Logistics | Reverse logistics comprises of the sector of supply chains that process anything returning inwards through the supply chain or traveling ‘backward’ through the supply chain. |
| Road Freight Transport Service | Hiring a trucking agency for transport of commodities (raw materials or manufactured goods including both solids and liquids) form the origin to a destination within the country (domestic) or cross-border (international) constitutes road freight transport market. The service might be Full-Truck-Load or Less than-Truck-Load, containerized or non-containerized, temperature controlled or non temperature controlled, short haul or long haul. |
| Tautliner vehicle | Tautliner and curtainsider are used as generic names for curtain sided trucks/trailers. The curtains are permanently fixed to a runner at the top and detachable rails/poles at front and rear, allowing the curtains to be drawn open and forklifts used all along the sides for easy and efficient loading and unloading. When closed for travel, vertical load restraint straps are attached to a rope rail beneath the truck bed, connecting the truck bed and curtain along both sides. Winches at either end of the curtain tension it, hence the 'Tautliner' name. This stops the curtain from flapping or drumming in the wind and can also help retain light loads from slipping sideways. |
| Transport for hire or reward | The carriage for remuneration of goods. |
| Unpaved Road | Road with a stabilized base not surfaced with crushed stone, hydrocarbon binder or bituminized agents, concrete or cobblestone. |


Research Methodology
Mordor Intelligence follows a four-step methodology in all our reports.
- Step-1: Identify Key Variables: In order to build a robust forecasting methodology, the variables and factors identified in Step-1 are tested against available historical market numbers. Through an iterative process, the variables required for market forecast are set and the model is built on the basis of these variables.
- Step-2: Build a Market Model: Market-size estimations for the forecast years are in nominal terms. Inflation is considered to be a part of the pricing, and the average selling price (ASP) is varying throughout the forecast period for each country
- Step-3: Validate and Finalize: In this important step, all market numbers, variables and analyst calls are validated through an extensive network of primary research experts from the market studied. The respondents are selected across levels and functions to generate a holistic picture of the market studied.
- Step-4: Research Outputs: Syndicated Reports, Custom Consulting Assignments, Databases & Subscription Platforms


