Market Overview
| Study Period | 2020 - 2031 |
|---|---|
| Forecast Data Period | 2026 - 2031 |
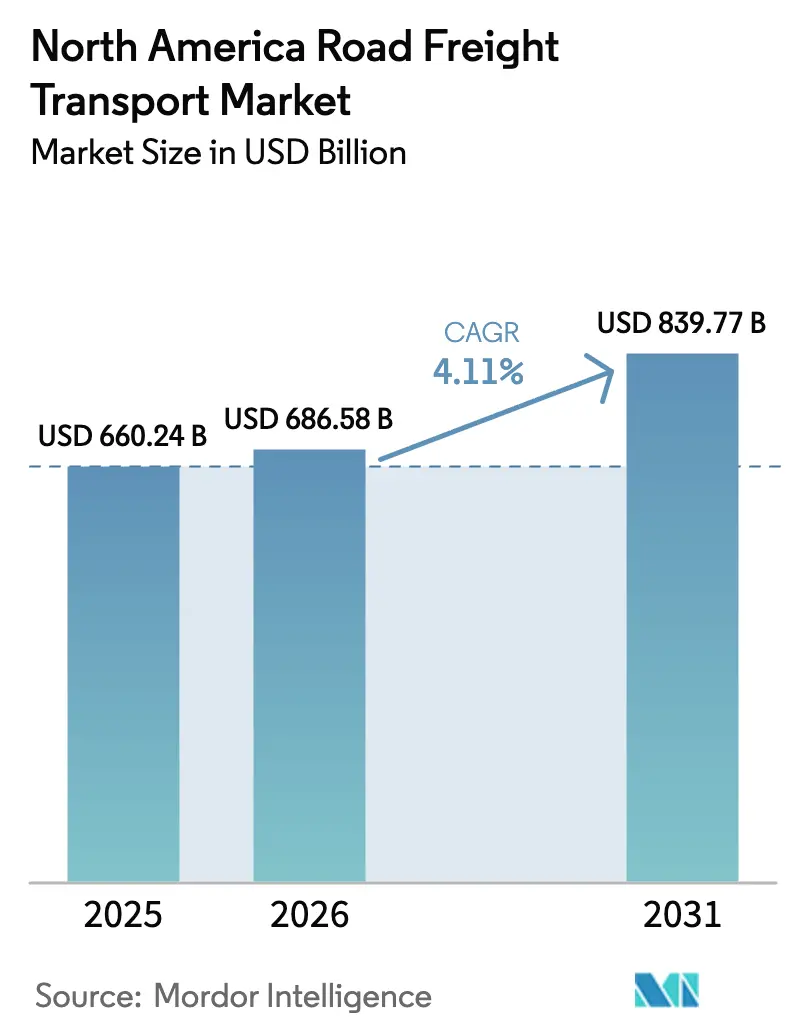
| Base Year Market Size (2025) | USD 660.24 Billion |
| Market Size (2026) | USD 686.58 Billion |
| Market Size (2031) | USD 839.77 Billion |
| Growth Rate (2026 - 2031) | 4.11% CAGR |
| Market Concentration | Low |
Major Players *Disclaimer: Major Players sorted in no particular order Image © Mordor Intelligence. Reuse requires attribution under CC BY 4.0. | |
North America Road Freight Transport Market Analysis by Mordor Intelligence
The North America road freight transport market size is expected to increase from USD 660.24 billion in 2025 to USD 686.58 billion in 2026 and reach USD 839.77 billion by 2031, growing at a CAGR of 4.11% over 2026-2031.
Manufacturing-led freight volumes, cross-border trade modernization, and rapid growth of biologics distribution collectively reshape capacity allocation and pricing across temperature-controlled and specialized trucking services. Shippers continue to outsource previously captive fleets, while digital customs clearance tools compress border dwell times and enhance asset utilization. Private-sector investment in hydrogen and cold-chain corridors is spawning new lanes that require hazmat or pharmaceutical-grade compliance. At the same time, carriers contend with rising insurance premiums, semiconductor-related tractor shortages, and congestion-pricing fees that erode operating margins.
Key Report Takeaways
- By end-user industry, manufacturing led with 34.81% of the North America road freight transport market share in 2025, and wholesale and retail trade freight is forecast to expand at a 5.85% CAGR through 2031.
- By destination, domestic freight commanded a 62.37% share of the North America road freight transport market size in 2025; international and cross-border freight is projected to advance at a 5.03% CAGR between 2026 and 2031.
- By truckload specification, full-truck-load operations held 78% of the North America road freight transport market share in 2025; less-than-truck-load services are expected to record a 6.18% CAGR through 2031.
- By containerization, non-containerized held 83.93% of the North America road freight transport market size in 2025, while Containerized services are expected to record a 6.71% CAGR through 2031.
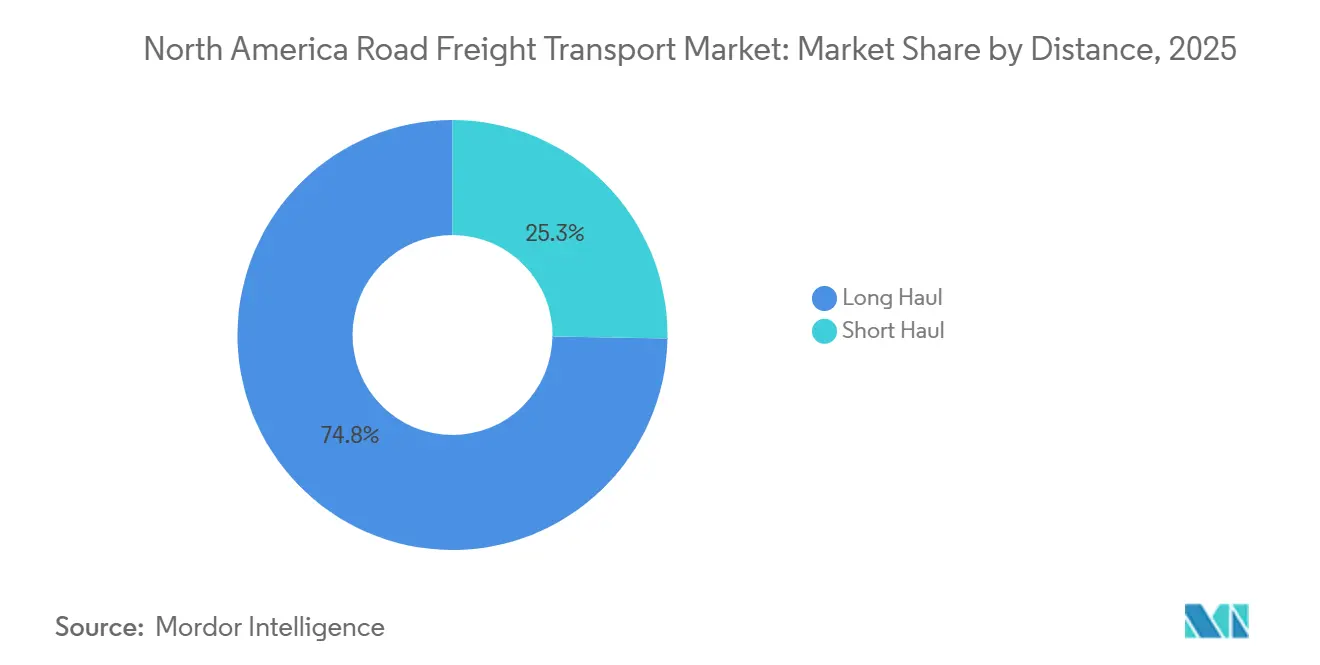
- By distance, long haul held 74.75% of the North America road freight transport market share in 2025, while it is expected to record a 4.40% CAGR through 2031.
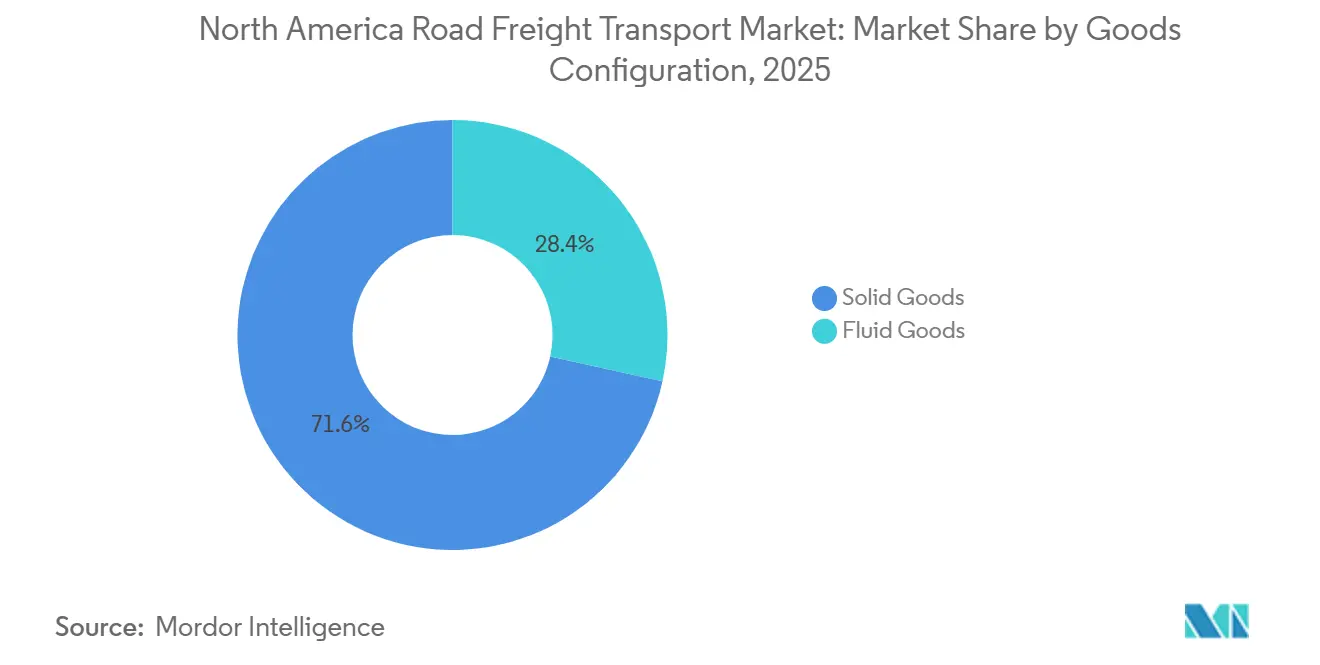
- By goods configuration, solid goods held 71.55% of the North America road freight transport market size in 2025, while fluid goods are expected to record a 4.98% CAGR through 2031.
- By temperature control, non-temperature-controlled held 94.20% of the North America road freight transport market share in 2025, while temperature-controlled is expected to record a 7.72% CAGR through 2031.
- By country, the United States accounted for 67.95% of regional freight value in 2025; Mexico is set to register the highest national CAGR of 5.18% over 2026-2031.
Note: Market size and forecast figures in this report are generated using Mordor Intelligence’s proprietary estimation framework, updated with the latest available data and insights as of 2026.
North America Road Freight Transport Market Trends and Insights
Drivers Impact Analysis*
| Driver | (~) % Impact on CAGR Forecast | Geographic Relevance | Impact Timeline |
|---|---|---|---|
| CBP digital border-clearance systems | +0.9% | United States–Mexico and United States–Canada crossings | Short term (≤ 2 years) |
| Blue-hydrogen corridor logistics demand | +0.4% | California, Pacific Northwest, Texas hydrogen hubs | Long term (≥ 4 years) |
| Outsourcing of private retail truck fleets | +0.8% | United States retail distribution networks | Medium term (2-4 years) |
| Regulatory approval of truck-platooning | +0.5% | Interstate highway corridors, primarily United States | Medium term (2-4 years) |
| Expansion of biologics cold-chain movements | +1.1% | Pharmaceutical hubs across North America | Short term (≤ 2 years) |
| ESG-linked freight-finance cost incentives | +0.6% | The United States and Canada, with limited Mexico adoption | Medium term (2-4 years) |
| Source: Mordor Intelligence | |||


CBP Digital Border-Clearance Systems
Customs and Border Protection’s ACE platform cuts average clearance times by nearly 40% by unifying 47 agency requirements within a single digital window. The gain in processing speed raises truck turns per week and lowers detention costs, particularly on the Laredo and Detroit corridors where cross-border demand is climbing fastest. ACE data analytics also sharpens enforcement focus on high-risk loads, allowing compliant carriers to traverse with minimal inspection, which increases shipper confidence in predictable transit[1].U.S. Customs and Border Protection, “Automated Commercial Environment (ACE),” cbp.gov
Blue-Hydrogen Corridor Logistics Demand
California and Texas hydrogen hubs have begun large-scale liquid hydrogen production that must move in cryogenic tanks maintained below -253 °C. Only a limited pool of carriers owns equipment meeting the United States Department of Transportation hazmat standards, creating a premium-rate niche. As long-term offtake agreements multiply, dedicated hydrogen lanes are emerging between Gulf-Coast producers and West-Coast refueling networks, supporting incremental demand for specialized drivers and pressure-vessel trailers.
Outsourcing of Private Retail Truck Fleets
Retailers are divesting rolling stock in favor of five-year dedicated carriage contracts that guarantee service levels and free up capital for merchandising. Walmart and Target transitioned dozens of captive routes to large contract carriers in 2025, citing cost reduction and technology access benefits. Carriers gain stable revenue visibility, while shippers retain control through prescribed key-performance targets and branded equipment.
Regulatory Approval of Truck-Platooning
FMCSA guidance now permits two-truck platoons across interstate highways, provided vehicles maintain constant vehicle-to-vehicle connectivity and driver supervision. Early pilots on I-10 delivered 5-10% fuel savings, translating to a 200-basis-point operating-ratio lift for large fleets able to absorb the up-front telematics expense. Insurance frameworks are gradually recognizing platoon safety datasets, which lowers risk-adjusted premiums for adopters.
Restraints Impact Analysis*
| Restraint | (~) % Impact on CAGR Forecast | Geographic Relevance | Impact Timeline |
|---|---|---|---|
| Escalating insurance “nuclear verdicts” costs | −1.0% | United States, especially high-litigation states | Short term (≤ 2 years) |
| Heavy-truck OEM delivery delays | −0.7% | Region-wide | Short term (≤ 2 years) |
| Rising cyber-risk to telematics networks | −0.4% | Large fleets with sophisticated connectivity | Medium term (2-4 years) |
| Urban congestion-pricing truck access limits | −0.3% | New York, expanding to other metros | Medium term (2-4 years) |
| Source: Mordor Intelligence | |||
Escalating Insurance “Nuclear Verdicts” Costs
Median jury awards in fatal trucking cases climbed to USD 27 million by 2025, a five-fold rise over the prior decade, forcing annual liability-premium hikes near 30% for many fleets. Owner-operators and small regional carriers are exiting the market or downsizing, which tightens market capacity but also drives consolidation toward capital-rich operators able to self-insure sizable deductibles.
Heavy-Truck OEM Delivery Delays From Chip Shortages
Chip scarcity extended Class 8 tractor lead times to up to 18 months, stalling fleet-upgrade cycles and inflating used-truck prices by 22% between mid-2024 and mid-2025. Deferred equipment replacement keeps average tractor age elevated, limiting fuel-efficiency gains and delaying fleet-wide safety-tech rollouts[2]New York City Department of Transportation, “Congestion Pricing,” nyc.gov .
*Our forecasts treat driver/restraint impacts as directional, not additive. The impact forecasts reflect baseline growth, mix effects, and variable interactions.
Segment Analysis
By End-User Industry: Manufacturing Anchors Freight Demand
Manufacturing held a 34.81% share of the North America road freight transport market size in 2025, while wholesale and retail trade is projected to grow at a 5.85% CAGR, reflecting resilient demand across key end-use sectors. Manufacturing activity sustains high volumes of raw material inflows, WIP transfers, and finished-goods distribution, supporting long-haul density across the Midwest-Southwest corridor. Meanwhile, omnichannel retail models are accelerating smaller, more frequent shipments into regional fulfillment networks.
Construction freight benefits from federal infrastructure investment, though oil and gas volumes remain exposed to energy price volatility. Seasonal surges in agriculture during autumn tighten capacity, while stricter EPA emissions standards are prompting shippers to prioritize carriers with modern, lower-emission fleets, strengthening the position of operators that invest in fleet upgrades.


By Destination: Cross-Border Freight Gains Momentum
Domestic hauls accounted for 62.37% of the North America road freight transport market size in 2025, while cross-border freight is projected to grow at a 5.03% CAGR, supported by streamlined trade under the USMCA framework. Simplified customs processes and improved border technology are reducing dwell times and increasing shipment visibility, making international lanes more attractive to electronics and automotive shippers seeking reliable transit.
As Mexican and Canadian suppliers further integrate with United States distribution networks, international road freight demand is set to accelerate. Carriers equipped with bilingual driver pools, bonded warehousing capabilities, and surety bond coverage are positioned to capture an outsized share of this cross-border growth.
By Truckload Specification: LTL Captures Fragmented Demand
Full-truck-load (FTL) operations represented 78% of the North America road freight transport market size in 2025, while less-than-truckload (LTL) services are projected to expand at a 6.18% CAGR, driven by inventory-light retail models requiring frequent, palletized replenishment. FTL continues to benefit from strong asset-turn efficiency, particularly for high-volume industrial movements.
At the same time, regional LTL network densification is shortening line-haul distances and supporting faster delivery commitments. Although LTL is scaling more rapidly, FTL’s share is expected to decline only gradually as shippers continue to rely on dedicated capacity for fragile, high-value, and hazardous freight.
By Containerization: Intermodal Integration Accelerates
Non-containerized cargo accounted for 83.93% of the North America road freight transport market size in 2025, while containerized truck movements are projected to grow at a 6.71% CAGR through 2031. Growth in intermodal rail–truck partnerships is expanding capacity on long-haul lanes, helping shippers lower transport costs while maintaining competitive transit times. Standardized 53-foot domestic containers further enhance drop-and-hook efficiency across high-density corridors.
Despite this momentum, bulk commodities, project cargo, and over-dimensional shipments will continue to anchor demand for specialized flatbed and tank trailers, ensuring non-containerized freight retains a strong presence in the market[3].U.S. Department of Transportation, “Hazmat Safety,” transportation.gov
By Distance: Long Haul Sustains Core Demand
Long-haul routes represented 74.75% of the North America road freight transport market size in 2025 and are projected to grow at a 4.40% CAGR, maintaining dominance despite ongoing intermodal substitution. Persistent driver shortages are accelerating automation pilots on major freight corridors, particularly for multiday routes, as carriers explore autonomous solutions to stabilize long-distance capacity.
Short-haul volumes are expanding alongside e-commerce fulfillment cycles, yet revenue density continues to favour coast-to-coast and cross-border corridors, especially for hazardous materials and temperature-controlled shipments where dedicated long-haul capacity remains essential.
By Goods Configuration: Fluid Goods Require Specialized Assets
Solid goods accounted for 71.55% of the North America road freight transport market size in 2025, while fluid goods are growing at a 4.98% CAGR, driven by higher volumes of refined fuels, industrial chemicals, and edible oils. Tank-truck operators navigate DOT hazmat audits and mandatory wash-outs, raising per-mile costs but allowing for premium pricing.
Pipeline constraints in regions like the Upper Midwest and Atlantic provinces highlight the critical role of tank trailers in maintaining resilient supply chains, ensuring reliable delivery of liquid commodities despite infrastructure bottlenecks.
By Temperature Control: Cold Chain Expansion Leads Growth
Temperature-controlled freight is expanding at a 7.72% CAGR, nearly triple the growth of dry-van volumes, fueled by biologics and online grocery demand. Investments such as Schneider’s acquisition of 1,200 pharma-grade reefers underscore confidence in premium-rate lanes requiring GDP-certified handling.
While non-temperature-controlled freight still dominates the North America road freight transport market size with 94.2% share, its slower growth is gradually shifting pricing power toward specialized carriers capable of maintaining strict 2-8 °C compliance[4]Federal Highway Administration, “Bipartisan Infrastructure Law,” fhwa.dot.gov .
Geography Analysis
The United States held 67.95% of regional value in 2025, but its share is inching lower as Mexico posts the region’s fastest growth. United States freight remains diversified: the Midwest hubs automotive plants and grain elevators, the Southeast accommodates near-shoring consumer goods, and the Southwest channels cross-border activity. Bipartisan Infrastructure Law allocations of USD 110 billion for highways will relieve key choke points over the next five years.
Mexico’s 5.18% CAGR stems from automotive and electronics plants migrating from Asia to Nuevo Leon and Coahuila, delivering balanced trade lanes with northbound finished goods and southbound components. Improved security escorts on Mexican highways and bonded warehousing at new gateway terminals are mitigating historic risk premiums. Hydrogen investments in Texas funnel specialized hazmat loads across the Río Grande, deepening bilateral trade synergies.
Canada enjoys steady resource-driven freight, shipping lumber, potash, and crude by truck from remote extraction zones to coastal terminals. Extreme winter conditions necessitate robust tractor specs and chain-up protocols, shielding incumbents from new competition. Cross-border harmonization of electronic logging remains on the policy docket, potentially widening driver pools and lowering deadhead kilometers for fleets with binational terminals.
Competitive Landscape
The North America road freight transport market features low concentration the five largest carriers accounting for an estimated 13.3% of billable revenue. M&A activity such as Old Dominion’s Northeastern LTL pickup and Knight-Swift’s flatbed buy shows that scale and network density confer pricing resilience.
Technology is an equalizer; C.H. Robinson’s USD 450 million AI engine slashes empty miles by double digits, narrowing the cost gap with larger asset-heavy fleets. Hydrogen-fuel partnerships (J.B. Hunt/Plug Power) and autonomous alliances (Werner/Aurora) signal strategic bets on next-gen propulsion and driver augmentation.
ESG-linked loans lower capital costs for early adopters of renewable diesel, electric vans, and fuel-cell tractors, reinforcing the correlation between sustainability performance and bid-board success. Cyber-hardening investments are now table stakes, with insurers requiring documented penetration tests before renewing multi-line policies.
North America Road Freight Transport Industry Leaders
C.H. Robinson
FedEx
J.B. Hunt Transport, Inc.
Knight-Swift Transportation Holdings Inc.
Old Dominion Freight Line
- *Disclaimer: Major Players sorted in no particular order

Recent Industry Developments
- February 2026: C.H. Robinson invested USD 450 million in AI freight-matching technology, cutting empty miles by 12-15%.
- December 2025: J.B. Hunt and Plug Power agreed to deploy 50 hydrogen fuel-cell tractors along California corridors by 2027.
- August 2025: Knight-Swift opened 11 new LTL terminals across the United States, supporting nationwide expansion under the AAA Cooper Transportation brand.
- April 2025: Knight-Swift Transportation Holdings Inc. expanded its United States less-than-truckload (LTL) network in North America through its subsidiary AAA Cooper Transportation by acquiring 29 former terminals of Yellow Corporation and opening 11 new terminals to accelerate the development of a nationwide LTL carrier


North America Road Freight Transport Market Report Scope
End User Industry
| Agriculture, Fishing, and Forestry |
| Construction |
| Manufacturing |
| Oil and Gas, Mining and Quarrying |
| Wholesale and Retail Trade |
| Others |
Destination
| Domestic |
| International |
Truckload Specification
| Full-Truck-Load (FTL) |
| Less than-Truck-Load (LTL) |
Containerization
| Containerized |
| Non-Containerized |
Distance
| Long Haul |
| Short Haul |
Goods Configuration
| Fluid Goods |
| Solid Goods |
Temperature Control
| Non-Temperature Controlled |
| Temperature Controlled |
Country
| United States |
| Canada |
| Mexico |
| End User Industry | Agriculture, Fishing, and Forestry |
| Construction | |
| Manufacturing | |
| Oil and Gas, Mining and Quarrying | |
| Wholesale and Retail Trade | |
| Others | |
| Destination | Domestic |
| International | |
| Truckload Specification | Full-Truck-Load (FTL) |
| Less than-Truck-Load (LTL) | |
| Containerization | Containerized |
| Non-Containerized | |
| Distance | Long Haul |
| Short Haul | |
| Goods Configuration | Fluid Goods |
| Solid Goods | |
| Temperature Control | Non-Temperature Controlled |
| Temperature Controlled | |
| Country | United States |
| Canada | |
| Mexico |


Market Definition
- Agriculture, Fishing, and Forestry (AFF) - This end user industry segment captures the external (outsourced) logistics expenditure incurred by the AFF industry players on road freight transport service. The end user players considered are the establishments primarily engaged in growing crops, raising animals, harvesting timber, harvesting fish & other animals from their natural habitats and providing related support activities. Herein, across the value chain, Logistics Service Providers (LSPs) play a crucial role in acquisition, storage, handling, transportation, and distribution activities for the optimal & continuous flow of inputs (seeds, pesticides, fertilizers, equipment, and water) from manufacturers or suppliers to the producers and smooth flow of output (produce, agro-goods) to distributors/ consumers. This includes both termperature controlled and non-temperature controlled logistics, as and when required according to the shelf life of goods being transported or stored.
- Construction - This end user industry segment captures the external (outsourced) logistics expenditure incurred by the construction industry players, on road freight transport service. The end user players considered are the establishments primarily engaged in constructing, repairing and renovating residential & commercial buildings, infrastructure, engineering works, subdividing and developing land. Logistics Service Providers (LSPs) play a crucial role in increasing profitability of construction projects by maintaing the inventory of raw materials & equipment, time-critical supplies and by providing other value added services for effective project management.
- Containerized Road Freight Transport - The segment captures the external (outsourced) logistics expenditure incurred by the road freight transport service end users on Full-Truck-Load (FTL) services. FTL road freight transport is characterized as a full single load not combined with other shipments. It comprises of shipments (i) devoted to the goods of a single shipper (ii) taken directly from a point of origin to one or more destination points (iii) comprising of bulk mail truck transportation (iv) comprising of both Container (Full Container Load, FCL)/Non-Container trucking services (v)comprsing of goods requiring temperature controlled or non-temperature controlled transportation services (vi) comprising of bulk liquid tankering (vii) invoving trucking of waste (viii) hazardous material trucking. Related value added services (VAS) of sorting, consolidation, deconslidation are included in the other services segment of freight and logistics market.
- Export Trends and Import Trends - Overall logistics performance of an economy is positively and significantly (statistically) correlated to its trade performance (exports and imports). Hence, in this industry trend, total value of trade, major commodities/ commodity groups and the major trade partners, for the studied geography (country or region as per the scope of report) have been analysed alongside the impact of major trade/logistics infrastructure investments & regulatory environment.
- Fluid Goods - The segment captures the external (outsourced) logistics expenditure incurred by the road freight transport service end users for the transport of bulk liquids, that are often used in extraction, manufacturing, food processing, agriculture industries among others. It includes transportation of liquids like (i) Chemicals/ hazardous goods (for instance acids) (ii) Water (potable as well as waste) (iii) Oil and gas (upstream as well as downstream like gasoline, fuel, crude oil, or propane), (iv) Food grade bulk liquids (like milk, or juice), (v) Rubber, (vi) Agrichemical products, among others. These goods are generally transported through tanker trucking.
- Fuel Price - Fuel price spikes can cause delays and diruption for logistics service providers (LSPs), while drops in the same can result in higher short-term profitability and increased market rivalry to offer consumers with the best deals. Hence, the fuel price variations have been studied over the review period and presented along with the causes as well as market impacts.
- Full-Truck-Load (FTL) Road Freight Transport - The segment captures the external (outsourced) logistics expenditure incurred by the road freight transport service end users on Full-Truck-Load (FTL) services. FTL road freight transport is characterized as a full single load not combined with other shipments. It comprises of shipments (i) devoted to the goods of a single shipper (ii) taken directly from a point of origin to one or more destination points (iii) comprising of bulk mail truck transportation (iv) comprising of both Container (Full Container Load, FCL)/Non-Container trucking services (v)comprsing of goods requiring temperature controlled or non-temperature controlled transportation services (vi) comprising of bulk liquid tankering (vii) invoving trucking of waste (viii) hazardous material trucking. Related value added services (VAS) of sorting, consolidation, deconslidation are included in the other services segment of freight and logistics market.
- GDP Distribution by Economic Activity - Nominal Gross Domestic Product and distribution of the same, across major economic sectors in the geography studied (country or region as per scope of the report) have been studied and presented in this industry trend. As GDP is positively related to the profitability and growth of logistics industry, this data has been used in adjunction to the input-output tables/ supply-use tables for analyzing the potential major contributing sectors towards the logistics demand.
- GDP Growth by Economic Activity - Growth of Nominal Gross Domestic Product across major economic sectors, for the geography studied (country or region as per scope of the report) have been presented in this industry trend. This data has been utilized for assessing the growth of logistics demand from all the market end users (economic sectors considered here).
- Inflation - Variations in both Wholesale Price Inflation (YoY change in producer price index) and Consumer Price Inflation have been presented in this industry trend. This data has been used to assess the inflationary environment as it plays a vital role in smooth functioning of the supply chain, directly impacting the logistics operational cost components e.g., pricing of tyres, driver wages & benefits, energy/fuel prices, maintenace costs, toll charges, warehousing rents, custom brokerage, forwarding rates, courier rates etc. hence impacting the overall freight and logistics market.
- Key Industry Trends - The report section named "Key Industry Trends" include all the key variables/parameters studied to better analyze the market size estimates and forecasts. All the trends have been presented in the form of data points (time series or latest available data points) along with analysis of the paramter in the form of concise market relevant commentary, for the geography studied (country or region as per the scope of report).
- Key Strategic Moves - The action taken by a company to differentiate from its competitor or used as a general strategy is referred to as a key strategic move (KSM). This includes (1) Agreements (2) Expansions (3) Financial Restructuring (4) Mergers and Acquisitions (5) Partnerships, and (6) Product Innovations. Key players (Logistics Service Providers, LSPs) in the market have been shortlisted, their KSM have been studied and presented in this section.
- Less than-Truck-Load (LTL) Road Freight Transport - The segment captures the external (outsourced) logistics expenditure incurred by the road freight transport service end users on Less than-Truck-Load (LTL) services. LTL road freight transport is characterized as multiple shipments combined onto a single truck for multiple deliveries within a network. It comprises of establishments (i) primarily engaged in general and specialized freight trucking of less than complete truck-loads, (ii) characterized by the use of terminals to consolidate shipments, generally from several shippers, into a single truck for haulage between a load assembly terminal and a disassembly terminal, where the load is sorted and shipments are re-routed for delivery (iv) Less than-Container-Load (LCL) shipping/ Groupage Shipping in case of trucking services. The activities in scope include (i) local pick-up, (ii) line-haul, and (iii) local delivery. Related value added services (VAS) of sorting, consolidation, deconslidation are included in the other services segment of freight and logistics market.
- Logistics Performance - Logistics Performance and Logistics Costs are the backbone of trade, and influences trade costs, making countries compete globally. Logistics performance is influenced by market wide adopted supply chain management strategies, government services, investments & policies, fuel/ energy costs, inflationary environment etc. Hence, in this industry trend, the logistics performance of the geography studied (country/ region as per the scope of report) has been analysed and presented over the review period.
- Major Truck Suppliers - Market share of truck brands is influenced by factors like geographical preferences, portfolio of truck types, truck prices, local production, truck repair & maintenance service peneteration, customer support, technological innovations (like electric vehicles, digitalization, autonomous trucks), fuel efficiency, financing options, annual maintenance costs, availability of substitutes, marketing startegies etc. Hence, the distribution (share % for base year of the study) of truck sales volume for leading truck brands and commentary on current market scenario & market anticipation over the forecast period have been presented in this industry trend.
- Manufacturing - This end user industry segment captures the external (outsourced) logistics expenditure incurred by the Manufacturing industry players, on road freight transport service. The end user players considered are the establishments primarily engaged in the chemical, mechanical or physical transformation of materials or substances into new products. Logistics Service Providers (LSPs) play a crucial role in maintaining a smooth flow of raw materials across the supply chain, enabling timely delivery of finished goods to distributors or end customers and storing & supplying the raw materials to clients for just-in-time manufacturing.
- Modal Share - Freight Modal Share is influenced by factors like modal productivity, government regulations, containerization, distance of shipment, temperature control requirements, type of goods, international trade, terrain, speed of delivery, shipment weight, bulk shipments, etc. Also, modal share by tonnage (tons) and modal share by freight turnover (ton-km) differ as per average distance of shipments, weight of major commodity groups transported in the economy and number of trips. This industry trend represents the distribution of freight transported by mode of transport (tons as well as ton-km), for the study base year.
- Oil and Gas, Mining and Quarrying - This end user industry segment captures the external (outsourced) logistics expenditure incurred by the extraction industry players, on road freight transport service. The end user players considered are the establishments that extract naturally occurring mineral solids, such as coal and ores; liquid minerals, such as crude petroleum; and gases, such as natural gas. Logistics Service Providers (LSPs) covers entire phases from upstream to downstream and plays a crucial role in the transportation of machinery, drilling equipments, extracted minerals, crude oil & natural gas and refined/ processed products from one place to another.
- Other End Users - Other end user segment captures the external (outsourced) logistics expenditure incurred by the financial services (BFSI), real estate, educational services, healthcare, and professional services (administrative, waste management, legal, architectural, engineering, design, consulting, scientific R&D), on road freight transport service. Logistics Service Providers (LSPs) plays a crucial role in the reliable movement of supplies and documents to/from these industries such as transporting any equipment or resources required, shipping confidential documents and files, movement of medical goods & supplies (surgical supplies and instruments, including gloves, masks, syringes, equipment) to name a few.
- Producer Price Inflation - It indicates inflation from viewpoint of the producers viz. the average selling price received for their output over a period of time. Annual change (YoY) of producer price index is reported as wholesale price inflation in the "Inflation" industry trend. As WPI captures dynamic price movements in most comprehensive way, it is widely used by governments, banks, industry, business circles and is deemed important in formulation of trade, fiscal and other economic policies. The data has been used in adjunction to consumer price inflation for better understanding the inflationary environment.
- Road Freight Pricing Trends - Freight pricing by mode of transport (USD/tonkm), over the review period, has been presented in this industry trend. The data has been used in assessing the inflationary environment, impact on trade, freight turnover (tonkm), road freight transport market demand and hence the road freight transport market size.
- Road Freight Tonnage Trends - Freight tonnage (weight of goods in tons) handled by mode of transport, over the review period, has been presented in this industry trend. The data has been used as one of the parameters apart from average distance per shipment (km), freight volume (tonkm), and freight pricing (USD/tonkm) to assess the freight transport market size.
- Road Freight Transport - Hiring a road freight transport logistics service provider (LSP) or haulier (outsourced logistics), for the transport of commodities constitutes road freight transport market. The scope of study includes (i) road transport of goods reported by hauliers registered in the reporting countries (ii) transport of raw materials or manufactured goods (solids as well as fluids) (iii) transport using commerical motor vehicles (rigid trucks or tractor-trailers, (iv) Full-Truck-Load (FTL) or Less than-Truck-Load (LTL) transport (v) containerized or non-containerized transport (vi) temperature controlled or non-temperature controlled trasnport, (vii) short haul or long haul (Over-the-road, OTR) transport, (viii) used office or household goods transport (movers and packers), (ix) other specialized cargo transport (dangerous goods, oversized cargo) and (x) outsourced first mile/ middle mile/last mile delivery shipments undertaken by road freight transport players. The scope does not include (i) transport undertaken by hauliers registered in other countries (ii) last mile meal delivery market (iii) grocery delivery market (iv) transportation via road network undertaken/ reported by Courier, Express, and Parcel (CEP) players.
- Road Length - As infrastructure plays a vital role in an economy's logistics performance, variables like length of roads, distribution of road length by surface category (paved v/s unpaved), distribution of road length by road classification (expressways v/s highways v/s other roads), have been analysed and presented in this industry trend.
- Segmental Revenue - Segmental Revenue has been triangulated or computed and presented for all the major players in the market. It refers to the road freight transport market specific revenue earned by the company, over the base year of study, in the geography studied (country or region as per the scope of report). It is computed through the study and analysis of major parameters like financials, service portfolio, employee strength, fleet size, investments, number of countries present in, major economies of concern, etc. that have been reported by the company in its annual reports, webpage. For companies having scarce financial disclosures, paid databases like D&B Hoovers, Dow Jones Factiva have been resorted to and verified through industry/expert interactions.
- Short Haul Road Freight Transport - The segment captures the external (outsourced) logistics expenditure incurred by the road freight transport service end users on local trucking (less than 100 miles). It includes the road transport of goods (i) within a single administrative area and its hinterland, (ii) by smaller trucks and pickup trucks (iii) via containerized as well as dry bulk services (iv) intermodal from ports, container terminals or airports, and (v) outsourced first mile/ last mile delivery shipments undertaken by road freight transport players.
- Transport and Storage Sector GDP - Value and growth of Transport and Storage Sector GDP has a direct relation to the freight and logistics market size, and hence road freight transport market size. Therefore, this variable has been studied and presented over the review period, in value terms (USD) and as share % of total GDP, in this industry trend. The data has been supported by concise and relevant commentary around the investments, developments, and current market scenario.
- Trends in E-Commerce Industry - Enhanced internet connectivity and boom in smartphone penetration, coupled with increasing disposable incomes, has led to a phenomenal growth in the e-commerce market globally. Online shoppers require fast and efficient delivery of their orders leading to an increase in the demand for logistics services especially e-commerce fulfilment services. Hence, the Gross Merchandise Value (GMV), historial and projected growth, breakup of major commodity groups in e-commerce industry for the studied geography (country or region as per scope of the report) have been analysed and presented in this industry trend.
- Trends in Manufacturing Industry - Manufacturing industry involves the transformation of raw materials into finished products, while logistics industry ensures the efficient flow of raw materials to the factory, and the transport of manufactured products to the distributors & consumers. Demand-Supply of both industries are highly cross-linked and critical for a seamless supply chain. Hence, the Gross Value Added (GVA), breakup of GVA into major manufacturing sectors, and growth of manufacturing industry over the review period have been analysed and presented, in this industry trend.
- Trucking Fleet Size By Type - Market share of truck types is influenced by factors like geographical preferences, major end user industries, truck prices, local production, truck repair & maintenance service peneteration, customer support, technological disruptions (like electric vehicles, digitalization, autonomous trucks) etc. Hence, the distribution (share % for base year of study) of truck parc volume by type of truck, market disruptors, truck manufacturing investments, truck specifications, truck use & import regulations, and market anticipation over the forecast period have been presented in this industry trend.
- Trucking Operational Costs - The prime reasons for measuring/ benchmarking logistics performance of any trucking company are to reduce operational costs and increase profitability. On the other hand, measuring operational costs helps to identify whether and where to make operational changes to control expenses and identify areas for improved performance. Hence, in this industry trend, trucking operational costs and the variables involved viz. driver wages & benefits, fuel prices, repairs & maintenance costs, tyre costs etc. have been studied over the base year of study, and presented for the geography studied (country or region as per the scope of report).
- Wholesale and Retail Trade - This end user industry segment captures the external (outsourced) logistics expenditure incurred by the wholesalers and retailers, on road freight transport service. The end user players considered are the establishments primarily engaged in wholesaling or retailing merchandise, generally without transformation, and rendering services incidental to the sale of merchandise. Logistics Service Providers (LSPs) plays a crucial role in the reliable movement of supplies to and finished products from production houses to the distributors and finally to the end customer covering activites like material sourcing, transportation, order fulfillment, warehousing & storage, demand forecasting, inventory management etc.
| Keyword | Definition |
|---|---|
| Cabotage | Road transport by a motor vehicle registered in a country performed on the national territory of another country. |
| Cross Docking | Cross docking is a logistics procedure where products from a supplier or manufacturing plant are distributed directly to a customer or retail chain with marginal to no handling or storage time. Cross docking takes place in a distribution docking terminal; usually consisting of trucks and dock doors on two (inbound and outbound) sides with minimal storage space. The name ‘cross docking’ explains the process of receiving products through an inbound dock and then transferring them across the dock to the outbound transportation dock. |
| Cross Trade | International road transport between two different countries performed by a road motor vehicle registered in a third country. A third country is a country other than the country of loading/embarkation and than the country of unloading/disembarkation. |
| Dangerous Goods | The classes of dangerous goods carried by Road are those defined by the fifteenth revised edition of the UN Recommendations on the Transport of Dangerous Goods, United Nations, Geneva 2007. They include Class 1: Explosives; Class 2: Gases; Class 3: Flammable Liquids; Class 4: Flammable solids- substances liable to spontaneous combustion; substances which, on contact with water, emit flammable gases; Class 5: Oxidizing substances and organic peroxides; Class 6: Toxic and infectious substances; Class 7: Radioactive material and Class 8: Corrosive substances, Class 9: Miscellaneous dangerous substances and articles. |
| Direct Shipment | Direct shipment is a method of delivering goods from the supplier or the product owner to the customer directly. In most cases, the customer orders the goods from the product owner. This delivery scheme reduces transportation and storage costs, but requires additional planning and administration. |
| Drayage | A drayage is a form of trucking service that connects the different modes of shipping (intermodal), such as ocean freight or air freight. It’s a short-haul trip that transports goods from one place to another, usually before or after its long-haul shipping process. Drayage trucks move cargo to and from various destinations, such as container ships, storage lots, order fulfillment warehouses, and rail yards. Typically, drayage only transports goods in short distances and operates only in one metropolitan area. It also requires only one trucker in a single shift. But despite this, but it plays an important role in long-haul shipping because it gets the goods to the cargo and vice versa. It makes intermodal transport much more efficient and enables the seamless transfer of goods to the end customer. |
| Dry van | A dry van is a type of semi-trailer that's fully enclosed to protect shipments from outside elements. Designed to carry palletized, boxed or loose freight, dry vans aren't temperature-controlled (unlike refrigerated “reefer” units) and can't carry oversized shipments (unlike flatbed trailers). |
| Final Demand | Final demand includes all types of commodities (goods as well as services) consumed as final use and might include personal consumption, or consumption by government, by businesses as capital investment, and as exports. includes all types of commodities (goods as well as services) consumed as final use and might include personal consumption, or consumption by government, by businesses as capital investment, and as exports. |
| Flatbed Truck | A flatbed truck is a type of truck with rigid design. It has a back body that is flatly shaped for easy loading and unloading of goods. The flatbed truck is mostly used to transport heavy, oversized, wide and indelicate goods such as machinery, building supplies or equipment. Due to the truck open body, the goods transported with it must not be vulnerable to rain. By functionality, the flatbed truck is comparable to a flatbed trailer. |
| Inbound Logistics | Inbound logistics is the way materials and other goods are brought into a company. This process includes the steps to order, receive, store, transport and manage incoming supplies. Inbound logistics focuses on the supply part of the supply-demand equation. |
| Intermediate Demand | Intermediate demand includes goods, services, and maintenance and repair construction sold to businesses, excluding capital investment. |
| International Loaded | Place of loading of goods in reporting country (i.e., country in which the vehicle performing the transport is registered) and place of unloading in a different country. |
| International Unloaded | Place of unloading of goods in reporting country (i.e., country in which the vehicle performing the transport is registered) and place of loading in a different country. |
| OOG cargo | Out of Gauge (OOG) cargo is any cargo that can not be loaded into six-sided shipping containers simply because it is too large. The term is a very loose classification of all cargo with dimensions beyond the maximum 40HC container dimensions. That is a length beyond 12.05 meters – a width beyond 2.33 meters – or a height beyond 2.59 meters. |
| Pallets | Raised platform, intended to facilitate the lifting and stacking of goods. |
| Part load | A part load describes goods which only fills a truck partially. In essence, the quantity of the shipment is bigger than the Less Than Truckload (LTL) shipment. Also, the shipment cannot fully occupy a truck i.e. its capacity is much lower than a Full Truckload (FTL) shipment. |
| Paved Road | Road surfaced with crushed stone (macadam) with hydrocarbon binder or bituminized agents, with concrete or with cobblestone. |
| Reverse Logistics | Reverse logistics comprises of the sector of supply chains that process anything returning inwards through the supply chain or traveling ‘backward’ through the supply chain. |
| Road Freight Transport Service | Hiring a trucking agency for transport of commodities (raw materials or manufactured goods including both solids and liquids) form the origin to a destination within the country (domestic) or cross-border (international) constitutes road freight transport market. The service might be Full-Truck-Load or Less than-Truck-Load, containerized or non-containerized, temperature controlled or non temperature controlled, short haul or long haul. |
| Tautliner vehicle | Tautliner and curtainsider are used as generic names for curtain sided trucks/trailers. The curtains are permanently fixed to a runner at the top and detachable rails/poles at front and rear, allowing the curtains to be drawn open and forklifts used all along the sides for easy and efficient loading and unloading. When closed for travel, vertical load restraint straps are attached to a rope rail beneath the truck bed, connecting the truck bed and curtain along both sides. Winches at either end of the curtain tension it, hence the 'Tautliner' name. This stops the curtain from flapping or drumming in the wind and can also help retain light loads from slipping sideways. |
| Transport for hire or reward | The carriage for remuneration of goods. |
| Unpaved Road | Road with a stabilized base not surfaced with crushed stone, hydrocarbon binder or bituminized agents, concrete or cobblestone. |


Research Methodology
Mordor Intelligence follows a four-step methodology in all our reports.
- Step-1: Identify Key Variables: In order to build a robust forecasting methodology, the variables and factors identified in Step-1 are tested against available historical market numbers. Through an iterative process, the variables required for market forecast are set and the model is built on the basis of these variables.
- Step-2: Build a Market Model: Market-size estimations for the forecast years are in nominal terms. Inflation is considered to be a part of the pricing, and the average selling price (ASP) is varying throughout the forecast period for each country
- Step-3: Validate and Finalize: In this important step, all market numbers, variables and analyst calls are validated through an extensive network of primary research experts from the market studied. The respondents are selected across levels and functions to generate a holistic picture of the market studied.
- Step-4: Research Outputs: Syndicated Reports, Custom Consulting Assignments, Databases & Subscription Platforms


