US-Mexico Cross-Border Freight Transport Market Size and Share
Market Overview
| Study Period | 2020 - 2031 |
|---|---|
| Forecast Data Period | 2026 - 2031 |
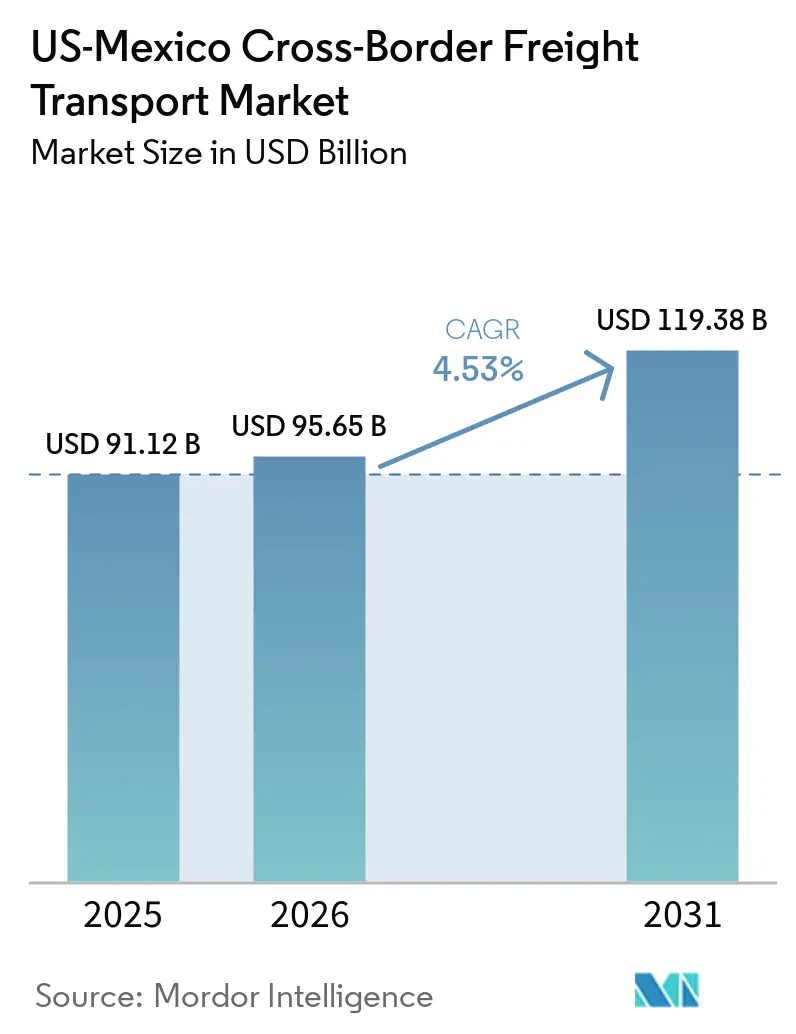
| Base Year Market Size (2025) | USD 91.12 Billion |
| Market Size (2026) | USD 95.65 Billion |
| Market Size (2031) | USD 119.38 Billion |
| Growth Rate (2026 - 2031) | 4.53% CAGR |
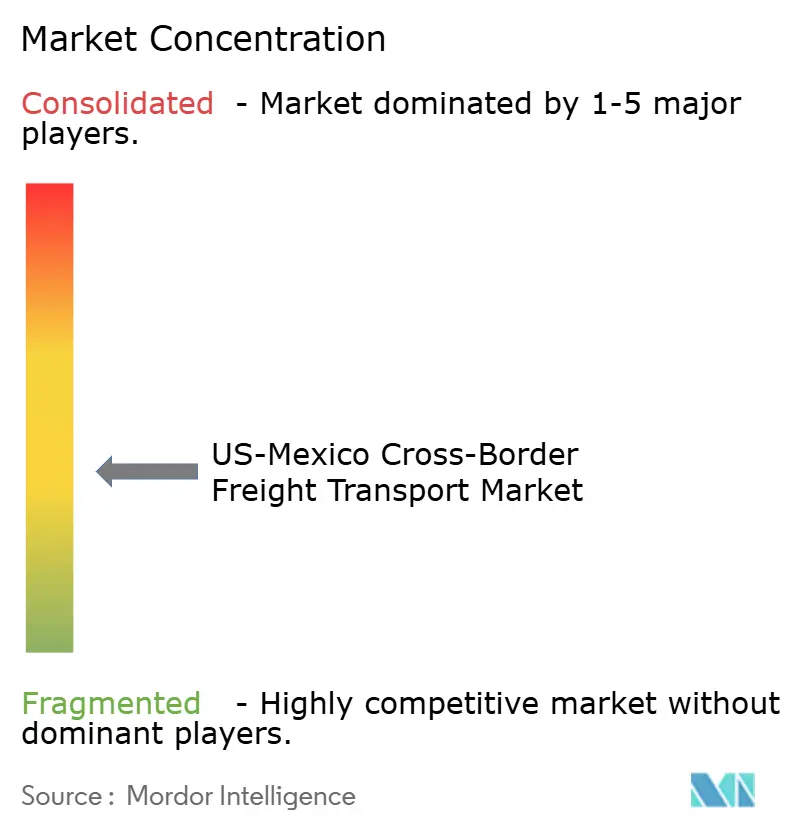
| Market Concentration | Medium |
Major Players *Disclaimer: Major Players sorted in no particular order Image © Mordor Intelligence. Reuse requires attribution under CC BY 4.0. | |
US-Mexico Cross-Border Freight Transport Market Analysis by Mordor Intelligence
The US-Mexico cross-border freight transport market size is projected to expand from USD 91.12 billion in 2025 and USD 95.65 billion in 2026 to USD 119.38 billion by 2031, registering a CAGR of 4.53% between 2026 and 2031.
Capacity additions, nearshoring investments, and e-commerce parcel density are broadening the service mix and boosting pricing power for carriers that can guarantee reliable door-to-door delivery. United States-Mexico-Canada Agreement (USMCA) rules that require 75% regional content for automotive goods anchor vertically integrated supply chains, while the Automated Commercial Environment (ACE) and Mexico’s Ventanilla Única de Comercio Exterior (VUCEM) shorten clearance times and expand digital visibility. Recent capital inflows of USD 1 billion from Flex for artificial-intelligence hardware, USD 600 million from Kia for electric-vehicle (EV) capacity, and USD 66 million from Yazaki for wire harnesses translate into higher full-truckload (FTL) volumes and incremental less-than-truckload (LTL) demand as just-in-time inventory models proliferate. However, infrastructure bottlenecks at Laredo and Otay Mesa, driver shortages, and policy volatility surrounding Section 232 tariffs temper growth and elevate operating costs.[1]Bureau of Transportation Statistics, “North America Transborder Freight Data,” bts.gov
Key Report Takeaways
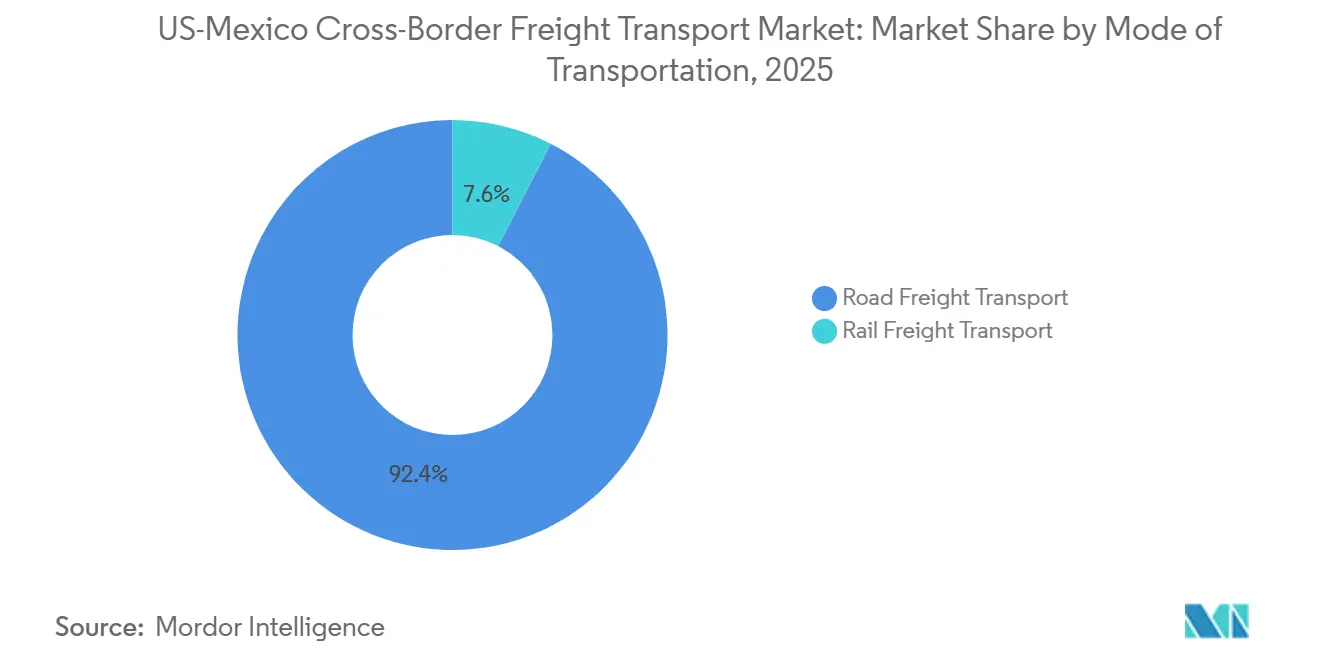
- By mode of transportation, road freight commanded 92.44% of the US-Mexico cross-border freight transport market share in 2025 and is forecast to expand at a 4.60% CAGR to 2031.
- By road freight transport, the FTL segment led with 79.74% of the US-Mexico cross-border freight transport market size in 2025, while the LTL segment is projected to post the fastest 5.04% CAGR through 2031.
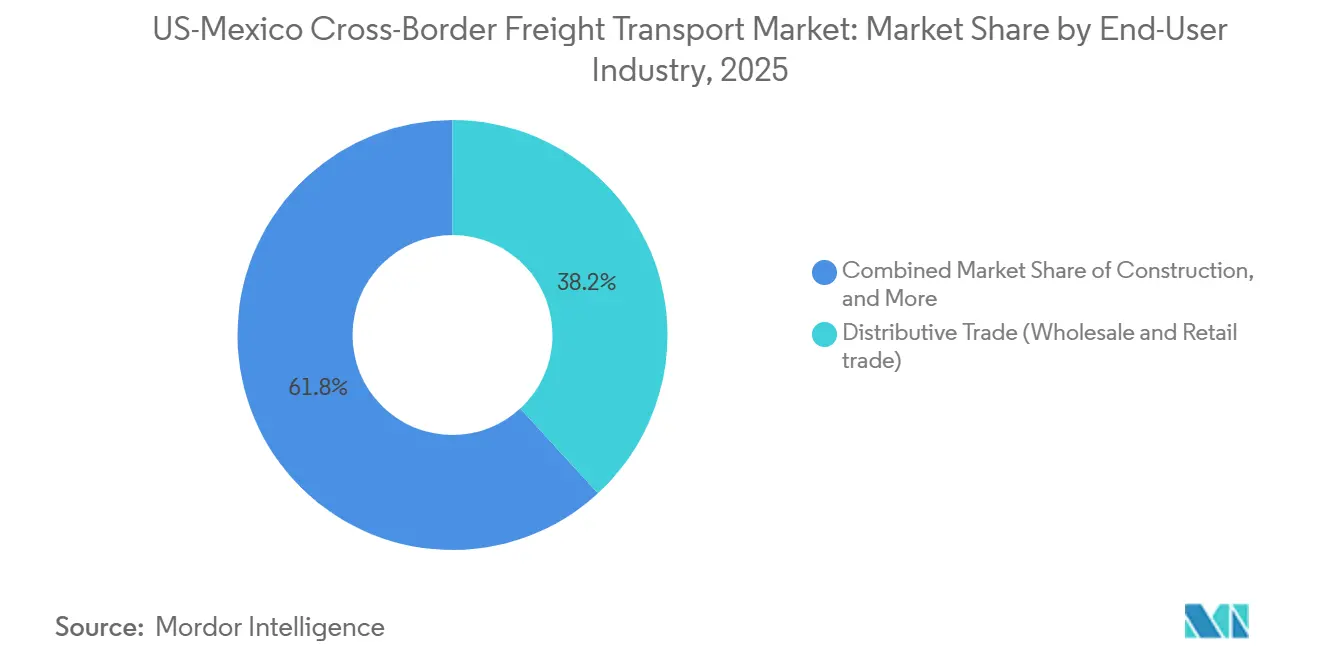
- By end-user industry, distributive trade accounted for 38.17% of the US-Mexico cross-border freight transport market share in 2025, whereas healthcare and pharmaceutical is advancing at a 6.25% CAGR to 2031.
- By cross-border lane, United States-to-Mexico traffic represented 54.96% of the US-Mexico cross-border freight transport market size in 2025, but Mexico-to-United States flows is growing more quickly at a 5.34% CAGR through 2031.
Note: Market size and forecast figures in this report are generated using Mordor Intelligence’s proprietary estimation framework, updated with the latest available data and insights as of January 2026.
US-Mexico Cross-Border Freight Transport Market Trends and Insights
Drivers Impact Analysis*
| Drivers | (~) Impact on CAGR Forecast | Geographic Relevance | Impact Timeline |
|---|---|---|---|
| Nearshoring of electronics and machinery supply chains | +1.2% | Texas border crossings, Nuevo León, Guanajuato, Querétaro | Medium term (2-4 years) |
| USMCA rules of origin and regional sourcing incentives | +1.0% | United States-Mexico automotive corridors | Long term (≥ 4 years) |
| High-frequency cross-border e-commerce shipments | +0.8% | California-Baja California and Texas-Tamaulipas | Short term (≤ 2 years) |
| Digital customs platforms accelerating clearances | +0.6% | Major ports of entry | Short term (≤ 2 years) |
| Rapid growth of bonded cross-dock hubs in the “Twin Triangles” corridor | +0.5% | Laredo-Monterrey-San Antonio, El Paso-Ciudad Juárez-Chihuahua | Medium term (2-4 years) |
| Laredo World Trade Bridge capacity expansion | +0.4% | Laredo-Nuevo Laredo corridor | Medium term (2-4 years) |
| Source: Mordor Intelligence | |||
Nearshoring of electronics and machinery supply chains
Original-equipment manufacturers are relocating final assembly from Asia to Mexico, compressing lead times from 30-45 days to as few as five days. Flex’s USD 1 billion investment aims to supply hyperscale cloud clients from hubs like Jalisco and Chihuahua, while Yazaki’s USD 66 million wire-harness expansion in Nuevo León feeds EV lines for Kia and General Motors. DHL Global Forwarding recorded a 76.2% spike in Mexico-origin electronics exports in October 2025, confirming the sectoral pivot. FTL carriers benefit from higher-value, time-sensitive loads, yet rising shipment frequency also accelerates LTL uptake. Vendor-managed inventory programs inside bonded warehouses cut working capital needs by up to 20%.
USMCA Rules of Origin and Regional Sourcing Incentives
A mandatory 75% regional-value content threshold and labor-value benchmarks of USD 16 per hour deepen supply-chain localization. The United States International Trade Commission notes that while the vast majority of Mexican automotive exports still clear duty-free, the stricter USMCA regulations have marginally reduced the qualification rate compared to the near-total compliance seen under the former NAFTA regime. Kia’s USD 600 million EV expansion in Nuevo León includes battery-module assembly to meet these stricter thresholds and avoid 2.5% most-favored-nation duties. Tighter verification could raise compliance costs, but the duty-savings dividend continues to outweigh marginal production premiums. Demand therefore gravitates toward cross-border carriers that offer integrated brokerage and documentation support.[2]U.S. International Trade Commission, “Economic Impact of the USMCA,” usitc.gov
High-Frequency Cross-Border E-Commerce Shipments
Bidirectional parcel flows are compounding at double-digit rates. Cainiao’s dedicated logistics network, which has been rapidly expanding since its early 2024 market entry, underpriced incumbents by roughly 40% on cross-border lanes, forcing FedEx and UPS to expand their Tijuana capacity. With the United States' historic suspension of its USD 800 de minimis exemption in late 2025, northbound consolidation strategies have radically shifted; forwarders now rely on bonded hubs to aggregate LTL freight and break bulk after formal customs entry, which can still cut total landed costs by up to 40%. Southbound, Mexico's strict USD 50 tax-free threshold continues to dictate bulk load routing. To manage rising last-mile density, DHL deployed an aggressive EUR 70 million (USD 81.3 million) expansion in 2025, adding over 1,000 new vehicles and 100 retail points to its national network.
Digital Customs Platforms Accelerating Clearances
The ACE–VUCEM data bridge has halved the average clearance time to 45 minutes at Laredo. A 2024 pilot integrating automated scanning and blockchain bills of lading cut secondary inspections from 18% to 11%. UPS reports that more than 90% of its shipments now clear digitally, unlocking same-day release and protecting produce and biologics that lose up to 3% of value per delayed hour. Nonetheless, many small exporters still rely on customs brokers that charge USD 150-300 per transaction, limiting digital dividends for SMEs. The next wave of efficiencies will hinge on broker-friendly application programming interface (API) toolkits.
Restraints Impact Analysis*
| Restraints | (~) Impact on CAGR Forecast | Geographic Relevance | Impact Timeline |
|---|---|---|---|
| Tariff volatility (Section 122/301) and policy uncertainty | –0.9% | Bilateral lanes, automotive and steel supply chains | Short term (≤ 2 years) |
| Infrastructure bottlenecks and congestion at key crossings | –0.7% | Laredo, Otay Mesa, El Paso, Nogales, Pharr | Short term (≤ 2 years) |
| Cross-border driver shortages & aging truck fleet | –0.5% | United States and Mexican fleets | Long term (≥ 4 years) |
| Security risks and cargo-theft corridors in Mexico | –0.4% | Jalisco, State of Mexico, Puebla, Guanajuato, Michoacán | Medium term (2-4 years) |
| Source: Mordor Intelligence | |||
Tariff Volatility (Section 122/301) and Policy Uncertainty
The February 2025 proposal for a blanket 25% tariff on Mexican imports, though paused, spurred shipment surges ahead of the possible start date and abrupt order halts afterward, leaving a lingering chill on the market. Section 232 duties on steel and aluminum persist, raising costs for Mexican producers while allowing finished assemblies to travel duty-free under USMCA, distorting sourcing decisions. Furthermore, ongoing friction over the USMCA’s automotive rules of origin following the contentious 2023 panel ruling continues to pose the persistent threat of tighter verification and retroactive penalties. Heavy-duty truck tariffs introduced by the US in October 2025 severely cut Mexican exports to the United States within weeks. Ultimately, the looming July 2026 USMCA joint review threatens further structural rule changes, heavily deterring long-horizon capital deployment.
Infrastructure Bottlenecks and Congestion at Key Crossings
Average peak wait times hover at 45 minutes in Laredo and exceed 55 minutes in Otay Mesa despite FAST lanes and dedicated inspection bays. The Bridge of the Americas will eliminate cargo operations during a USD 579 million rebuild, diverting traffic to already stretched Ysleta. Each idle hour costs carriers USD 35-50 in fuel and wages, pushing operators to build buffers that slash asset utilization by up to 12%. Road blockades across 17 Mexican states in late 2025 showed how civic disruptions can wipe out as much as USD 300 million in trade in a single week. Until additional lanes come online in 2028-2029, congestion remains a structural drag.
*Our forecasts treat driver/restraint impacts as directional, not additive. The impact forecasts reflect baseline growth, mix effects, and variable interactions.
Segment Analysis
By Mode of Transportation: Road Dominance Anchors Growth
Road freight accounted for 92.44% of the US-Mexico cross-border freight transport market size in 2025, underscoring its door-to-door flexibility and ability to serve inland manufacturing clusters beyond rail terminals.[3]Bureau of Transportation Statistics, “Transborder Freight Data Annual Report: 2025,” bts.gov While Canadian Pacific Kansas City’s (CPKC) new twin-track bridge successfully doubled rail capacity in late 2024, inbound northbound truck volumes at Laredo alone still average roughly 8,500 per day to capture incremental nearshoring flows. The US-Mexico cross-border freight transport market size tied to road services is projected to grow at a 4.60% CAGR through 2031 as bonded cross-dock hubs multiply and customs digitization compresses dwell time.
Intermodal partnerships such as J.B.Hunt–BNSF–GMXT’s 'Quantum de México' promise one-day faster transits, yet they remain niche relative to ubiquitous trucking. E-commerce parcels, temperature-controlled pharmaceuticals, and machinery spares favor truckload flexibility, sustaining the segment’s pricing power. Even with enhanced transcontinental rail capacity now fully online, customer preference for predictable pickup windows keeps road firmly ahead in the medium term.


By Road Freight Transport: LTL Outpaces FTL on E-Commerce Surge
FTL dominated road freight with a 79.74% US-Mexico cross-border freight transport market share in 2025, reflecting consolidated automotive and capital-goods loads. LTL, though smaller, is forecast to record the highest CAGR of 5.04% to 2031 as e-commerce package density rises and SMEs embrace consolidation programs.
C.H. Robinson’s September 2025 service, which aggregates LTL parcels, yields up to 40% in cost savings, highlighting value for shippers moving under the USD 50 Mexican de minimis ceiling. Ryder’s 228,000-square-foot Laredo hub dedicates sorting bays to LTL cross-docks, underscoring the modal shift. FTL still retains strategic relevance for automotive original-equipment manufacturers that dispatch complete trailer loads on tight schedules, but even these firms are trialing LTL for aftermarket parts to minimize stocking costs. Consequently, blended networks that can flex between FTL and LTL are well positioned to capture incremental margin.
By End-User Industry: Healthcare Outgrows Distributive Trade
Distributive trade accounted for 38.17% of demand in 2025, making it the largest contributor to the US-Mexico cross-border freight transport market size. Yet healthcare and pharmaceutical shipments are projected to advance at the fastest 6.25% CAGR through 2031, buoyed by biologics, vaccines, and active-pharmaceutical-ingredient nearshoring.
DHL’s Querétaro upgrade to 41,000 packages per hour with 2-8 °C cold-chain zones exemplifies the infrastructure build supporting this growth. CBP’s Pharr cold-storage pilot cut clearance times for perishables by 60 minutes, widening the feasible delivery radius for temperature-sensitive cargo. As regulatory scrutiny intensifies, carriers offering validated GDP-compliant (Good Distribution Practice) networks will claim premium yields. Distributive trade remains volume-heavy, but margin expansion is more likely within healthcare logistics.
By Cross-Border Lane: Northbound Gains on Southbound
United States-to-Mexico freight held 54.96% of directional volume in 2025, but Mexico-to-United States loads are forecast to grow at 5.34% CAGR, outpacing southbound cargo. Nearshored electronics, finished vehicles, and fresh produce drive the surge, leveraging USMCA duty-free access and Mexico’s labor-cost advantage.
The imbalance strains capacity, as southbound trucks often return empty. American Transportation Research Institute data show empty miles erode margins by up to 12%. Fleets like Ryder have expanded Nuevo Laredo drayage yards to lock in northbound spot freight, while 3PLs bundle smaller southbound consignments to improve backhaul economics. Should tariff uncertainty persist, shippers may front-load northbound orders, amplifying the lane’s volatility.
Geography Analysis
Mexico became the United States’ largest trading partner in 2025, with bilateral trade reaching USD 872.8 billion, surpassing Canada’s USD 719.4 billion. Truck freight alone totaled USD 77.3 billion that March, and the US-Mexico Cross-Border Freight Transport market continues to cluster around Texas gateways Laredo, El Paso, Brownsville, and Pharr that collectively process about 70% of all road cargo. California’s Otay Mesa manages the bulk of West Coast trade but endures 55-minute peak delays, prompting some shippers to reroute through Arizona’s Nogales crossing.
Manufacturing gravitas is migrating toward Nuevo León, Guanajuato, and Querétaro, where Flex, Kia, and Yazaki committed a combined USD 1.666 billion during 2024-2025. Monterrey’s proximity to Laredo underpins rapid cross-dock growth, while Ciudad Juárez links electronics production to El Paso yards under the IMMEX duty-deferral program. Security risks in Jalisco and Puebla complicate routing and inflate insurance premiums, but National Guard escorts have stabilized select lanes for high-value goods.
Policy surprises reverberate quickly across the corridor. The February 2025 tariff threat triggered shipment spikes, followed by order pauses that disrupted capacity planning. Bridge expansions at Brownsville and Laredo promise eventual relief, yet the near-term reality is that a single blockade or inspection surge can paralyze multimillion-dollar supply chains. Hence, carriers with diversified port-of-entry strategies retain a resilience premium.[4]Texas Department of Transportation, “Border Crossing Statistics,” txdot.gov
Competitive Landscape
The US-Mexico cross-border freight transport market is moderately concentrated, with asset-based truckers, asset-light 3PLs, and Class I railroads competing across overlapping service tiers. C.H. Robinson operates more than 2 million square feet of border warehousing after its November 2025 El Paso expansion, reinforcing its position as the largest 3PL gateway landlord. Grupo Traxión’s USD 213 million purchase of Solistica widened its end-to-end service breadth and added nearly 200,000 square meters of key industrial space, highlighting a consolidation trend among Mexican fleets seeking economies of scale.
Technology adoption separates leaders from followers. UPS claims 90% digital clearance via ACE-VUCEM integration, enabling day-of-arrival release that smaller carriers cannot easily replicate. DHL invested over USD 75 million in 2025 to expand depots, alongside USD 84 million in vehicle procurement, emphasizing temperature-controlled LTL for biologics, where regulatory compliance commands pricing premiums. J.B. Hunt, BNSF, and GMXT’s “Quantum de México” intermodal service targets automotive shippers who value 95% on-time performance at rates below those of expedited road haulage.
Disruption pressure mounts from Cainiao’s parcel network that undercuts incumbents by up to 60% and forces capacity expansions in Tijuana. Smaller niche truckers focus on flatbed and tanker services where specialized equipment and safety records shield margin. Regulatory complexity around USMCA verification and potential retroactive duties advantage incumbents with deep compliance teams, nudging the market toward higher concentration over time.
US-Mexico Cross-Border Freight Transport Industry Leaders
C.H. Robinson Worldwide, Inc.
Schneider National, Inc.
J.B. Hunt Transport Services, Inc.
UPS Supply Chain Solutions (UPS Inc.)
FedEx Logistics (FedEx Corp.)
- *Disclaimer: Major Players sorted in no particular order

Recent Industry Developments
- April 2026: Werner Enterprises deployed 800 containers to extend intermodal reach into Mexico, appealing to automotive and consumer-goods shippers.
- November 2025: C.H. Robinson added 450,000 square feet to its El Paso footprint, raising managed Mexico shipments to 1.5 million annually.
- September 2025: C.H. Robinson launched an LTL consolidation program that cuts border fees up to 40% for SMEs.
- July 2025: Grupo Traxion completed its USD 213 million Solistica acquisition, boosting fourth-quarter revenue 45.7% year over year.


US-Mexico Cross-Border Freight Transport Market Report Scope
| Road Freight Transport | Full Truckload (FTL) |
| Less-than-Truckload (LTL) | |
| Rail Freight Transport |
| Agriculture, Fishing, and Forestry |
| Construction |
| Distributive Trade (Wholesale and Retail trade) |
| Healthcare and Pharmaceutical |
| Manufacturing and Automotive |
| Oil and Gas, Mining and Quarrying |
| Other End-user Industries |
| United States to Mexico |
| Mexico to United States |
| By Mode of Transportation | Road Freight Transport | Full Truckload (FTL) |
| Less-than-Truckload (LTL) | ||
| Rail Freight Transport | ||
| By End-User Industry | Agriculture, Fishing, and Forestry | |
| Construction | ||
| Distributive Trade (Wholesale and Retail trade) | ||
| Healthcare and Pharmaceutical | ||
| Manufacturing and Automotive | ||
| Oil and Gas, Mining and Quarrying | ||
| Other End-user Industries | ||
| By Cross-Border Lane | United States to Mexico | |
| Mexico to United States |


Key Questions Answered in the Report
How large is the US-Mexico cross-border freight transport market in 2026?
The market is estimated at USD 95.65 billion in 2026, with a 4.53% CAGR projected through 2031.
Which mode moves the most freight across the border?
Road trucking dominates, holding 92.44% market share in 2025 thanks to flexible door-to-door service.
Which road freight segment will grow the fastest to 2031?
Less-than-truckload services should post a 5.04% CAGR as e-commerce and SME shipments multiply.
Why is healthcare logistics gaining importance?
Cold-chain investments and nearshored biologics production push healthcare freight to a 6.25% CAGR, the fastest among end-user groups.
How are carriers addressing border congestion?
Firms diversify ports of entry, use night crossings, invest in bonded cross-docks and embrace digital customs to trim wait times.
What risks could derail growth?
Tariff shocks, security incidents and driver shortages each shave up to 0.9 percentage points off forecast CAGR if unresolved.
Page last updated on:


