Market Overview
| Study Period | 2018 - 2031 |
|---|---|
| Forecast Data Period | 2026 - 2031 |
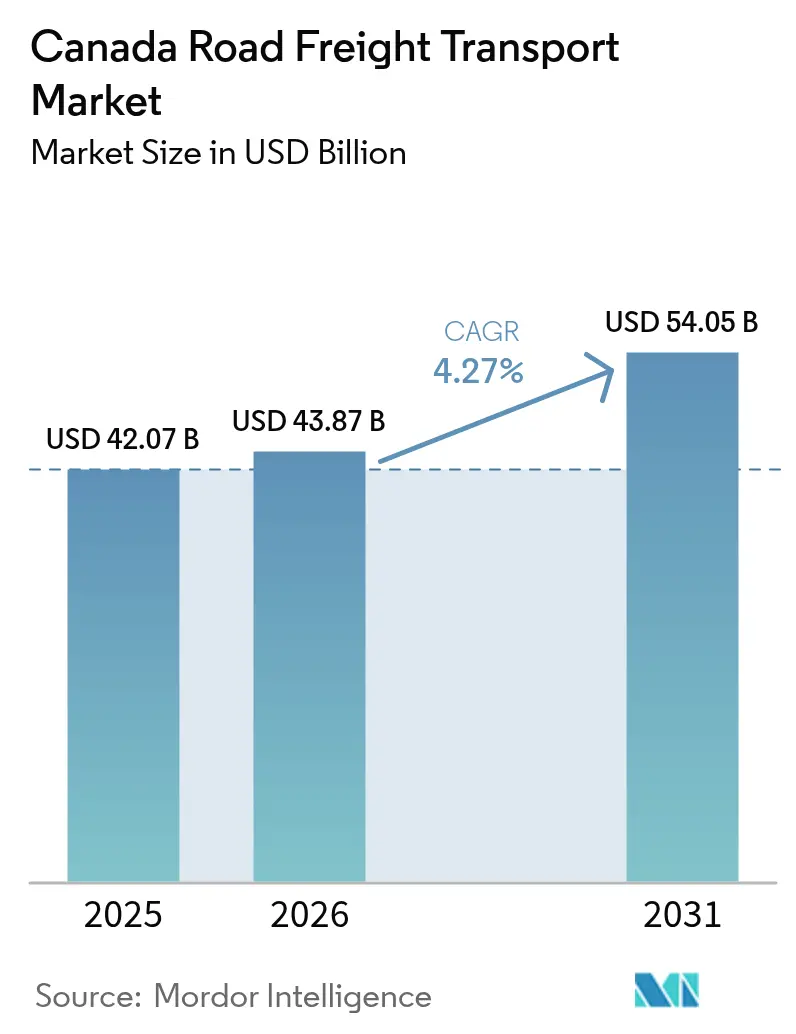
| Base Year Market Size (2025) | USD 42.07 Billion |
| Market Size (2026) | USD 43.87 Billion |
| Market Size (2031) | USD 54.05 Billion |
| Growth Rate (2026 - 2031) | 4.27% CAGR |
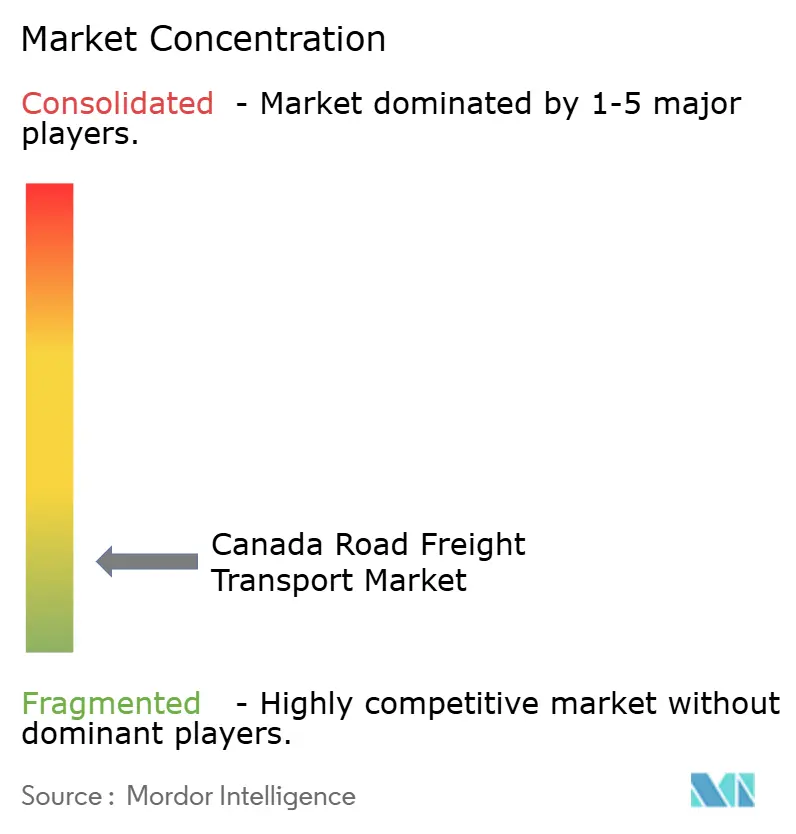
| Market Concentration | Low |
Major Players *Disclaimer: Major Players sorted in no particular order Image © Mordor Intelligence. Reuse requires attribution under CC BY 4.0. | |
Canada Road Freight Transport Market Analysis by Mordor Intelligence
The Canada road freight transport market size is expected to grow from USD 42.07 billion in 2025 to USD 43.87 billion in 2026 and is forecast to reach USD 54.05 billion by 2031 at 4.27% CAGR over 2026-2031. Robust trade activity, infrastructure upgrades, and rising e-commerce volumes underpin this growth trajectory, while fuel price volatility and demographic labor headwinds temper the overall outlook. Wholesale and retail trade generates the largest freight volumes, but international corridors now record the quickest tonnage gains as cross-border infrastructure projects—including the Gordie Howe International Bridge—come online. Consolidation among top carriers accelerates as large fleets leverage scale to finance zero-emission trucks and advanced telematics, yet the competitive field stays crowded in full-truck-load (FTL) lanes where entry barriers remain low. Technology adoption continues to boost asset utilization, with direct shipper-carrier digital platforms cutting empty miles by nearly one-tenth nationwide. Overall, the Canada road freight transport market increasingly pivots around speed-to-customer, sustainability mandates, and corridor-specific capacity advantages.
Key Report Takeaways
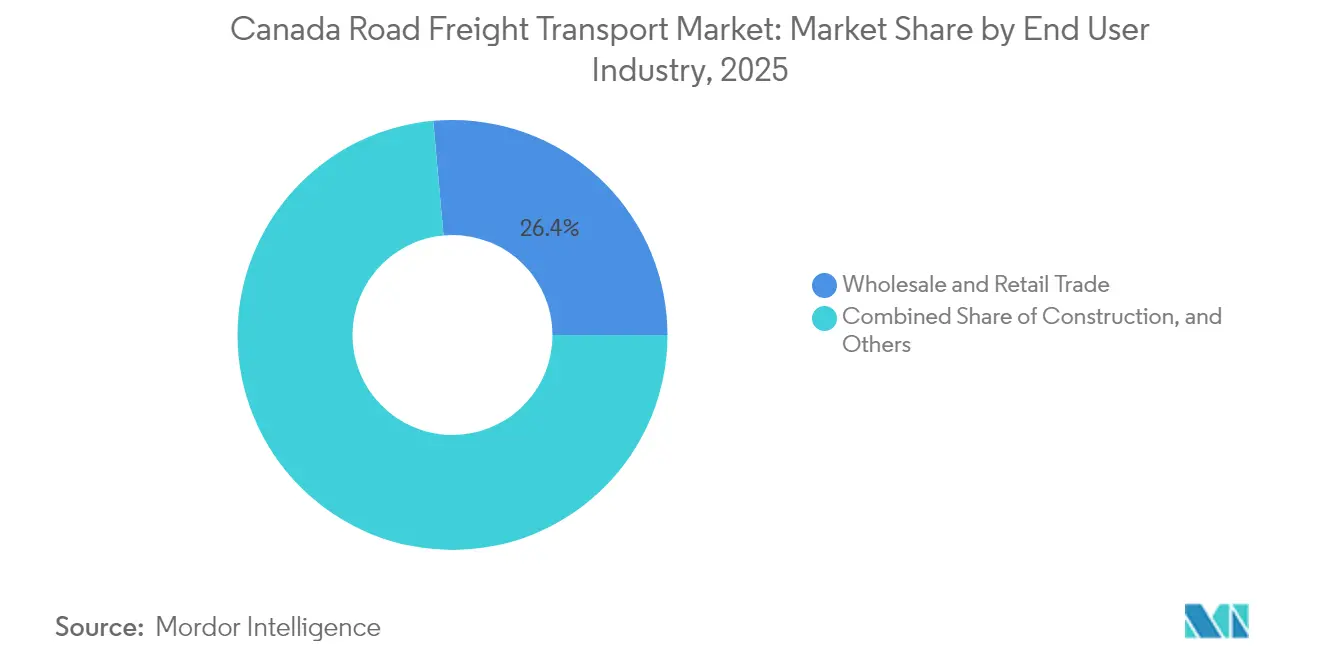
- By end user industry, wholesale and retail trade held the largest 26.43% of the Canada road freight transport market share in 2025, while also posting the fastest 4.78% CAGR between 2026-2031.
- By destination, domestic freight dominated at a 64.02% of the Canada road freight transport market size in 2025, whereas international lanes are forecast to advance at a 4.92% CAGR between 2026-2031.
- By truckload specification, full-truck-load commanded 79.78% of the 2025 value pool, yet less-than-truck-load is projected to climb at a 4.71% CAGR between 2026-2031 on the back of e-commerce fragmentation.
- By containerization, non-containerized cargo represented 86.02% of 2025 revenues, but containerized traffic is set to expand at a 4.33% CAGR between 2026-2031 alongside port capacity additions.
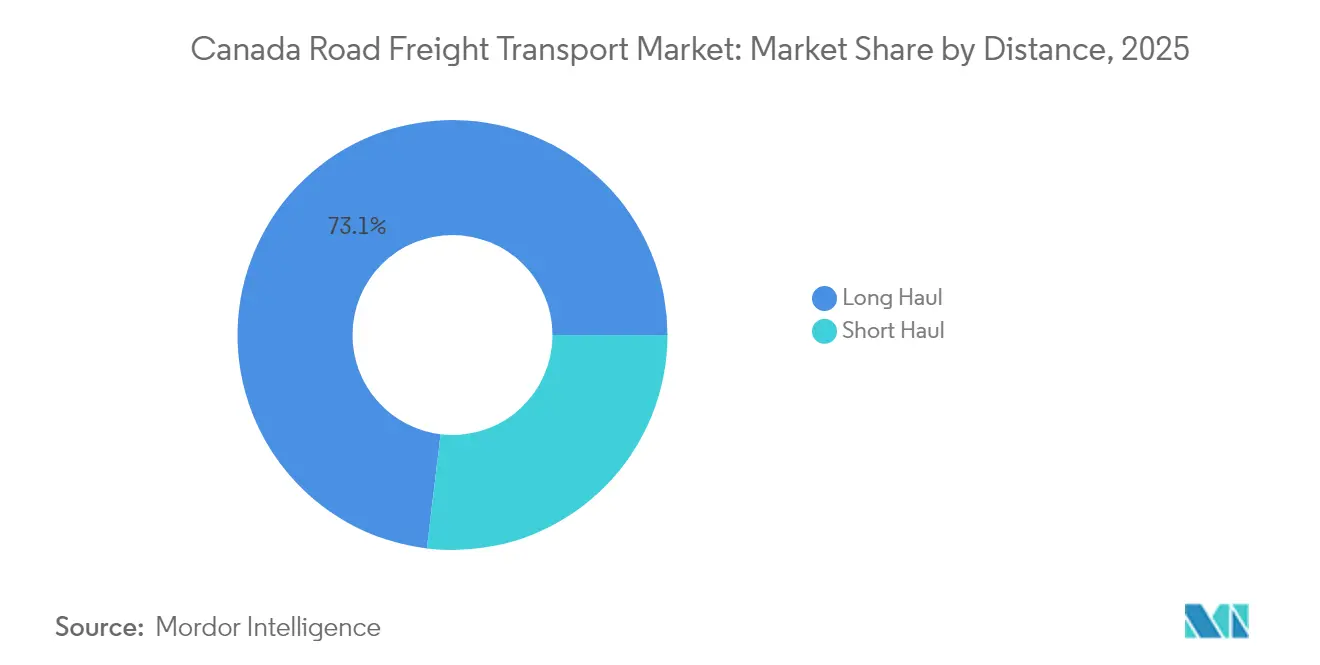
- By distance, long-haul freight accounted for 73.10% of 2025 revenue and is likely to progress at a 4.42% CAGR between 2026-2031 as resource exports rebound.
- By goods configuration, solid goods led with a 70.25% slice in 2025, whereas fluid cargo is poised for a 4.47% CAGR between 2026-2031 due to petroleum hauling requirements.
- By temperature control, non-temperature-controlled moves captured 94.39% of 2025 activity, yet the refrigerated segment is forecast to grow at a 4.60% CAGR between 2026-2031 on pharmaceutical demand and fresh-food logistics.
Note: Market size and forecast figures in this report are generated using Mordor Intelligence’s proprietary estimation framework, updated with the latest available data and insights as of 2026.
Canada Road Freight Transport Market Trends and Insights
Drivers Impact Analysis*
| Driver | (~) % Impact on CAGR Forecast | Geographic Relevance | Impact Timeline |
|---|---|---|---|
| Same-day, hyper-local e-commerce fulfillment | +0.8% | Major metro areas—Toronto, Vancouver, Montréal | Short term (≤ 2 years) |
| Class 7-8 electrification mandates | +0.6% | National; early uptake in British Columbia and Quebec | Medium term (2-4 years) |
| National Trade Corridors Fund upgrades | +0.7% | Key gateways—Windsor-Detroit, Pacific | Long term (≥ 4 years) |
| OEM digital freight platforms | +0.5% | Alberta and Ontario manufacturing belts | Short term (≤ 2 years) |
| Carbon-pricing rebates | +0.4% | Province-dependent | Medium term (2-4 years) |
| Autonomous yard-truck pilots | +0.3% | Distribution hubs in Ontario and British Columbia | Long term (≥ 4 years) |
| Source: Mordor Intelligence | |||
E-Commerce Fulfillment Shift to Same-day and Hyper-Local Distribution
Canada’s online retail value reached CAD 84.3 billion (USD 62.1 billion) in 2024 as consumer expectations narrowed delivery windows to hours rather than days. This behavioral pivot drives more frequent, smaller shipments that elevate less-than-truck-load (LTL) volumes by 15-20% across dense urban zones. Retailers respond with micro-fulfillment centers that shorten stem miles, spurring carriers to redesign terminal networks for rapid cross-docking efficiency. Walmart Canada’s CAD 6.1 billion (USD 4.60 billion) supply-chain modernization showcases large-scale fleet optimization aimed at same-day reach. Higher stop counts per route boost revenue potential but also intensify traffic congestion and labor scheduling complexities. Consequently, the Canada road freight transport market now revolves around urban density strategies and data-driven routing to maintain on-time performance[1]“National Trade Corridors Fund,” Transport Canada, TC.CANADA.CA.
Electrification Mandates for Class 7-8 Trucks Post-2025
Transport Canada targets 100% zero-emission heavy-duty vehicle sales by 2040, placing cost pressure on fleets because battery-electric tractors price at 2.5–3× diesel models. Federal incentives worth CAD 547 million soften the hurdle, yet unit economics remain challenging until battery costs decline or carbon levies rise further. Early implementations cluster in power-rich provinces where hydroelectricity offers lower operating costs, underscoring the regionalized nature of adoption. Larger carriers leverage scale to pilot e-trucks, cultivate renewable power purchase agreements, and secure green-freight contracts from sustainability-focused shippers. Smaller owner-operators risk margin erosion as capital requirements mount, potentially accelerating industry consolidation within the Canada road freight transport market[2]“Gordie Howe International Bridge,” Windsor-Detroit Bridge Authority, GORDIEHOWEINTERNATIONALBRIDGE.COM .
Trade Corridor Upgrades Under the National Trade Corridors Fund
The USD 3.4 billion National Trade Corridors Fund earmarks capacity fixes on vital gateways handling the majority of bilateral truck commerce. The Gordie Howe International Bridge unveils 12 inspection lanes in September 2025, doubling Windsor-Detroit throughput and bypassing downtown congestion. Western improvements such as the Roberts Bank Terminal 2 extension add 2.4 million TEU to Vancouver’s marine interface, reinforcing intermodal linkages for inland truckers. Each upgrade redistributes freight flows, benefiting fleets situated along revitalized corridors while compelling others to realign route structures. Over time, lower dwell times and predictable crossing schedules enhance driver productivity, nudging the overall Canada road freight transport market toward higher asset turnover.
OEM Direct-to-Carrier Digital Freight Platforms
Automakers and heavy equipment producers increasingly bypass traditional brokers by contracting loads through proprietary portals that algorithmically balance networks. Ford’s transportation platform alone orchestrates more than 50,000 monthly moves and slashes carrier deadhead by 8-12%. Canadian fleets clustered around Ontario’s automotive heartland exploit these direct links to secure multi-year volume commitments with transparent key-performance metrics. Participation requires robust telematics and API-based visibility, incentivizing investment in real-time tracking tools. As OEM portals proliferate, broker margins compress, prompting logistics intermediaries to pivot into value-added services or risk disintermediation within the Canada road freight transport market.
Restraints Impact Analysis*
| Restraint | (~) % Impact on CAGR Forecast | Geographic Relevance | Impact Timeline |
|---|---|---|---|
| Driver retirement deficit | -0.9% | Nationwide; acute in Alberta and Saskatchewan | Short term (≤ 2 years) |
| Border-crossing dwell times | -0.6% | Windsor-Detroit and Pacific Highway corridors | Medium term (2-4 years) |
| Medium-duty chassis semiconductor shortage | -0.4% | National | Short term (≤ 2 years) |
| Insurance premium escalation | -0.5% | High-traffic corridors country-wide | Long term (≥ 4 years) |
| Source: Mordor Intelligence | |||
Driver Shortage Entering Structural Deficit
Roughly 25,000 veteran operators reach retirement each year through 2028, outpacing 18,000 new licensees and leaving a persistent capacity gap. The imbalance intensifies in energy-rich provinces where oilfield wages lure qualified drivers, inflating carrier payrolls by more than 6% annually. Carriers introduce retention incentives such as guaranteed home-time schedules and sign-on bonuses, yet lifestyle sacrifices inherent to long-haul work deter recruits. Advanced driver-assist systems help reduce fatigue and widen the candidate pool by lowering skill thresholds, but cannot fully resolve the headcount deficit. Tight labor supply therefore constrains fleet growth regardless of freight demand, capping the upside potential of the Canada road freight transport market[3]“North American Freight Transportation Statistics,” Bureau of Transportation Statistics, BTS.GOV .
Chronic Border-Crossing Dwell Times
Peak-hour waits at the Ambassador Bridge average 45 minutes—triple the queue at lower-volume crossings eroding driver hours-of-service availability and inflating operating costs. Pacific Highway ports experience similar seasonal jams that impede forestry and produce exports. Lost utilization equates to up to 12% network capacity, pushing carriers to levy congestion surcharges that ultimately filter into shipper landed costs. Automation upgrades and the forthcoming Gordie Howe span will ease but not eliminate processing variability, meaning fleets must still bake buffer time into schedules. Until throughput reliability improves, border congestion remains a drag on the Canada road freight transport market[4]“Commercial Programs,” Canada Border Services Agency, CBSA-ASFC.GC.CA.
*Our forecasts treat driver/restraint impacts as directional, not additive. The impact forecasts reflect baseline growth, mix effects, and variable interactions.
Segment Analysis
By End User Industry: Trade Dominance Drives Growth
Wholesale and retail trade produced the largest 26.43% Canada road freight transport market share in 2025 amid booming e-commerce volumes and dense distribution center footprints in Central Canada. The segment’s 4.78% CAGR between 2026-2031 trajectory outpaces all other verticals, propelled by omnichannel fulfillment and cross-border replenishment for U.S. consumer brands. Manufacturing freight retains sizable volume tied to automotive, aerospace, and food processing clusters, though its growth lags due to supply-chain re-shoring and component shortages. Energy-related hauling fluctuates with commodity cycles but still underpins long-haul lanes from Alberta to tidewater terminals. Construction material moves track provincial infrastructure budgets and urban housing booms, supporting steady demand for bulk and flatbed capacity.
Intensifying urban consumer demand compels retailers to invest in warehouse automation and regional parcel hubs, thereby creating origin-destination pairs favorable to LTL networks. Agricultural shippers rely on flexible truck capacity to bridge gaps between farm gate and railhead during peak harvest, especially when rail congestion threatens grain export timelines. Niche opportunities surface in renewable-energy equipment logistics that require specialized trailers and permits, rewarding carriers versed in oversize handling procedures. Consequently, diversified fleets able to toggle between consumer, industrial, and resource cargos will capture outsized returns in the evolving Canada road freight transport market.


By Destination: Cross-Border Acceleration
Domestic freight represented 64.02% of tonnage in 2025 as Canada’s dispersed population and resource deposits necessitate extensive intra-provincial hauls. Yet international corridors promise faster expansion, with a projected 4.92% CAGR between 2026-2031 linked to CUSMA liberalization, currency tailwinds, and upgraded inspection infrastructure. Inbound finished goods and outbound lumber, grain, and auto parts dominate cross-border manifests, reinforcing balanced lane economics. Reduced customs paperwork via electronic data interchange further trims cycle times, allowing carriers to redeploy assets more efficiently.
Inside Canada, the Quebec City–Windsor megaregion concentrates 60% of GDP and sustains high backhaul ratios, an advantage rarely matched in other geographies. Intermodal alternatives siphon away some high-volume freight; however, trucks remain indispensable for first-mile pickup and last-mile delivery at industrial parks. As the Gordie Howe span relieves legacy choke points, fleets will re-optimize long-haul schedules to capture incremental U.S. Midwest demand. The upshot is a rebalanced lane mix favoring profitable cross-border flows within the Canada road freight transport market.
By Truckload Specification: LTL Gains Momentum
Full-truck-load service retained 79.78% share in 2025, reflecting the prevalence of bulk commodities and consolidated retail replenishment. However, LTL’s forecast 4.71% CAGR between 2026-2031 signifies a secular tilt toward fragmented e-commerce parcels and just-in-time industrial parts. Shippers increasingly prioritize inventory agility over scale economies, prompting carriers to construct sophisticated hub-and-spoke sorting grids. Rising LTL density enhances yield but demands greater IT spend in dimensional pricing and dock automation.
Meanwhile, FTL lanes remain critical in agricultural, forestry, and mining supply chains where uniform cargos maximize trailer utilization. Environmental policies aimed at cutting greenhouse-gas emissions drive FTL operators to retrofit tractors with aerodynamic kits and train drivers in fuel-efficient practices. Competitive pressure lingers because single-truck entrepreneurs can still enter FTL markets with modest capital outlay, preserving fragmentation. Larger enterprises therefore anchor customer loyalty through dedicated contracts, drop-and-hook programs, and data visibility—differentiators central to sustaining margins in the Canada road freight transport market.
By Containerization: Traditional Methods Persist
Non-containerized freight governed 86.02% of loads in 2025, consistent with Canada’s heavy resource orientation and oversized machinery requirements. Yet containerized cargo is set to log a 4.33% CAGR between 2026-2031, tied to manufacturing recovery and port terminal expansions that favor standardized units. Automotive parts, electronics, and apparel shippers gravitate toward 53-foot domestic containers that simplify modal transfers between rail and road, cutting handling cost.
Bulk carriers employ belly-dump, pneumatic, and tank trailers ill-suited to ISO containers, preserving modal separation. Nevertheless, port authorities pledge drayage-only truck gates and off-peak appointments to accelerate box turns, which encourages fleets to invest in multipurpose chassis. Inland depots at Calgary and Winnipeg emerge as staging hubs, linking Asian import flows to Prairie markets. Over the forecast period, higher container velocity could divert some general freight away from FTL vans, adding nuance to capacity planning within the Canada road freight transport market.
By Distance: Long-Haul Efficiency Advantages
Long-haul trips exceeded 73.10% of 2025 mileage thanks to vast inter-provincial stretches and commodity export routings. Efficient cruise speeds, minimal urban stops, and favorable fuel burn economics underpin the segment’s 4.42% CAGR between 2026-2031 projection. Driver turnover, however, heightens as extended time on the road strains work-life balance. Incentive-based pay structures and team driving mitigate fatigue while preserving transit commitments.
Short-haul freight thrives in metropolitan rings feeding regional grocery, construction, and parcel volumes. The advent of urban consolidation centers and municipal noise ordinances pushes fleets toward quieter, zero-emission medium-duty trucks for city loops. Long-haul tractors mount auxiliary power units and adaptive cruise controls to meet regulatory idling limits and safety mandates. Consequently, technology-led productivity gains help carriers offset wage and insurance inflation, sustaining competitiveness in the Canada road freight transport market.
By Goods Configuration: Solid Goods Leadership
Solid goods hauling captured 70.25% of 2025 activity, spanning lumber, consumer packaged goods, and fabricated metals. Predictable handling norms allow high asset rotation and bulk contract agreements. Fluid cargos, while only 29.75% of volume, are forecast to grow faster at a 4.47% CAGR between 2026-2031 as pipeline constraints elevate tanker-truck demand for petroleum and chemicals. Stringent hazmat protocols compel carriers to invest in specialized fittings, driver training, and real-time temperature sensors.
Refinery turnarounds and seasonal heating-oil spikes inject volatility into fluid freight pricing, offering premium margins for flexible fleets. Solid goods carriers pursue lightweight trailer specs that increase payload and lower per-mile emissions. Diversification across both configurations insulates operators from commodity cycles and fortifies resilience in the Canada road freight transport market.
By Temperature Control: Specialized Growth Opportunities
Non-temperature-controlled shipments comprised 94.39% of movements in 2025, yet refrigerated freight is on a 4.60% CAGR between 2026-2031 climb steered by pharmaceuticals and perishables. Biologics distribution mandates validated cold chain with continuous monitoring, and Health Canada audits heighten compliance costs. UPS’s USD 1.6 billion acquisition of Andlauer Healthcare illustrates the premium global 3PLs place on certified temperature infrastructure.
Fresh-food e-commerce growth requires multi-stop routing with narrow delivery windows, elevating dwell time but also boosting yield on high-value loads. Equipment retrofits such as electric transport refrigeration units align with decarbonization goals while reducing noise in dense neighborhoods. As lifestyle health trends expand the refrigerated SKU mix, cold-chain capacity will become a strategic differentiator inside the Canada road freight transport market.
Geography Analysis
Ontario anchors close to 39.58% of national freight due to its manufacturing density and direct access to Midwest consumer markets via Windsor-Detroit crossings. The September 2025 bridge opening instantly duplicates lane capacity, slashing detour mileage and boosting round-trip frequency. Quebec secures the second-largest share, leveraging the St. Lawrence Seaway for inbound sheet steel and outbound processed foods, while provincial language and safety statutes necessitate customized compliance programs.
Alberta’s truck counts fluctuate with drilling cycles, yet its location as a gateway to northern resource plays sustains high-cube flatbed and tanker demand. British Columbia handles Asian import inflows through Vancouver, where the Roberts Bank Terminal 2 buildout promises to draw incremental drayage moves onto Highway 1. Prairie provinces generate seasonal surges during grain harvest that strain trailer availability and bid up rates; savvy operators reposition empty equipment in anticipation to maximize yield.
Atlantic Canada, though the smallest, benefits from seafood exports and automotive transshipment at the Port of Halifax. Northern corridors see intermittent mine-supply convoys and seasonal ice-road operations, but remain a niche slice of the Canada road freight transport market. Provincial carbon-pricing discrepancies complicate route costing, nudging fleets toward fuel-efficient paths even if mileage rises modestly.
Competitive Landscape
The Canada road freight transport market encompasses thousands of carriers and remains fragmented. TFI International, operating over 13,000 tractors, advances its buy-and-build model, acquiring heavy-haul specialist Daseke assets for USD 800 million in January 2025. UPS deepens its healthcare logistics moat through the Andlauer takeover, signaling a pivot toward regulated freight with defensible margins. Bison Transport’s intermodal pact with CPKC combines rail length-of-haul savings with truck flexibility, underscoring modal-agnostic service strategies.
Digital freight marketplaces press traditional brokers by offering instant pricing and transparent carrier scorecards. Telematics integration across tractors and trailers supplies granular data that shippers leverage in bid events, rewarding fleets with proven service reliability.
Environmental, social, and governance (ESG) metrics increasingly influence contract awards, nudging fleets to disclose carbon intensity per load. Altogether, technology fluency, specialized service offerings, and cross-border corridor strength dictate competitive positioning throughout the Canada road freight transport market.
Canada Road Freight Transport Industry Leaders
Day & Ross
Mullen Group Ltd.
TFI International
Bison Transport
Manitoulin Group of Companies
- *Disclaimer: Major Players sorted in no particular order

Recent Industry Developments
- April 2025: UPS finalized the USD 1.6 billion acquisition of Andlauer Healthcare Group, augmenting nationwide cold-chain capacity and regulatory expertise.
- January 2025: TFI International completed its USD 800 million purchase of Daseke’s specialized hauling units, adding 2,400 tractors and 4,200 trailers to the North American fleet.
- November 2024: Bison Transport entered a multi-year intermodal services agreement with CPKC Railway covering container moves between Vancouver and Calgary.
- September 2024: Canada Cartage acquired Walmart Canada’s private fleet assets, incorporating about 180 tractors into dedicated retail distribution contracts.


Canada Road Freight Transport Market Report Scope
Agriculture, Fishing, and Forestry, Construction, Manufacturing, Oil and Gas, Mining and Quarrying, Wholesale and Retail Trade, Others are covered as segments by End User Industry. Domestic, International are covered as segments by Destination. Full-Truck-Load (FTL), Less than-Truck-Load (LTL) are covered as segments by Truckload Specification. Containerized, Non-Containerized are covered as segments by Containerization. Long Haul, Short Haul are covered as segments by Distance. Fluid Goods, Solid Goods are covered as segments by Goods Configuration. Non-Temperature Controlled, Temperature Controlled are covered as segments by Temperature Control.End User Industry
| Agriculture, Fishing, and Forestry |
| Construction |
| Manufacturing |
| Oil and Gas, Mining and Quarrying |
| Wholesale and Retail Trade |
| Others |
Destination
| Domestic |
| International |
Truckload Specification
| Full-Truck-Load (FTL) |
| Less than-Truck-Load (LTL) |
Containerization
| Containerized |
| Non-Containerized |
Distance
| Long Haul |
| Short Haul |
Goods Configuration
| Fluid Goods |
| Solid Goods |
Temperature Control
| Non-Temperature Controlled |
| Temperature Controlled |
| End User Industry | Agriculture, Fishing, and Forestry |
| Construction | |
| Manufacturing | |
| Oil and Gas, Mining and Quarrying | |
| Wholesale and Retail Trade | |
| Others | |
| Destination | Domestic |
| International | |
| Truckload Specification | Full-Truck-Load (FTL) |
| Less than-Truck-Load (LTL) | |
| Containerization | Containerized |
| Non-Containerized | |
| Distance | Long Haul |
| Short Haul | |
| Goods Configuration | Fluid Goods |
| Solid Goods | |
| Temperature Control | Non-Temperature Controlled |
| Temperature Controlled |


Market Definition
- Agriculture, Fishing, and Forestry (AFF) - This end user industry segment captures the external (outsourced) logistics expenditure incurred by the AFF industry players on road freight transport service. The end user players considered are the establishments primarily engaged in growing crops, raising animals, harvesting timber, harvesting fish & other animals from their natural habitats and providing related support activities. Herein, across the value chain, Logistics Service Providers (LSPs) play a crucial role in acquisition, storage, handling, transportation, and distribution activities for the optimal & continuous flow of inputs (seeds, pesticides, fertilizers, equipment, and water) from manufacturers or suppliers to the producers and smooth flow of output (produce, agro-goods) to distributors/ consumers. This includes both termperature controlled and non-temperature controlled logistics, as and when required according to the shelf life of goods being transported or stored.
- Construction - This end user industry segment captures the external (outsourced) logistics expenditure incurred by the construction industry players, on road freight transport service. The end user players considered are the establishments primarily engaged in constructing, repairing and renovating residential & commercial buildings, infrastructure, engineering works, subdividing and developing land. Logistics Service Providers (LSPs) play a crucial role in increasing profitability of construction projects by maintaing the inventory of raw materials & equipment, time-critical supplies and by providing other value added services for effective project management.
- Containerized Road Freight Transport - The segment captures the external (outsourced) logistics expenditure incurred by the road freight transport service end users on Full-Truck-Load (FTL) services. FTL road freight transport is characterized as a full single load not combined with other shipments. It comprises of shipments (i) devoted to the goods of a single shipper (ii) taken directly from a point of origin to one or more destination points (iii) comprising of bulk mail truck transportation (iv) comprising of both Container (Full Container Load, FCL)/Non-Container trucking services (v)comprsing of goods requiring temperature controlled or non-temperature controlled transportation services (vi) comprising of bulk liquid tankering (vii) invoving trucking of waste (viii) hazardous material trucking. Related value added services (VAS) of sorting, consolidation, deconslidation are included in the other services segment of freight and logistics market.
- Export Trends and Import Trends - Overall logistics performance of an economy is positively and significantly (statistically) correlated to its trade performance (exports and imports). Hence, in this industry trend, total value of trade, major commodities/ commodity groups and the major trade partners, for the studied geography (country or region as per the scope of report) have been analysed alongside the impact of major trade/logistics infrastructure investments & regulatory environment.
- Fluid Goods - The segment captures the external (outsourced) logistics expenditure incurred by the road freight transport service end users for the transport of bulk liquids, that are often used in extraction, manufacturing, food processing, agriculture industries among others. It includes transportation of liquids like (i) Chemicals/ hazardous goods (for instance acids) (ii) Water (potable as well as waste) (iii) Oil and gas (upstream as well as downstream like gasoline, fuel, crude oil, or propane), (iv) Food grade bulk liquids (like milk, or juice), (v) Rubber, (vi) Agrichemical products, among others. These goods are generally transported through tanker trucking.
- Fuel Price - Fuel price spikes can cause delays and diruption for logistics service providers (LSPs), while drops in the same can result in higher short-term profitability and increased market rivalry to offer consumers with the best deals. Hence, the fuel price variations have been studied over the review period and presented along with the causes as well as market impacts.
- Full-Truck-Load (FTL) Road Freight Transport - The segment captures the external (outsourced) logistics expenditure incurred by the road freight transport service end users on Full-Truck-Load (FTL) services. FTL road freight transport is characterized as a full single load not combined with other shipments. It comprises of shipments (i) devoted to the goods of a single shipper (ii) taken directly from a point of origin to one or more destination points (iii) comprising of bulk mail truck transportation (iv) comprising of both Container (Full Container Load, FCL)/Non-Container trucking services (v)comprsing of goods requiring temperature controlled or non-temperature controlled transportation services (vi) comprising of bulk liquid tankering (vii) invoving trucking of waste (viii) hazardous material trucking. Related value added services (VAS) of sorting, consolidation, deconslidation are included in the other services segment of freight and logistics market.
- GDP Distribution by Economic Activity - Nominal Gross Domestic Product and distribution of the same, across major economic sectors in the geography studied (country or region as per scope of the report) have been studied and presented in this industry trend. As GDP is positively related to the profitability and growth of logistics industry, this data has been used in adjunction to the input-output tables/ supply-use tables for analyzing the potential major contributing sectors towards the logistics demand.
- GDP Growth by Economic Activity - Growth of Nominal Gross Domestic Product across major economic sectors, for the geography studied (country or region as per scope of the report) have been presented in this industry trend. This data has been utilized for assessing the growth of logistics demand from all the market end users (economic sectors considered here).
- Inflation - Variations in both Wholesale Price Inflation (YoY change in producer price index) and Consumer Price Inflation have been presented in this industry trend. This data has been used to assess the inflationary environment as it plays a vital role in smooth functioning of the supply chain, directly impacting the logistics operational cost components e.g., pricing of tyres, driver wages & benefits, energy/fuel prices, maintenace costs, toll charges, warehousing rents, custom brokerage, forwarding rates, courier rates etc. hence impacting the overall freight and logistics market.
- Key Industry Trends - The report section named "Key Industry Trends" include all the key variables/parameters studied to better analyze the market size estimates and forecasts. All the trends have been presented in the form of data points (time series or latest available data points) along with analysis of the paramter in the form of concise market relevant commentary, for the geography studied (country or region as per the scope of report).
- Key Strategic Moves - The action taken by a company to differentiate from its competitor or used as a general strategy is referred to as a key strategic move (KSM). This includes (1) Agreements (2) Expansions (3) Financial Restructuring (4) Mergers and Acquisitions (5) Partnerships, and (6) Product Innovations. Key players (Logistics Service Providers, LSPs) in the market have been shortlisted, their KSM have been studied and presented in this section.
- Less than-Truck-Load (LTL) Road Freight Transport - The segment captures the external (outsourced) logistics expenditure incurred by the road freight transport service end users on Less than-Truck-Load (LTL) services. LTL road freight transport is characterized as multiple shipments combined onto a single truck for multiple deliveries within a network. It comprises of establishments (i) primarily engaged in general and specialized freight trucking of less than complete truck-loads, (ii) characterized by the use of terminals to consolidate shipments, generally from several shippers, into a single truck for haulage between a load assembly terminal and a disassembly terminal, where the load is sorted and shipments are re-routed for delivery (iv) Less than-Container-Load (LCL) shipping/ Groupage Shipping in case of trucking services. The activities in scope include (i) local pick-up, (ii) line-haul, and (iii) local delivery. Related value added services (VAS) of sorting, consolidation, deconslidation are included in the other services segment of freight and logistics market.
- Logistics Performance - Logistics Performance and Logistics Costs are the backbone of trade, and influences trade costs, making countries compete globally. Logistics performance is influenced by market wide adopted supply chain management strategies, government services, investments & policies, fuel/ energy costs, inflationary environment etc. Hence, in this industry trend, the logistics performance of the geography studied (country/ region as per the scope of report) has been analysed and presented over the review period.
- Major Truck Suppliers - Market share of truck brands is influenced by factors like geographical preferences, portfolio of truck types, truck prices, local production, truck repair & maintenance service peneteration, customer support, technological innovations (like electric vehicles, digitalization, autonomous trucks), fuel efficiency, financing options, annual maintenance costs, availability of substitutes, marketing startegies etc. Hence, the distribution (share % for base year of the study) of truck sales volume for leading truck brands and commentary on current market scenario & market anticipation over the forecast period have been presented in this industry trend.
- Manufacturing - This end user industry segment captures the external (outsourced) logistics expenditure incurred by the Manufacturing industry players, on road freight transport service. The end user players considered are the establishments primarily engaged in the chemical, mechanical or physical transformation of materials or substances into new products. Logistics Service Providers (LSPs) play a crucial role in maintaining a smooth flow of raw materials across the supply chain, enabling timely delivery of finished goods to distributors or end customers and storing & supplying the raw materials to clients for just-in-time manufacturing.
- Modal Share - Freight Modal Share is influenced by factors like modal productivity, government regulations, containerization, distance of shipment, temperature control requirements, type of goods, international trade, terrain, speed of delivery, shipment weight, bulk shipments, etc. Also, modal share by tonnage (tons) and modal share by freight turnover (ton-km) differ as per average distance of shipments, weight of major commodity groups transported in the economy and number of trips. This industry trend represents the distribution of freight transported by mode of transport (tons as well as ton-km), for the study base year.
- Oil and Gas, Mining and Quarrying - This end user industry segment captures the external (outsourced) logistics expenditure incurred by the extraction industry players, on road freight transport service. The end user players considered are the establishments that extract naturally occurring mineral solids, such as coal and ores; liquid minerals, such as crude petroleum; and gases, such as natural gas. Logistics Service Providers (LSPs) covers entire phases from upstream to downstream and plays a crucial role in the transportation of machinery, drilling equipments, extracted minerals, crude oil & natural gas and refined/ processed products from one place to another.
- Other End Users - Other end user segment captures the external (outsourced) logistics expenditure incurred by the financial services (BFSI), real estate, educational services, healthcare, and professional services (administrative, waste management, legal, architectural, engineering, design, consulting, scientific R&D), on road freight transport service. Logistics Service Providers (LSPs) plays a crucial role in the reliable movement of supplies and documents to/from these industries such as transporting any equipment or resources required, shipping confidential documents and files, movement of medical goods & supplies (surgical supplies and instruments, including gloves, masks, syringes, equipment) to name a few.
- Producer Price Inflation - It indicates inflation from viewpoint of the producers viz. the average selling price received for their output over a period of time. Annual change (YoY) of producer price index is reported as wholesale price inflation in the "Inflation" industry trend. As WPI captures dynamic price movements in most comprehensive way, it is widely used by governments, banks, industry, business circles and is deemed important in formulation of trade, fiscal and other economic policies. The data has been used in adjunction to consumer price inflation for better understanding the inflationary environment.
- Road Freight Pricing Trends - Freight pricing by mode of transport (USD/tonkm), over the review period, has been presented in this industry trend. The data has been used in assessing the inflationary environment, impact on trade, freight turnover (tonkm), road freight transport market demand and hence the road freight transport market size.
- Road Freight Tonnage Trends - Freight tonnage (weight of goods in tons) handled by mode of transport, over the review period, has been presented in this industry trend. The data has been used as one of the parameters apart from average distance per shipment (km), freight volume (tonkm), and freight pricing (USD/tonkm) to assess the freight transport market size.
- Road Freight Transport - Hiring a road freight transport logistics service provider (LSP) or haulier (outsourced logistics), for the transport of commodities constitutes road freight transport market. The scope of study includes (i) road transport of goods reported by hauliers registered in the reporting countries (ii) transport of raw materials or manufactured goods (solids as well as fluids) (iii) transport using commerical motor vehicles (rigid trucks or tractor-trailers, (iv) Full-Truck-Load (FTL) or Less than-Truck-Load (LTL) transport (v) containerized or non-containerized transport (vi) temperature controlled or non-temperature controlled trasnport, (vii) short haul or long haul (Over-the-road, OTR) transport, (viii) used office or household goods transport (movers and packers), (ix) other specialized cargo transport (dangerous goods, oversized cargo) and (x) outsourced first mile/ middle mile/last mile delivery shipments undertaken by road freight transport players. The scope does not include (i) transport undertaken by hauliers registered in other countries (ii) last mile meal delivery market (iii) grocery delivery market (iv) transportation via road network undertaken/ reported by Courier, Express, and Parcel (CEP) players.
- Road Length - As infrastructure plays a vital role in an economy's logistics performance, variables like length of roads, distribution of road length by surface category (paved v/s unpaved), distribution of road length by road classification (expressways v/s highways v/s other roads), have been analysed and presented in this industry trend.
- Segmental Revenue - Segmental Revenue has been triangulated or computed and presented for all the major players in the market. It refers to the road freight transport market specific revenue earned by the company, over the base year of study, in the geography studied (country or region as per the scope of report). It is computed through the study and analysis of major parameters like financials, service portfolio, employee strength, fleet size, investments, number of countries present in, major economies of concern, etc. that have been reported by the company in its annual reports, webpage. For companies having scarce financial disclosures, paid databases like D&B Hoovers, Dow Jones Factiva have been resorted to and verified through industry/expert interactions.
- Short Haul Road Freight Transport - The segment captures the external (outsourced) logistics expenditure incurred by the road freight transport service end users on local trucking (less than 100 miles). It includes the road transport of goods (i) within a single administrative area and its hinterland, (ii) by smaller trucks and pickup trucks (iii) via containerized as well as dry bulk services (iv) intermodal from ports, container terminals or airports, and (v) outsourced first mile/ last mile delivery shipments undertaken by road freight transport players.
- Transport and Storage Sector GDP - Value and growth of Transport and Storage Sector GDP has a direct relation to the freight and logistics market size, and hence road freight transport market size. Therefore, this variable has been studied and presented over the review period, in value terms (USD) and as share % of total GDP, in this industry trend. The data has been supported by concise and relevant commentary around the investments, developments, and current market scenario.
- Trends in E-Commerce Industry - Enhanced internet connectivity and boom in smartphone penetration, coupled with increasing disposable incomes, has led to a phenomenal growth in the e-commerce market globally. Online shoppers require fast and efficient delivery of their orders leading to an increase in the demand for logistics services especially e-commerce fulfilment services. Hence, the Gross Merchandise Value (GMV), historial and projected growth, breakup of major commodity groups in e-commerce industry for the studied geography (country or region as per scope of the report) have been analysed and presented in this industry trend.
- Trends in Manufacturing Industry - Manufacturing industry involves the transformation of raw materials into finished products, while logistics industry ensures the efficient flow of raw materials to the factory, and the transport of manufactured products to the distributors & consumers. Demand-Supply of both industries are highly cross-linked and critical for a seamless supply chain. Hence, the Gross Value Added (GVA), breakup of GVA into major manufacturing sectors, and growth of manufacturing industry over the review period have been analysed and presented, in this industry trend.
- Trucking Fleet Size By Type - Market share of truck types is influenced by factors like geographical preferences, major end user industries, truck prices, local production, truck repair & maintenance service peneteration, customer support, technological disruptions (like electric vehicles, digitalization, autonomous trucks) etc. Hence, the distribution (share % for base year of study) of truck parc volume by type of truck, market disruptors, truck manufacturing investments, truck specifications, truck use & import regulations, and market anticipation over the forecast period have been presented in this industry trend.
- Trucking Operational Costs - The prime reasons for measuring/ benchmarking logistics performance of any trucking company are to reduce operational costs and increase profitability. On the other hand, measuring operational costs helps to identify whether and where to make operational changes to control expenses and identify areas for improved performance. Hence, in this industry trend, trucking operational costs and the variables involved viz. driver wages & benefits, fuel prices, repairs & maintenance costs, tyre costs etc. have been studied over the base year of study, and presented for the geography studied (country or region as per the scope of report).
- Wholesale and Retail Trade - This end user industry segment captures the external (outsourced) logistics expenditure incurred by the wholesalers and retailers, on road freight transport service. The end user players considered are the establishments primarily engaged in wholesaling or retailing merchandise, generally without transformation, and rendering services incidental to the sale of merchandise. Logistics Service Providers (LSPs) plays a crucial role in the reliable movement of supplies to and finished products from production houses to the distributors and finally to the end customer covering activites like material sourcing, transportation, order fulfillment, warehousing & storage, demand forecasting, inventory management etc.
| Keyword | Definition |
|---|---|
| Cabotage | Road transport by a motor vehicle registered in a country performed on the national territory of another country. |
| Cross Docking | Cross docking is a logistics procedure where products from a supplier or manufacturing plant are distributed directly to a customer or retail chain with marginal to no handling or storage time. Cross docking takes place in a distribution docking terminal; usually consisting of trucks and dock doors on two (inbound and outbound) sides with minimal storage space. The name ‘cross docking’ explains the process of receiving products through an inbound dock and then transferring them across the dock to the outbound transportation dock. |
| Cross Trade | International road transport between two different countries performed by a road motor vehicle registered in a third country. A third country is a country other than the country of loading/embarkation and than the country of unloading/disembarkation. |
| Dangerous Goods | The classes of dangerous goods carried by Road are those defined by the fifteenth revised edition of the UN Recommendations on the Transport of Dangerous Goods, United Nations, Geneva 2007. They include Class 1: Explosives; Class 2: Gases; Class 3: Flammable Liquids; Class 4: Flammable solids- substances liable to spontaneous combustion; substances which, on contact with water, emit flammable gases; Class 5: Oxidizing substances and organic peroxides; Class 6: Toxic and infectious substances; Class 7: Radioactive material and Class 8: Corrosive substances, Class 9: Miscellaneous dangerous substances and articles. |
| Direct Shipment | Direct shipment is a method of delivering goods from the supplier or the product owner to the customer directly. In most cases, the customer orders the goods from the product owner. This delivery scheme reduces transportation and storage costs, but requires additional planning and administration. |
| Drayage | A drayage is a form of trucking service that connects the different modes of shipping (intermodal), such as ocean freight or air freight. It’s a short-haul trip that transports goods from one place to another, usually before or after its long-haul shipping process. Drayage trucks move cargo to and from various destinations, such as container ships, storage lots, order fulfillment warehouses, and rail yards. Typically, drayage only transports goods in short distances and operates only in one metropolitan area. It also requires only one trucker in a single shift. But despite this, but it plays an important role in long-haul shipping because it gets the goods to the cargo and vice versa. It makes intermodal transport much more efficient and enables the seamless transfer of goods to the end customer. |
| Dry van | A dry van is a type of semi-trailer that's fully enclosed to protect shipments from outside elements. Designed to carry palletized, boxed or loose freight, dry vans aren't temperature-controlled (unlike refrigerated “reefer” units) and can't carry oversized shipments (unlike flatbed trailers). |
| Final Demand | Final demand includes all types of commodities (goods as well as services) consumed as final use and might include personal consumption, or consumption by government, by businesses as capital investment, and as exports. includes all types of commodities (goods as well as services) consumed as final use and might include personal consumption, or consumption by government, by businesses as capital investment, and as exports. |
| Flatbed Truck | A flatbed truck is a type of truck with rigid design. It has a back body that is flatly shaped for easy loading and unloading of goods. The flatbed truck is mostly used to transport heavy, oversized, wide and indelicate goods such as machinery, building supplies or equipment. Due to the truck open body, the goods transported with it must not be vulnerable to rain. By functionality, the flatbed truck is comparable to a flatbed trailer. |
| Inbound Logistics | Inbound logistics is the way materials and other goods are brought into a company. This process includes the steps to order, receive, store, transport and manage incoming supplies. Inbound logistics focuses on the supply part of the supply-demand equation. |
| Intermediate Demand | Intermediate demand includes goods, services, and maintenance and repair construction sold to businesses, excluding capital investment. |
| International Loaded | Place of loading of goods in reporting country (i.e., country in which the vehicle performing the transport is registered) and place of unloading in a different country. |
| International Unloaded | Place of unloading of goods in reporting country (i.e., country in which the vehicle performing the transport is registered) and place of loading in a different country. |
| OOG cargo | Out of Gauge (OOG) cargo is any cargo that can not be loaded into six-sided shipping containers simply because it is too large. The term is a very loose classification of all cargo with dimensions beyond the maximum 40HC container dimensions. That is a length beyond 12.05 meters – a width beyond 2.33 meters – or a height beyond 2.59 meters. |
| Pallets | Raised platform, intended to facilitate the lifting and stacking of goods. |
| Part load | A part load describes goods which only fills a truck partially. In essence, the quantity of the shipment is bigger than the Less Than Truckload (LTL) shipment. Also, the shipment cannot fully occupy a truck i.e. its capacity is much lower than a Full Truckload (FTL) shipment. |
| Paved Road | Road surfaced with crushed stone (macadam) with hydrocarbon binder or bituminized agents, with concrete or with cobblestone. |
| Reverse Logistics | Reverse logistics comprises of the sector of supply chains that process anything returning inwards through the supply chain or traveling ‘backward’ through the supply chain. |
| Road Freight Transport Service | Hiring a trucking agency for transport of commodities (raw materials or manufactured goods including both solids and liquids) form the origin to a destination within the country (domestic) or cross-border (international) constitutes road freight transport market. The service might be Full-Truck-Load or Less than-Truck-Load, containerized or non-containerized, temperature controlled or non temperature controlled, short haul or long haul. |
| Tautliner vehicle | Tautliner and curtainsider are used as generic names for curtain sided trucks/trailers. The curtains are permanently fixed to a runner at the top and detachable rails/poles at front and rear, allowing the curtains to be drawn open and forklifts used all along the sides for easy and efficient loading and unloading. When closed for travel, vertical load restraint straps are attached to a rope rail beneath the truck bed, connecting the truck bed and curtain along both sides. Winches at either end of the curtain tension it, hence the 'Tautliner' name. This stops the curtain from flapping or drumming in the wind and can also help retain light loads from slipping sideways. |
| Transport for hire or reward | The carriage for remuneration of goods. |
| Unpaved Road | Road with a stabilized base not surfaced with crushed stone, hydrocarbon binder or bituminized agents, concrete or cobblestone. |


Research Methodology
Mordor Intelligence follows a four-step methodology in all our reports.
- Step-1: Identify Key Variables: In order to build a robust forecasting methodology, the variables and factors identified in Step-1 are tested against available historical market numbers. Through an iterative process, the variables required for market forecast are set and the model is built on the basis of these variables.
- Step-2: Build a Market Model: Market-size estimations for the forecast years are in nominal terms. Inflation is considered to be a part of the pricing, and the average selling price (ASP) is varying throughout the forecast period for each country
- Step-3: Validate and Finalize: In this important step, all market numbers, variables and analyst calls are validated through an extensive network of primary research experts from the market studied. The respondents are selected across levels and functions to generate a holistic picture of the market studied.
- Step-4: Research Outputs: Syndicated Reports, Custom Consulting Assignments, Databases & Subscription Platforms


