Market Overview
| Study Period | 2021 - 2031 |
|---|---|
| Forecast Data Period | 2026 - 2031 |
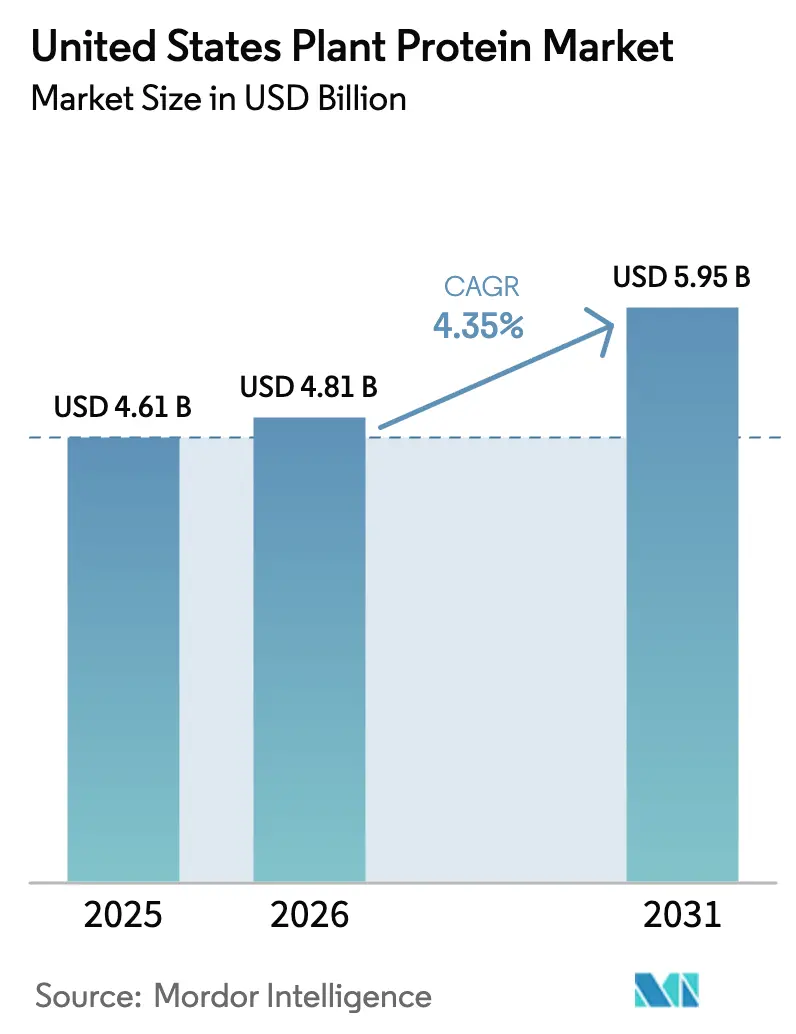
| Base Year Market Size (2025) | USD 4.61 Billion |
| Market Size (2026) | USD 4.81 Billion |
| Market Size (2031) | USD 5.95 Billion |
| Growth Rate (2026 - 2031) | 4.35% CAGR |
| Market Concentration | Medium |
Major Players
*Disclaimer: Major Players sorted in no particular order Image © Mordor Intelligence. Reuse requires attribution under CC BY 4.0. |
|
United States Plant Protein Market Analysis by Mordor Intelligence
The United States plant protein market size is expected to grow from USD 4.61 billion in 2025 to USD 4.81 billion in 2026 and is forecast to reach USD 5.95 billion by 2031 at 4.35% CAGR over 2026-2031. Growth is fueled by updated Dietary Guidelines that elevate plant proteins, expanded FDA GRAS approvals that simplify label claims, and corporate sustainability mandates that favor low-carbon ingredients. Soy protein retains scale advantages in crushing and extrusion, yet rice protein is gaining because of its hypoallergenic positioning with beverage formulators. Conventional ingredients dominate on volume, while organic and regenerative options grow faster where buyers pay premiums for verified sourcing. In parallel, livestock producers blend soy concentrates into feed to hedge fishmeal volatility, aligning animal-feed demand with food-grade crush margins. Competitive dynamics remain moderate; multinational processors leverage integrated supply chains, but mid-sized innovators capture niche opportunities in hypoallergenic, non-GMO, and fermented proteins.
Key Report Takeaways
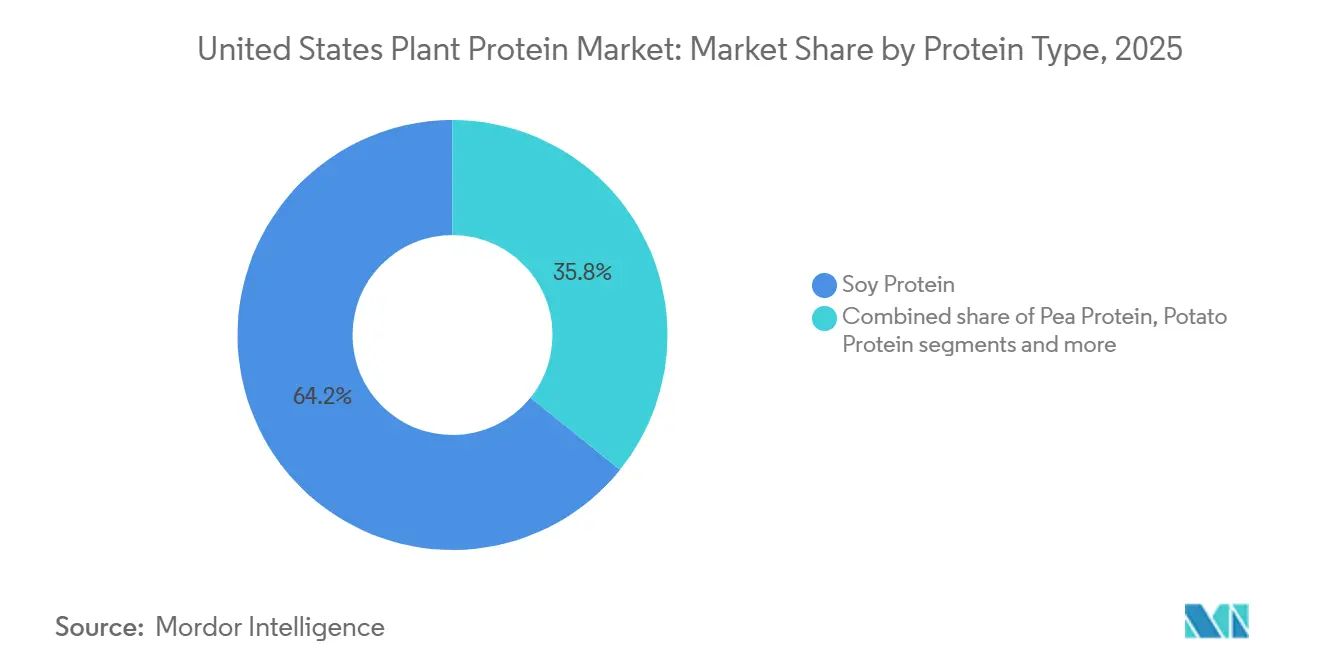
- By protein type, soy protein led with 64.21% of United States plant protein market share in 2025, while rice protein is projected to expand at a 5.71% CAGR through 2031.
- By category, conventional ingredients held 80.14% of the United States plant protein market size in 2025, whereas the organic segment is forecast to advance at a 6.22% CAGR to 2031.
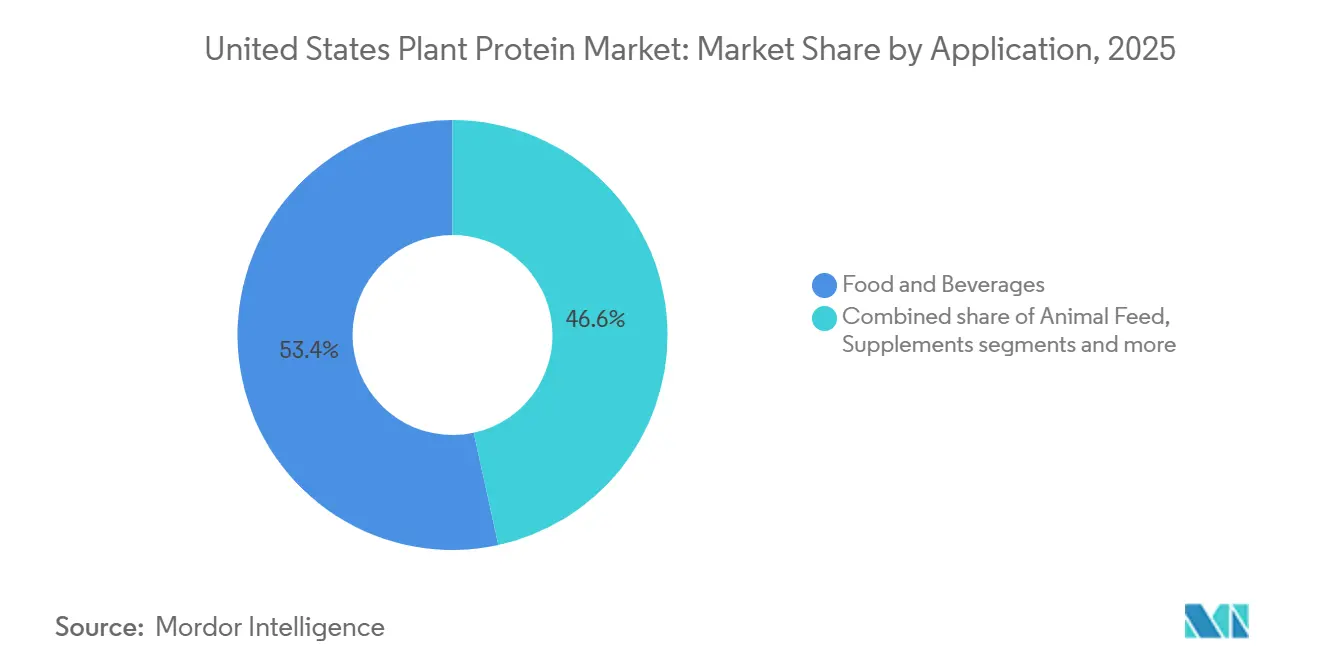
- By application, food and beverages accounted for a 53.41% share of the United States plant protein market size in 2025, and supplements are advancing at a 5.96% CAGR through 2031.
Note: Market size and forecast figures in this report are generated using Mordor Intelligence’s proprietary estimation framework, updated with the latest available data and insights as of January 2026.
United States Plant Protein Market Trends and Insights
Drivers Impact Analysis*
| Driver | (~) % Impact on CAGR Forecast | Geographic Relevance | Impact Timeline |
|---|---|---|---|
| Growing consumer demand for plant-based foods | +1.2% | National, with concentration in coastal urban markets | Medium term (2-4 years) |
| Increasing health and wellness awareness | +0.9% | National, accelerated in metropolitan areas | Short term (≤ 2 years) |
| Rising prevalence of lifestyle diseases | +0.7% | National, particularly Midwest and Southeast regions | Long term (≥ 4 years) |
| Expansion of vegan and flexitarian diets | +0.8% | National, strongest in West Coast and Northeast | Medium term (2-4 years) |
| Sustainability and environmental concerns | +0.6% | National, with regulatory influence in California | Long term (≥ 4 years) |
| Innovation in plant protein product formulations | +1.0% | National, driven by research and development hubs in Midwest and California | Short term (≤ 2 years) |
| Source: Mordor Intelligence | |||


Growing consumer demand for plant-based foods
Growing consumer demand for plant-based foods is strongly shaping the United States plant protein market. According to the Good Food Institute, around 60% of U.S. households purchased some type of plant-based food in 2024, indicating broad and sustained consumer adoption[1]Source: Good Food Institute, “U.S. retail market insights for the plant-based industry”, gfi.org. This shift is driven by increasing awareness of health benefits, environmental sustainability, and ethical considerations associated with plant-forward diets. Plant proteins are being widely incorporated into everyday foods such as meat alternatives, dairy substitutes, snacks, and ready-to-eat meals. Food manufacturers are expanding plant-based product portfolios to meet evolving consumer expectations and dietary preferences. The availability of diverse plant protein sources has also improved product variety and accessibility. As plant-based foods become a regular part of household consumption, demand for plant protein ingredients continues to strengthen across the United States market.
Increasing health and wellness awareness
Increasing health and wellness awareness among consumers is significantly influencing the United States plant protein market. In 2024, 54% of American consumers prioritized protein content when selecting packaged foods, up from 41% in 2020, reflecting growing consumer education around satiety, metabolic health, and muscle maintenance[2]Source: International Food Information Council, “2024 IFIC Food & Health SURVEY”, ific.org. This shift highlights a stronger focus on nutritional quality rather than just calorie content. Plant proteins are increasingly viewed as effective options for supporting active lifestyles, weight management, and long-term health. Their perceived benefits, including lower fat content and compatibility with clean-label diets, are encouraging wider adoption. Food and beverage manufacturers are responding by fortifying everyday products with plant protein to meet these expectations. As awareness continues to deepen, plant protein is becoming a core component of health-focused consumption patterns across the United States market.
Rising prevalence of lifestyle diseases
Rising prevalence of lifestyle-related conditions is influencing dietary choices across the United States and supporting the shift toward plant protein consumption. According to the Centers for Disease Control and Prevention (CDC), in 2024, approximately 7% of adults and 5% of children in the United States were affected by at least one food allergy, highlighting growing sensitivity toward food ingredients and overall health risks[3]Source: Centers for Disease Control and Prevention (CDC), "Almost a Third of U.S. Adults and Children Have at Least One Allergy", cdc.gov. Conditions such as obesity, diabetes, cardiovascular issues, and food-related intolerances are encouraging consumers to adopt healthier and more controlled diets. Plant proteins are increasingly preferred due to their lower saturated fat content and suitability for allergen-conscious nutrition. Many consumers associate plant-based diets with improved heart health, weight management, and better metabolic outcomes. Food manufacturers are responding by developing plant protein–rich products that align with preventive health goals. As lifestyle-related health concerns continue to rise, plant protein is becoming an integral part of dietary strategies aimed at long-term wellness.
Expansion of vegan and flexitarian diets
The expansion of vegan and flexitarian diets across the United States is accelerating the adoption of plant protein ingredients. Consumers are increasingly reducing their intake of animal-based foods while seeking nutritious and sustainable protein alternatives. Plant proteins offer versatility across a wide range of food and beverage applications, making them well suited for flexible eating patterns rather than strict dietary labels. Flexitarian consumers, in particular, are driving repeat demand by regularly incorporating plant-based meals into their diets. Food manufacturers and foodservice operators are responding by expanding plant-based menus and product lines. Improved taste, texture, and nutritional profiles of plant protein products are further encouraging acceptance among mainstream consumers.
Restraints Impact Analysis*
| Restraint | (~) % Impact on CAGR Forecast | Geographic Relevance | Impact Timeline |
|---|---|---|---|
| Higher cost of plant protein ingredients | -0.8% | National, with acute impact in price-sensitive retail channels | Short term (≤ 2 years) |
| Taste and texture challenges in certain products | -0.6% | National, particularly in whole-muscle meat analogs | Medium term (2-4 years) |
| Supply chain and raw material availability issues | -0.5% | National, concentrated in Midwest soybean belt | Short term (≤ 2 years) |
| Competition from traditional animal proteins | -0.7% | National, intensified by livestock industry price reductions | Medium term (2-4 years) |
| Source: Mordor Intelligence | |||
Higher cost of plant protein ingredients
Higher cost of plant protein ingredients is influencing purchasing and formulation decisions in the United States plant protein market. Compared to conventional animal-based proteins, many plant protein ingredients require additional processing, purification, and quality control, which increases production expenses. These higher costs are often passed on to food and beverage manufacturers, affecting product pricing at the retail level. Price-sensitive consumers may hesitate to adopt plant protein products, particularly in everyday food categories. Manufacturers targeting mass-market segments often face challenges in balancing affordability with nutritional and functional benefits. Cost pressures can also limit the use of premium or specialty plant proteins in large-scale applications. As a result, elevated ingredient costs can slow broader adoption and restrict market penetration.
Supply chain and raw material availability issues
Supply chain and raw material availability issues continue to affect the United States plant protein market. Plant protein production relies heavily on agricultural outputs such as soy, peas, and rice, which are vulnerable to weather conditions, crop yield variability, and seasonal fluctuations. Disruptions in farming, transportation, or processing can lead to inconsistent supply and pricing volatility. Manufacturers may face challenges in securing high-quality raw materials in sufficient volumes, especially during periods of strong demand. These uncertainties can delay production schedules and increase operational costs. Smaller producers are particularly exposed to supply limitations due to limited sourcing flexibility. As a result, inconsistencies in raw material availability can hinder stable production and slow market expansion.
*Our forecasts treat driver/restraint impacts as directional, not additive. The impact forecasts reflect baseline growth, mix effects, and variable interactions.
Segment Analysis
By Protein Type: Soy Dominance Meets Rice Protein's Hypoallergenic Appeal
Soy protein dominated the United States plant protein market in 2025, accounting for 64.21% of total market share, largely due to its long-established presence and widespread applications across various food and beverage categories. Its complete amino acid profile and high protein content make it a preferred choice for meat alternatives, bakery products, dairy substitutes, and nutritional supplements. The availability of cost-effective soy protein ingredients and well-developed supply chains further reinforce its market dominance. Manufacturers value soy protein for its functional properties, such as emulsification, gelation, and water-holding capacity, which enhance product quality. Additionally, soy protein is widely recognized by consumers as a reliable plant-based protein source, contributing to strong brand acceptance.
Rice protein is projected to be the fastest growing segment in the United States plant protein market, with a CAGR of 5.71% during the forecast period (2026-2031). Growth is driven by increasing consumer demand for hypoallergenic and easily digestible protein alternatives. Rice protein is gaining popularity in vegan, gluten-free, and allergen-free formulations, including protein powders, beverages, and meal replacements. Its mild taste and smooth texture make it suitable for blending with other plant proteins to improve flavor and nutritional profiles. Rising awareness about digestive health and clean-label ingredients further supports adoption. Food manufacturers are leveraging rice protein in premium and functional food applications, which is expected to accelerate market expansion.


By Category: Conventional Volume Versus Organic's Premium Trajectory
Conventional plant protein ingredients dominated the United States market in 2025, accounting for 80.14% of total market size. Their widespread adoption is driven by cost-effectiveness and large-scale availability, making them suitable for mainstream food and beverage applications such as bakery products, snacks, beverages, and meat alternatives. Conventional plant proteins benefit from well-established supply chains, reliable production capacities, and consistent quality standards. Food manufacturers often prefer these ingredients for high-volume formulations where affordability and functionality are key considerations.
The organic plant protein segment is projected to be the fastest growing in the market, with a CAGR of 6.22% through 2031. Growth is fueled by increasing consumer awareness of health, wellness, and sustainable food choices. Organic plant proteins are gaining traction in premium and clean-label food and beverage products, nutritional supplements, and functional foods. Consumers are willing to pay a premium for organic ingredients due to perceived benefits such as non-GMO sourcing, chemical-free cultivation, and environmental sustainability. Food manufacturers are responding by expanding organic-certified product lines and promoting transparency in sourcing.
By Application: Food and Beverages Lead, Supplements Surge
The food and beverage segment held the largest share of the United States plant protein market in 2025, accounting for 53.41% of total market size. This dominance is driven by the widespread incorporation of plant proteins in bakery products, snacks, beverages, and meat alternatives. Food manufacturers increasingly rely on plant proteins to meet consumer demand for healthier, plant-based, and clean-label options. The functional benefits of plant proteins, such as emulsification, gelling, and water-holding capacity, make them highly suitable for a variety of food formulations. Additionally, the segment benefits from strong consumer awareness and adoption of plant-based diets across both urban and suburban regions.
The supplements segment is projected to be the fastest growing application in the United States plant protein market, with a CAGR of 5.96% through 2031. Growth is driven by increasing consumer focus on fitness, wellness, and protein-enriched diets. Plant proteins are widely used in protein powders, meal replacements, and functional nutrition products due to their allergen-free and vegan-friendly attributes. Rising demand from health-conscious consumers, including athletes and individuals with dietary restrictions, is supporting adoption. Manufacturers are also innovating to improve taste, solubility, and formulation stability in supplements, enhancing product appeal.
Geography Analysis
The United States plant protein market demonstrates notable regional variation, driven by differences in production capacity, consumer behavior, and dietary trends. The Midwest region serves as the primary production hub due to its extensive cultivation of soybeans, peas, and other protein-rich crops. States such as Iowa, Illinois, and Minnesota offer favorable agricultural conditions, large-scale processing facilities, and well-established supply chains, ensuring a steady and cost-effective supply of raw materials. Manufacturers in this region benefit from proximity to farms, which reduces logistics costs and supports consistent quality.
The Western and Northeastern regions of the country are key consumption markets, driven by high population density and growing adoption of plant-based diets. Urban centers such as Los Angeles, New York, and San Francisco show strong demand for plant-based foods, beverages, and nutritional supplements. Health-conscious and flexitarian consumers in these areas prefer allergen-free, non-GMO, and clean-label protein products, which has spurred the introduction of innovative formulations. Foodservice and retail channels are particularly active in these regions, facilitating easier access to plant protein-based products.
The Southern and Southeastern regions are experiencing gradual market expansion, fueled by increasing awareness of health, wellness, and sustainable nutrition. Retail and e-commerce platforms are expanding accessibility, providing consumers in these regions with a wider selection of plant protein products. Institutional demand from schools, hospitals, and corporate cafeterias is also contributing to growth. Emerging interest in plant-based meat alternatives, protein-fortified snacks, and dietary supplements is driving adoption across various consumer segments.
Competitive Landscape
The United States plant protein market is moderately consolidated, with a mix of large multinational corporations and smaller specialized players sharing significant market influence. Major companies, such as Archer Daniels Midland Company, Cargill, Incorporated, Ingredion Incorporated, and Kerry Group, dominate through established production capacities, extensive distribution networks, and strong brand recognition. These players benefit from advanced processing technologies that enable consistent quality, high protein purity, and improved functional properties suitable for diverse applications. Their scale allows them to maintain cost efficiencies while supplying both conventional and specialty plant proteins across food, beverage, and supplement industries.
Product innovation and differentiation play a key role in shaping competition within the market. Leading players continuously invest in research and development to improve solubility, taste, texture, and nutritional profiles of plant proteins. Functional properties, such as emulsification and gelling, are enhanced to cater to specific applications like protein beverages, meat alternatives, and nutritional supplements. Strategic partnerships with foodservice brands, ingredient distributors, and retailers further strengthen competitive positioning. Companies also focus on certifications such as non-GMO, organic, and allergen-free labels to meet growing consumer demands for clean-label products.
Opportunities exist for niche and emerging players to gain traction through specialization and targeted product offerings. Organic, hypoallergenic, and sustainably sourced plant proteins are attracting attention in premium segments. Startups and smaller companies leverage innovation and marketing strategies to differentiate their products and appeal to health-conscious and environmentally aware consumers. Overall, the moderately consolidated nature of the market ensures stability while encouraging continuous innovation and specialization among key participants.
United States Plant Protein Industry Leaders
-
Archer Daniels Midland Company
-
Kerry Group PLC
-
Ingredion Incorporated
-
Cargill, Incorporated
-
Glanbia PLC
- *Disclaimer: Major Players sorted in no particular order

Recent Industry Developments
- August 2025: ADM is streamlining its global soy protein production network to boost efficiency and better serve customers worldwide. The company is leveraging operational excellence at its recently recommissioned soy protein facility in Decatur, Illinois, alongside other global facilities. This move is a part of ADM's larger strategy to optimize and simplify its portfolio, enabling a more efficient consolidation of its soy protein operations while still meeting the rising global demand.
- June 2025: Axiom Foods launched Vegotein N Neutral, a pea protein ingredient, to address the rising demand for plant-based proteins in the market. This product, derived from yellow non-GMO peas, offers an 80% protein concentration and is fully digestible, making it a suitable choice for various applications.
- May 2025: Bunge invested EUR 484 million to establish a soy protein facility in Morristown, Indiana. This new facility will enhance production capacity by processing an additional 4.5 million bushels of soybeans annually, supporting the growing demand for soy protein.


United States Plant Protein Market Report Scope
Plant protein is protein derived from plants, found in sources like legumes, nuts, seeds, grains, and soy products, serving as a vital nutrient for body functions. The United States plant protein market is segmented by protein type, category, and application. By protein type, the market is segmented into hemp protein, pea protein, potato protein, rice protein, soy protein, wheat protein, and more. By category, the market is segmented into conventional and organic. By application, the market is segmented into animal feed, food and beverages, personal care and cosmetics, and supplements. The Market Forecasts are Provided in Terms of Value (USD) and Volume (Tons).
By Protein Type
| Hemp Protein |
| Pea Protein |
| Potato Protein |
| Rice Protein |
| Soy Protein |
| Wheat Protein |
| Other Plant Proteins |
By Category
| Conventional |
| Organic |
By Application
| Animal Feed | |
| Food and Beverages | Bakery |
| Beverages | |
| Breakfast Cereals | |
| Condiments/Sauces | |
| Confectionery | |
| Dairy and Dairy Alternatives Products | |
| RTE/RTC Food Products | |
| Others | |
| Personal Care and Cosmetics | |
| Supplements |
| By Protein Type | Hemp Protein | |
| Pea Protein | ||
| Potato Protein | ||
| Rice Protein | ||
| Soy Protein | ||
| Wheat Protein | ||
| Other Plant Proteins | ||
| By Category | Conventional | |
| Organic | ||
| By Application | Animal Feed | |
| Food and Beverages | Bakery | |
| Beverages | ||
| Breakfast Cereals | ||
| Condiments/Sauces | ||
| Confectionery | ||
| Dairy and Dairy Alternatives Products | ||
| RTE/RTC Food Products | ||
| Others | ||
| Personal Care and Cosmetics | ||
| Supplements | ||


Market Definition
- End User - The Protein Ingredients Market operates on a B2B basis. Food, Beverages, Supplements, Animal Feed, and Personal Care & Cosmetic manufacturers are considered to be end-consumers in the market studied. The scope excludes manufacturers buying liquid/dry whey to be used for application as a binding agent or thickener or other non-protein applications.
- Penetration Rate - Penetration Rate is defined as the percentage of Protein-Fortified End User Market Volume in the Overall End User Market Volume.
- Average Protein Content - Average protein content is the average protein content present per 100 g of product manufactured by all end-user companies considered under the scope of this report.
- End User Market Volume - End-user market volume is the consolidated volume of all types and forms of end-user products in the country or region.
| Keyword | Definition |
|---|---|
| Alpha-lactalbumin (α-Lactalbumin) | It is a protein that regulates the production of lactose in the milk of almost all mammalian species. |
| Amino acid | It is an organic compound that contains both amino and carboxylic acid functional groups, which are required for the synthesis of body protein and other important nitrogen-containing compounds, such as creatine, peptide hormones, and some neurotransmitters. |
| Blanching | It is the process of briefly heating vegetables with steam or boiling water. |
| BRC | British Retail Consortium |
| Bread improver | It is a flour-based blend of several components with specific functional properties designed to modify dough characteristics and give quality attributes to bread. |
| BSF | Black Soldier Fly |
| Caseinate | It is a substance produced by adding an alkali to acid casein, a derivative of casein. |
| Celiac disease | Celiac disease is an immune reaction to eating gluten, a protein found in wheat, barley, and rye. |
| Colostrum | It is a milky fluid that’s released by mammals that have recently given birth before breast milk production begins. |
| Concentrate | It is the least processed form of protein and has a protein content ranging from 40-90% by weight. |
| Dry protein basis | It refers to the percentage of "pure protein" present in a supplement after the water in it is completely removed through heat. |
| Dry whey | It is the product resulting from drying fresh whey which has been pasteurized and to which nothing has been added as a preservative. |
| Egg protein | It is a mixture of individual proteins, including ovalbumin, ovomucoid, ovoglobulin, conalbumin, vitellin, and vitellenin. |
| Emulsifier | It is a food additive that facilitates the blending of foods that are immiscible with one another, such as oil and water. |
| Enrichment | It is the process of addition of micronutrients that are lost during the processing of the product. |
| ERS | Economic Research Service of the USDA |
| Extrusion | It is the process of forcing soft mixed ingredients through an opening in a perforated plate or die designed to produce the required shape. The extruded food is then cut to a specific size by blades. |
| Fava | Also known as Faba, it is another word for yellow split beans. |
| FDA | Food and Drug Administration |
| Flaking | It is a process in which typically a cereal grain (like corn, wheat, or rice) is broken down into grits, cooked with flavors and syrups, and then pressed into flakes between cooled rollers. |
| Foaming agent | It is a food ingredient that makes it possible to form or maintain a uniform dispersion of a gaseous phase in a liquid or solid food. |
| Foodservice | It refers to the part of the food industry which includes businesses, institutions, and companies which prepare meals outside the home. It includes restaurants, school and hospital cafeterias, catering operations, and many other formats. |
| Fortification | It is the deliberate addition of micronutrients that are not found in them naturally or which are lost during processing, to improve a food product's nutritional value. |
| FSANZ | Food Standards Australia New Zealand |
| FSIS | Food Safety and Inspection Service |
| FSSAI | Food Safety and Standards Authority of India |
| Gelling agent | It is an ingredient that functions as a stabilizer and thickener to provide thickening without stiffness through the formation of gel. |
| GHG | Greenhouse Gas |
| Gluten | It is a family of proteins found in grains, including wheat, rye, spelt, and barley. |
| Hemp | It is a botanical class of Cannabis sativa cultivars grown specifically for industrial or medicinal use. |
| Hydrolysate | It is a form of protein manufactured by exposing the protein to enzymes that can partially break the bonds between the protein's amino acids and break down large, complicated proteins into smaller pieces. Its processing makes it easier and quicker to digest. |
| Hypoallergenic | It refers to a substance that causes fewer allergic reactions. |
| Isolate | It is the purest and most processed form of protein which has undergone separation to obtain a pure protein fraction. It typically contains ≥ 90% of protein by weight. |
| Keratin | It is a protein that helps form hair, nails, and the outer layer of skin. |
| Lactalbumin | It is the albumin contained in milk and obtained from whey. |
| Lactoferrin | It is an iron‑binding glycoprotein that is present in the milk of most mammals. |
| Lupin | It is the yellow legume seeds of the genus Lupinus. |
| Millenial | Also known as Generation Y or Gen Y, it refers to the people born from 1981 to 1996. |
| Monogastric | It refers to an animal with a single-compartmented stomach. Examples of monogastric include humans, poultry, pigs, horses, rabbits, dogs, and cats. Most monogastric are generally unable to digest much cellulose food materials such as grasses. |
| MPC | Milk protein concentrate |
| MPI | Milk protein isolate |
| MSPI | Methylated soy protein isolate |
| Mycoprotein | Mycoprotein is a form of single-cell protein, also known as fungal protein, derived from fungi for human consumption. |
| Nutricosmetics | It is a category of products and ingredients that act as nutritional supplements to care for skin, nails, and hair natural beauty. |
| Osteoporosis | It is a medical condition in which the bones become brittle and fragile from loss of tissue, typically as a result of hormonal changes, or deficiency of calcium or vitamin D. |
| PDCAAS | Protein digestibility-corrected amino acid score (PDCAAS) is a method of evaluating the quality of a protein based on both the amino acid requirements of humans and their ability to digest it. |
| Per-capita consumption of animal protein | It is the average amount of animal protein (such as milk, whey, gelatin, collagen, and egg proteins) that is readily available for consumption by each person in an actual population. |
| Per-capita consumption of plant protein | It is the average amount of plant protein (such as soy, wheat, pea, oat, and hemp proteins) that is readily available for consumption by each person in an actual population. |
| Quorn | It is a microbial protein manufactured using mycoprotein as an ingredient, in which the fungus culture is dried and mixed with egg albumen or potato protein, which acts as a binder, and then is adjusted in texture and pressed into various forms. |
| Ready-to-Cook (RTC) | It refers to food products that include all of the ingredients, where some preparation or cooking is required through a process that is given on the package. |
| Ready-to-Eat (RTE) | It refers to a food product prepared or cooked in advance, with no further cooking or preparation required before being eaten. |
| RTD | Ready-to-Drink |
| RTS | Ready-to-Serve |
| Saturated fat | It is a type of fat in which the fatty acid chains have all single bonds. It is generally considered unhealthy. |
| Sausage | It is a meat product made of finely chopped and seasoned meat, which may be fresh, smoked, or pickled and which is then usually stuffed into a casing. |
| Seitan | It is a plant-based meat substitute made out of wheat gluten. |
| Softgel | It is a gelatin-based capsule with a liquid fill. |
| SPC | Soy protein concentrate |
| SPI | Soy protein isolate |
| Spirulina | It is a biomass of cyanobacteria that can be consumed by humans and animals. |
| Stabilizer | It is an ingredient added to food products to help maintain or enhance their original texture, and physical and chemical characteristics. |
| Supplementation | It is the consumption or provision of concentrated sources of nutrients or other substances that are intended to supplement nutrients in the diet and is intended to correct nutritional deficiencies. |
| Texturant | It is a specific type of food ingredient that is used to control and alter the mouthfeel and texture of food and beverage products. |
| Thickener | It is an ingredient that is used to increase the viscosity of a liquid or dough and make it thicker, without substantially changing its other properties. |
| Trans fat | Also called trans-unsaturated fatty acids or trans fatty acids, it is a type of unsaturated fat that naturally occurs in small amounts in meat. |
| TSP | Textured soy protein |
| TVP | Textured vegetable protein |
| WPC | Whey protein concentrate |
| WPI | Whey protein isolate |


Research Methodology
Mordor Intelligence follows a four-step methodology in all our reports.
- Step-1: Identify Key Variables: The quantifiable key variables (industry and extraneous) pertaining to the specific product segment and country are selected from a group of relevant variables & factors based on desk research & literature review; along with primary expert inputs. These variables are further confirmed through regression modeling (wherever required).
- Step-2: Build a Market Model: In order to build a robust forecasting methodology, the variables and factors identified in Step-1 are tested against available historical market numbers. Through an iterative process, the variables required for market forecast are set and the model is built on the basis of these variables.
- Step-3: Validate and Finalize: In this important step, all market numbers, variables and analyst calls are validated through an extensive network of primary research experts from the market studied. The respondents are selected across levels and functions to generate a holistic picture of the market studied.
- Step-4: Research Outputs: Syndicated Reports, Custom Consulting Assignments, Databases & Subscription Platforms


