Market Overview
| Study Period | 2021 - 2031 |
|---|---|
| Forecast Data Period | 2026 - 2031 |
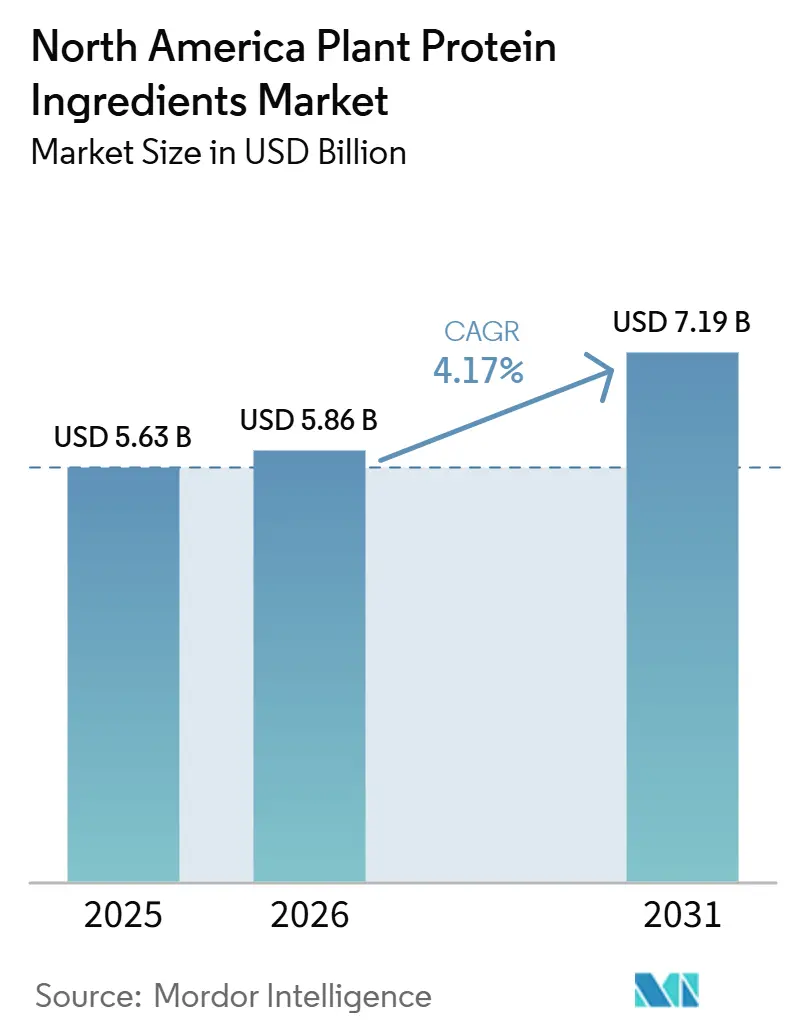
| Base Year Market Size (2025) | USD 5.63 Billion |
| Market Size (2026) | USD 5.86 Billion |
| Market Size (2031) | USD 7.19 Billion |
| Growth Rate (2026 - 2031) | 4.17% CAGR |
| Market Concentration | Medium |
Major Players
*Disclaimer: Major Players sorted in no particular order Image © Mordor Intelligence. Reuse requires attribution under CC BY 4.0. |
|
North America Plant Protein Ingredients Market Analysis by Mordor Intelligence
The North America Plant Protein Ingredients Market is valued at USD 5.63 billion in 2025, projected to reach USD 5.86 billion in 2026, and USD 7.19 billion by 2031, growing at a CAGR of 4.17% from 2026 to 2031. This growth indicates the market's progression from niche adoption to broader integration within the regional food and nutrition sector. The increasing recognition of plant proteins as functional, sustainable, and viable alternatives to animal-derived proteins is a key driver of this trend. Market growth is influenced by rising health and wellness awareness, with consumers placing greater emphasis on protein intake for muscle maintenance, satiety, and long-term health benefits. Additionally, the growing demand for clean-label, allergen-friendly, and dairy-free ingredients is prompting manufacturers to innovate and reformulate products using plant-based protein sources. These factors are sustaining demand across the value chain and contributing to consistent market expansion.
Key Report Takeaways
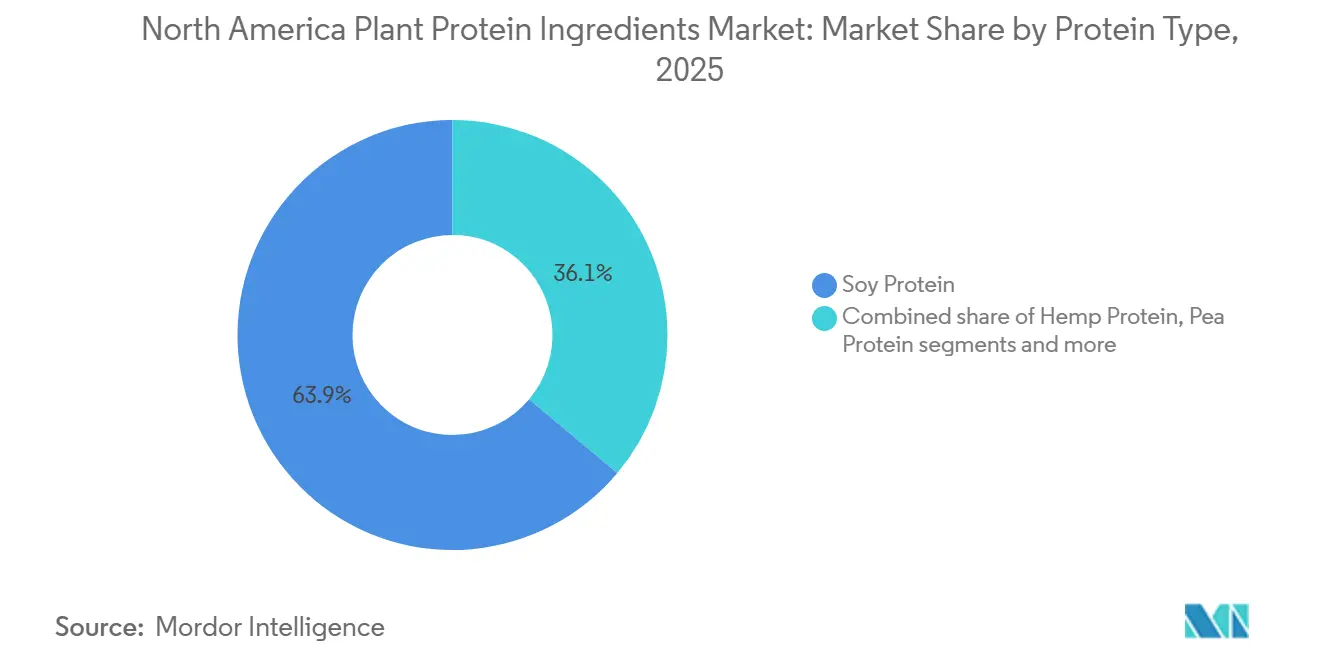
- By protein type, soy protein held a 63.91% revenue share in 2025; hemp protein is forecast to expand at a 5.43% CAGR through 2031.
- By category, conventional plant protein ingredients accounted for a 76.65% revenue share in 2025; the organic segment is projected to grow at a 6.54% CAGR through 2031.
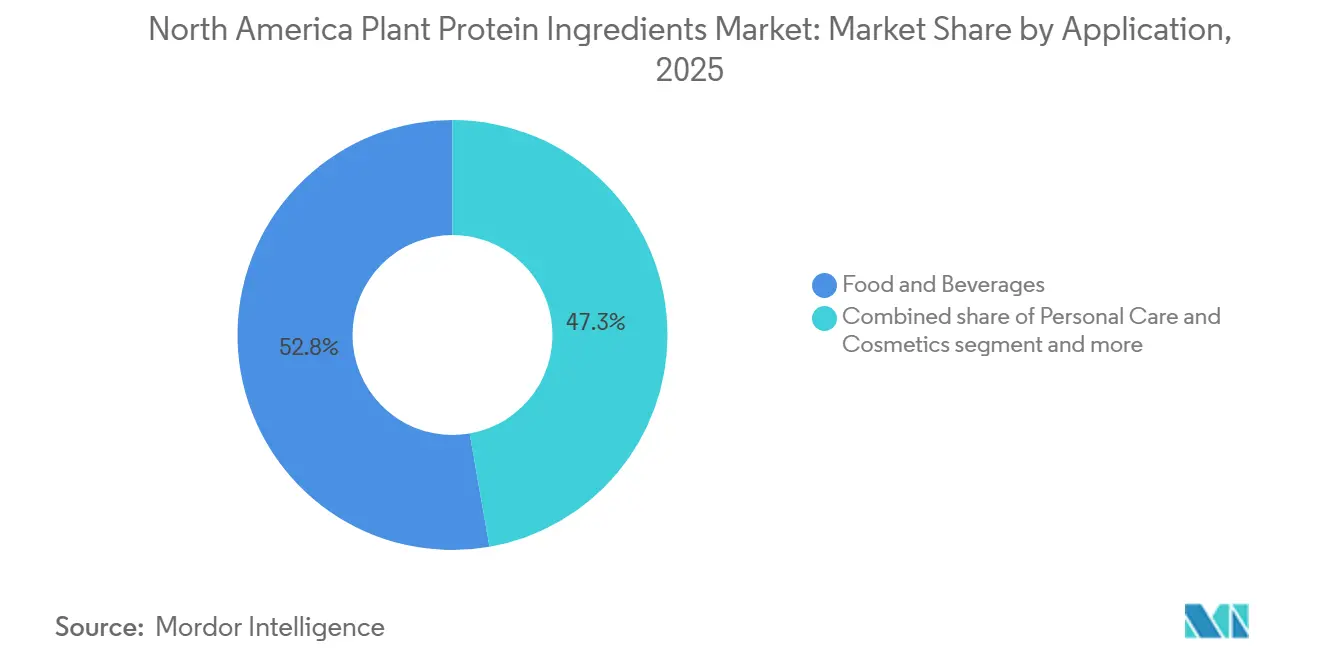
- By application, food and beverages represented a 52.75% share in 2025; supplements are expected to register the fastest growth at a 6.71% CAGR through 2031.
- By geography, the United States commanded an 82.73% share of the North America Plant Protein Ingredients Market in 2025; Mexico is anticipated to be the fastest-growing country, expanding at a 5.86% CAGR through 2031.
Note: Market size and forecast figures in this report are generated using Mordor Intelligence’s proprietary estimation framework, updated with the latest available data and insights as of January 2026.
North America Plant Protein Ingredients Market Trends and Insights
Drivers Impact Analysis*
| Driver | (~) % Impact on CAGR Forecast | Geographic Relevance | Impact Timeline |
|---|---|---|---|
| Allergen-friendly and alternative-to-dairy demand | +1.2% | United States, Canada | Medium term (2-4 years) |
| Sports nutrition and active lifestyle trends | +0.9% | United States, Mexico | Short term (≤ 2 years) |
| Sustainability and environmental concerns | +0.8% | North America (broad) | Long term (≥ 4 years) |
| Advances in processing and texturization technologies | +0.7% | United States, Canada | Medium term (2-4 years) |
| Clean-label and natural ingredient preference | +0.6% | United States, Canada | Short term (≤ 2 years) |
| Expansion in functional foods and beverages | +0.5% | United States, Mexico, Canada | Medium term (2-4 years) |
| Source: Mordor Intelligence | |||
Allergen-friendly and alternative-to-dairy demand
Demand for allergen-friendly and dairy-free alternatives is a significant driver of the North American plant protein ingredients market. Consumers are increasingly seeking protein sources that avoid common allergens such as milk, eggs, and lactose. Plant proteins, including pea, rice, hemp, and others, are widely recognized as hypoallergenic and dairy-free options, making them appealing to individuals with food sensitivities and to brands promoting inclusive nutrition. This trend is further supported by the rising prevalence of food allergies in the region. According to the Centers for Disease Control and Prevention (CDC), in 2024, approximately 7% of adults and 5% of children in the United States were affected by at least one food allergy [1]Source: Centers for Disease Control and Prevention (CDC), "Almost a Third of U.S. Adults and Children Have at Least One Allergy", cdc.gov. This growing incidence has heightened manufacturer interest in plant protein ingredients that support allergen-free labeling, dairy substitution, and expanded consumer accessibility, thereby driving market growth.
Sports nutrition and active lifestyle trends
Sports nutrition and active lifestyles are driving the growth of the North America plant protein ingredients market, as fitness-conscious consumers increasingly prioritize high-protein, clean-label, and plant-based nutrition options. Plant proteins are becoming more popular among athletes and recreationally active individuals due to their compatibility with vegan, flexitarian, and dairy-free diets, as well as their perceived benefits of easier digestion and reduced gastrointestinal discomfort compared to certain animal proteins. The rising interest in strength training, endurance sports, and wellness-focused lifestyles has further boosted the demand for plant-based protein products designed for muscle recovery, sustained energy, and overall performance. Additionally, advancements in amino acid balancing, solubility, and flavor masking technologies have strengthened the position of plant proteins as viable alternatives to whey, supporting their growing adoption within the sports nutrition market and driving sustained growth.
Sustainability and environmental concerns
Sustainability and environmental concerns are increasingly influencing food manufacturers and consumers to prioritize ingredients with lower environmental impacts. Plant proteins are widely recognized as more sustainable than animal-derived proteins due to their significantly lower land use, water consumption, and greenhouse gas emissions across the value chain. This growing preference is further reinforced by corporate sustainability commitments from major agribusiness companies. For instance, Cargill, Incorporated has set an ambitious goal to promote regenerative agriculture practices across 10 million acres of North American agricultural land by 2030. This initiative underscores industry-wide efforts to improve soil health, enhance biodiversity, and ensure long-term crop resilience. Such proactive measures strengthen the sustainability credentials of plant protein supply chains, fostering greater adoption by ingredient manufacturers and downstream food producers aiming to meet environmental and consumer expectations.
Advances in processing and texturization technologies
Advancements in processing and texturization technologies are driving growth in the North America plant protein ingredients market by enhancing the functionality, sensory attributes, and application range of plant-based proteins. Techniques such as high-moisture extrusion, shear-cell processing, precision fractionation, and enzymatic modification have improved protein solubility, water-binding capacity, and fiber-like texture, enabling closer mimicry of animal-protein properties. These innovations also mitigate off-flavors and variability in raw plant materials, leading to greater formulation consistency and improved consumer acceptance. As processing efficiency and product performance advance, manufacturers are increasingly able to incorporate plant protein ingredients into a broader range of formulations at a commercial scale, solidifying their position as competitive protein alternatives in the North American market.
Restraints Impact Analysis*
| Restraint | (~) % Impact on CAGR Forecast | Geographic Relevance | Impact Timeline |
|---|---|---|---|
| Taste and flavor challenges | -0.6% | United States, Canada, Mexico | Short term (≤ 2 years) |
| Higher production and processing costs | -0.5% | United States, Canada | Medium term (2-4 years) |
| Supply chain disruptions and dependency on raw material | -0.4% | United States, Canada | Short term (≤ 2 years) |
| Stringent regulatory requirements | -0.3% | United States, Canada, Mexico | Long term (≥ 4 years) |
| Source: Mordor Intelligence | |||
Taste and flavor challenges
Taste and flavor challenges remain a significant restraint in the North America plant protein ingredients market. Beany, grassy, and bitter notes, inherent to pea, soy, and hemp proteins, continue to limit broader consumer acceptance. These off-flavors are particularly problematic in neutral-pH and lightly flavored products, where there are fewer opportunities to mask undesirable sensory characteristics effectively. Despite advancements in processing techniques and flavor-masking technologies, residual bitterness and vegetal notes persist, negatively impacting mouthfeel and aftertaste. This often leads to reduced consumer satisfaction and lower repeat purchase rates. As a result, taste and flavor limitations continue to pose a critical barrier to the wider adoption of plant protein ingredients, particularly in clean-label, minimally sweetened, and health-focused product formulations.
Higher production and processing costs
Higher production and processing costs serve as a significant restraint in the North America plant protein ingredients market. These costs are driven by the complexity of processes such as protein extraction, isolation, and refinement. Advanced methods, including wet fractionation, enzymatic treatment, and high-moisture extrusion, require considerable capital investment, energy consumption, and technical expertise, leading to higher manufacturing costs compared to traditional protein sources. Additionally, achieving improved taste, functionality, and consistency often involves multiple processing steps, further increasing expenses. These elevated costs can reduce price competitiveness and hinder adoption, particularly for emerging and specialty plant protein ingredients, thereby limiting broader market penetration.
*Our forecasts treat driver/restraint impacts as directional, not additive. The impact forecasts reflect baseline growth, mix effects, and variable interactions.
Segment Analysis
By Protein Type: Hemp Leads Growth Amid Soy Dominance
Soy protein is projected to dominate the North America plant protein ingredients market, holding a 63.91% share in 2025. This dominance is attributed to its strong supply availability, established processing infrastructure, and versatile functionality across food and beverage applications. Soy protein remains the most commercially mature plant protein in the region, widely utilized in meat analogues, bakery products, snacks, beverages, and sports nutrition due to its high protein content, complete amino acid profile, and cost-efficient scalability. Its leading position is further supported by robust domestic soybean production, ensuring consistent raw material availability and supply chain stability. For example, according to the United States Department of Agriculture (USDA), soybean production in the United States reached 119.04 million metric tons in 2024/2025, up from 113.27 million metric tons in 2023/2024, underscoring strong agricultural output that supports soy protein ingredient manufacturing [2]Source: United States Department of Agriculture (USDA), "Production of soybeans in the United States", usda.gov.
Hemp protein is expected to grow at a CAGR of 5.43% through 2031, marking the fastest growth among all plant protein types in North America. This growth is driven by increasing consumer demand for clean-label, minimally processed, and nutritionally dense proteins. Hemp protein offers a favorable combination of plant-based protein, dietary fiber, omega-3 and omega-6 fatty acids, and essential micronutrients. Additionally, hemp protein is naturally free from major allergens, making it an appealing choice for allergen-friendly formulations. Advances in milling and cold-processing technologies have further enhanced hemp protein’s taste, solubility, and functionality, enabling its broader application across mainstream food and beverage categories.


By Category: Organic Gains as Premiumization Accelerates
Conventional plant proteins accounted for 76.65% of the North American plant protein ingredients market in 2025, highlighting their widespread adoption across the region. This dominance is attributed to the strong availability of conventional crops, well-established agricultural and processing infrastructure, and consistent quality and performance characteristics that support large-scale ingredient production. These proteins benefit from higher yields, standardized extraction processes, and a dependable year-round supply, enabling manufacturers to efficiently meet high-volume demand. Furthermore, advancements in processing technologies have improved the functionality, taste, and versatility of conventional plant proteins, solidifying their preference among ingredient suppliers and food manufacturers.
Organic plant protein variants are projected to grow at a CAGR of 6.54% through 2031 in the North America plant protein ingredients market, making them the fastest-growing category. This growth is driven by increasing consumer demand for clean-label, non-GMO, and organically certified ingredients, coupled with heightened awareness of sustainable farming practices and reduced chemical inputs. Organic proteins are perceived as purer, more traceable, and environmentally responsible, aligning with evolving consumer values and brand strategies. Additionally, improvements in organic crop yields, certification processes, and supply chain transparency are enhancing the reliability and consistency of organic protein sourcing.
By Application: Supplements Surge as Food and Beverages Mature
Food and beverage applications accounted for 52.75% of North America's plant protein ingredients demand in 2025, underscoring their significant role in driving overall market consumption. This substantial share is attributed to the widespread integration of plant proteins into everyday food systems. Manufacturers are increasingly focusing on protein fortification, reformulation, and nutritional enhancement of mainstream products. The growing consumer preference for plant-forward diets, clean-label products, and protein-rich formulations has encouraged food and beverage brands to use plant proteins as essential functional and nutritional components rather than as niche additions. Furthermore, advancements in flavor-masking, solubility, and texturization technologies have enhanced the sensory attributes of plant proteins, facilitating their broader acceptance in conventional food and beverage formulations.
Supplements are projected to grow at a CAGR of 6.71% through 2031, making them the fastest-growing application segment in the North America plant protein ingredients market. This growth is driven by increasing consumer focus on preventive health, fitness, and personalized nutrition, along with the rising acceptance of plant-based proteins as viable alternatives to animal-derived sources. Plant proteins are gaining popularity in supplements due to their perceived digestibility, allergen-friendly properties, and compatibility with vegan and clean-label preferences. Additionally, advancements in protein isolates, hydrolysates, and flavor-masking technologies have improved taste, mixability, and bioavailability, enhancing consumer satisfaction and repeat usage. The growing influence of sports nutrition, the aging population's focus on muscle maintenance, and lifestyle-driven supplementation trends continue to support strong demand growth for plant-protein-based products.
Geography Analysis
In 2025, the United States accounted for 82.73% of the North America plant protein ingredients market, underscoring its significant role in the regional protein supply chain. This dominance is attributed to the high concentration of oilseed crushing facilities in the Midwest, supported by extensive soybean cultivation and integrated processing systems. The country also benefits from a well-established extrusion and texturization infrastructure, enabling efficient production of protein isolates, concentrates, and texturized proteins on a commercial scale. Additionally, a regulatory framework that allows qualified health claims fosters innovation and facilitates market adoption of plant protein ingredients, further solidifying the United States' leadership position.
Mexico is anticipated to grow at a CAGR of 5.86% through 2031, making it the fastest-growing market in the North America plant protein ingredients industry. This growth is driven by the nearshoring of food-processing and ingredient manufacturing operations, as global and regional companies expand their presence. market. Rising middle-class incomes and increasing consumer interest in nutrient-dense and fortified food products are further boosting demand for plant protein ingredients. Enhancements in domestic processing capabilities and cross-border supply chain integration continue to position Mexico as an attractive growth hub.
Canada is steadily advancing in the plant protein ingredients market, supported by shifting dietary preferences and robust agricultural capabilities. A growing trend toward plant-based nutrition is evident across various age groups, reinforcing long-term demand. For example, according to the Canadian Community Health Survey (CCHS), in 2025, approximately 36% of daily protein intake among Canadian children aged 9 to 18 came from plant sources, indicating increasing acceptance of plant proteins from an early age [3]Source: Canadian Community Health Survey (CCHS), "The Impact of Protein Source on Nutrient Intake in Canadian Children", statcan.gc.ca. This trend, combined with Canada’s strength in pulse and oilseed production, continues to enhance its position within the regional plant protein ingredients market.

Competitive Landscape
The North America plant protein ingredients market is moderately concentrated, with a combination of large agribusiness corporations and specialized ingredient companies shaping the competitive environment. Key players in the market include Archer Daniels Midland Company, Bunge Global SA, Cargill, Incorporated, Glanbia PLC, and Ingredion Incorporated. These companies leverage strong financial positions, extensive global sourcing networks, and established customer relationships to serve both large-scale food manufacturers and specialized nutrition brands across the region.
Vertical integration remains the primary competitive strategy in the market. Ownership of assets across crushing, refining, and downstream ingredient processing enables companies to capture value throughout the supply chain. Integrated operations, which include oilseed procurement, protein extraction, fractionation, and ingredient sales, provide cost efficiencies, ensure supply reliability, and enhance quality control. This structure also facilitates the rapid scaling of new protein formats and functional variants, giving established players a competitive edge over smaller, less-integrated competitors.
White-space opportunities are emerging beyond traditional soy and pea proteins, fostering innovation-driven competition. Key areas of growth include fermentation-derived proteins, enzymatic hydrolysis to enhance flavor and digestibility, and novel protein sources such as duckweed and algae. These alternatives reduce reliance on conventional agricultural land and seasonal crop cycles. Startups and strategic partnerships are increasingly investing in these technologies, signaling a gradual shift toward diversification and next-generation protein platforms within the otherwise consolidated market landscape.
North America Plant Protein Ingredients Industry Leaders
-
Archer Daniels Midland Company
-
Bunge Global SA
-
Cargill, Incorporated
-
Glanbia PLC
-
Ingredion Incorporated
- *Disclaimer: Major Players sorted in no particular order

Recent Industry Developments
- May 2025: Bunge has invested EUR 484 million in a soy protein facility located in Morristown, Indiana. The new facility will process an additional 4.5 million bushels of soybeans annually.
- February 2025: Nepra Foods has introduced a high-performance hemp protein tailored for egg-free baking. This innovative product delivers complete protein, allergen-free benefits, enhanced sustainability, and serves as a reliable egg replacement.
- January 2025: Axiom Foods has introduced Vegotein N Neutral, a pea protein ingredient, to meet the increasing demand for pea protein in the market. The product features an 80% protein concentration and is fully digestible. It is derived from yellow non-GMO peas cultivated in North America.


North America Plant Protein Ingredients Market Report Scope
Plant protein is protein derived from plants, found in sources like legumes, nuts, seeds, grains, and soy products, serving as a vital nutrient for body functions. The North America plant protein market is segmented by protein type, category, application, and geography. By protein type, the market is segmented into hemp protein, pea protein, potato protein, rice protein, soy protein, wheat protein, and more. By category, the market is segmented into conventional and organic. By application, the market is segmented into animal feed, food and beverages, personal care and cosmetics, and supplements. By geography, the market is segmented into the United States, Canada, Mexico, and the rest of North America. The Market Forecasts are Provided in Terms of Value (USD) and Volume (Tons).
By Protein Type
| Hemp Protein |
| Pea Protein |
| Potato Protein |
| Rice Protein |
| Soy Protein |
| Wheat Protein |
| Other Plant Proteins |
By Category
| Conventional |
| Organic |
By Application
| Animal Feed | |
| Food and Beverages | Bakery |
| Beverages | |
| Breakfast Cereals | |
| Condiments/Sauces | |
| Confectionery | |
| Dairy and Dairy Alternatives Products | |
| RTE/RTC Food Products | |
| Others | |
| Personal Care and Cosmetics | |
| Supplements |
By Geography
| United States |
| Canada |
| Mexico |
| Rest of North America |
| By Protein Type | Hemp Protein | |
| Pea Protein | ||
| Potato Protein | ||
| Rice Protein | ||
| Soy Protein | ||
| Wheat Protein | ||
| Other Plant Proteins | ||
| By Category | Conventional | |
| Organic | ||
| By Application | Animal Feed | |
| Food and Beverages | Bakery | |
| Beverages | ||
| Breakfast Cereals | ||
| Condiments/Sauces | ||
| Confectionery | ||
| Dairy and Dairy Alternatives Products | ||
| RTE/RTC Food Products | ||
| Others | ||
| Personal Care and Cosmetics | ||
| Supplements | ||
| By Geography | United States | |
| Canada | ||
| Mexico | ||
| Rest of North America | ||


Market Definition
- End User - The Protein Ingredients Market operates on a B2B basis. Food, Beverages, Supplements, Animal Feed, and Personal Care & Cosmetic manufacturers are considered to be end-consumers in the market studied. The scope excludes manufacturers buying liquid/dry whey to be used for application as a binding agent or thickener or other non-protein applications.
- Penetration Rate - Penetration Rate is defined as the percentage of Protein-Fortified End User Market Volume in the Overall End User Market Volume.
- Average Protein Content - Average protein content is the average protein content present per 100 g of product manufactured by all end-user companies considered under the scope of this report.
- End User Market Volume - End-user market volume is the consolidated volume of all types and forms of end-user products in the country or region.
| Keyword | Definition |
|---|---|
| Alpha-lactalbumin (α-Lactalbumin) | It is a protein that regulates the production of lactose in the milk of almost all mammalian species. |
| Amino acid | It is an organic compound that contains both amino and carboxylic acid functional groups, which are required for the synthesis of body protein and other important nitrogen-containing compounds, such as creatine, peptide hormones, and some neurotransmitters. |
| Blanching | It is the process of briefly heating vegetables with steam or boiling water. |
| BRC | British Retail Consortium |
| Bread improver | It is a flour-based blend of several components with specific functional properties designed to modify dough characteristics and give quality attributes to bread. |
| BSF | Black Soldier Fly |
| Caseinate | It is a substance produced by adding an alkali to acid casein, a derivative of casein. |
| Celiac disease | Celiac disease is an immune reaction to eating gluten, a protein found in wheat, barley, and rye. |
| Colostrum | It is a milky fluid that’s released by mammals that have recently given birth before breast milk production begins. |
| Concentrate | It is the least processed form of protein and has a protein content ranging from 40-90% by weight. |
| Dry protein basis | It refers to the percentage of "pure protein" present in a supplement after the water in it is completely removed through heat. |
| Dry whey | It is the product resulting from drying fresh whey which has been pasteurized and to which nothing has been added as a preservative. |
| Egg protein | It is a mixture of individual proteins, including ovalbumin, ovomucoid, ovoglobulin, conalbumin, vitellin, and vitellenin. |
| Emulsifier | It is a food additive that facilitates the blending of foods that are immiscible with one another, such as oil and water. |
| Enrichment | It is the process of addition of micronutrients that are lost during the processing of the product. |
| ERS | Economic Research Service of the USDA |
| Extrusion | It is the process of forcing soft mixed ingredients through an opening in a perforated plate or die designed to produce the required shape. The extruded food is then cut to a specific size by blades. |
| Fava | Also known as Faba, it is another word for yellow split beans. |
| FDA | Food and Drug Administration |
| Flaking | It is a process in which typically a cereal grain (like corn, wheat, or rice) is broken down into grits, cooked with flavors and syrups, and then pressed into flakes between cooled rollers. |
| Foaming agent | It is a food ingredient that makes it possible to form or maintain a uniform dispersion of a gaseous phase in a liquid or solid food. |
| Foodservice | It refers to the part of the food industry which includes businesses, institutions, and companies which prepare meals outside the home. It includes restaurants, school and hospital cafeterias, catering operations, and many other formats. |
| Fortification | It is the deliberate addition of micronutrients that are not found in them naturally or which are lost during processing, to improve a food product's nutritional value. |
| FSANZ | Food Standards Australia New Zealand |
| FSIS | Food Safety and Inspection Service |
| FSSAI | Food Safety and Standards Authority of India |
| Gelling agent | It is an ingredient that functions as a stabilizer and thickener to provide thickening without stiffness through the formation of gel. |
| GHG | Greenhouse Gas |
| Gluten | It is a family of proteins found in grains, including wheat, rye, spelt, and barley. |
| Hemp | It is a botanical class of Cannabis sativa cultivars grown specifically for industrial or medicinal use. |
| Hydrolysate | It is a form of protein manufactured by exposing the protein to enzymes that can partially break the bonds between the protein's amino acids and break down large, complicated proteins into smaller pieces. Its processing makes it easier and quicker to digest. |
| Hypoallergenic | It refers to a substance that causes fewer allergic reactions. |
| Isolate | It is the purest and most processed form of protein which has undergone separation to obtain a pure protein fraction. It typically contains ≥ 90% of protein by weight. |
| Keratin | It is a protein that helps form hair, nails, and the outer layer of skin. |
| Lactalbumin | It is the albumin contained in milk and obtained from whey. |
| Lactoferrin | It is an iron‑binding glycoprotein that is present in the milk of most mammals. |
| Lupin | It is the yellow legume seeds of the genus Lupinus. |
| Millenial | Also known as Generation Y or Gen Y, it refers to the people born from 1981 to 1996. |
| Monogastric | It refers to an animal with a single-compartmented stomach. Examples of monogastric include humans, poultry, pigs, horses, rabbits, dogs, and cats. Most monogastric are generally unable to digest much cellulose food materials such as grasses. |
| MPC | Milk protein concentrate |
| MPI | Milk protein isolate |
| MSPI | Methylated soy protein isolate |
| Mycoprotein | Mycoprotein is a form of single-cell protein, also known as fungal protein, derived from fungi for human consumption. |
| Nutricosmetics | It is a category of products and ingredients that act as nutritional supplements to care for skin, nails, and hair natural beauty. |
| Osteoporosis | It is a medical condition in which the bones become brittle and fragile from loss of tissue, typically as a result of hormonal changes, or deficiency of calcium or vitamin D. |
| PDCAAS | Protein digestibility-corrected amino acid score (PDCAAS) is a method of evaluating the quality of a protein based on both the amino acid requirements of humans and their ability to digest it. |
| Per-capita consumption of animal protein | It is the average amount of animal protein (such as milk, whey, gelatin, collagen, and egg proteins) that is readily available for consumption by each person in an actual population. |
| Per-capita consumption of plant protein | It is the average amount of plant protein (such as soy, wheat, pea, oat, and hemp proteins) that is readily available for consumption by each person in an actual population. |
| Quorn | It is a microbial protein manufactured using mycoprotein as an ingredient, in which the fungus culture is dried and mixed with egg albumen or potato protein, which acts as a binder, and then is adjusted in texture and pressed into various forms. |
| Ready-to-Cook (RTC) | It refers to food products that include all of the ingredients, where some preparation or cooking is required through a process that is given on the package. |
| Ready-to-Eat (RTE) | It refers to a food product prepared or cooked in advance, with no further cooking or preparation required before being eaten. |
| RTD | Ready-to-Drink |
| RTS | Ready-to-Serve |
| Saturated fat | It is a type of fat in which the fatty acid chains have all single bonds. It is generally considered unhealthy. |
| Sausage | It is a meat product made of finely chopped and seasoned meat, which may be fresh, smoked, or pickled and which is then usually stuffed into a casing. |
| Seitan | It is a plant-based meat substitute made out of wheat gluten. |
| Softgel | It is a gelatin-based capsule with a liquid fill. |
| SPC | Soy protein concentrate |
| SPI | Soy protein isolate |
| Spirulina | It is a biomass of cyanobacteria that can be consumed by humans and animals. |
| Stabilizer | It is an ingredient added to food products to help maintain or enhance their original texture, and physical and chemical characteristics. |
| Supplementation | It is the consumption or provision of concentrated sources of nutrients or other substances that are intended to supplement nutrients in the diet and is intended to correct nutritional deficiencies. |
| Texturant | It is a specific type of food ingredient that is used to control and alter the mouthfeel and texture of food and beverage products. |
| Thickener | It is an ingredient that is used to increase the viscosity of a liquid or dough and make it thicker, without substantially changing its other properties. |
| Trans fat | Also called trans-unsaturated fatty acids or trans fatty acids, it is a type of unsaturated fat that naturally occurs in small amounts in meat. |
| TSP | Textured soy protein |
| TVP | Textured vegetable protein |
| WPC | Whey protein concentrate |
| WPI | Whey protein isolate |


Research Methodology
Mordor Intelligence follows a four-step methodology in all our reports.
- Step-1: Identify Key Variables: The quantifiable key variables (industry and extraneous) pertaining to the specific product segment and country are selected from a group of relevant variables & factors based on desk research & literature review; along with primary expert inputs. These variables are further confirmed through regression modeling (wherever required).
- Step-2: Build a Market Model: In order to build a robust forecasting methodology, the variables and factors identified in Step-1 are tested against available historical market numbers. Through an iterative process, the variables required for market forecast are set and the model is built on the basis of these variables.
- Step-3: Validate and Finalize: In this important step, all market numbers, variables and analyst calls are validated through an extensive network of primary research experts from the market studied. The respondents are selected across levels and functions to generate a holistic picture of the market studied.
- Step-4: Research Outputs: Syndicated Reports, Custom Consulting Assignments, Databases & Subscription Platforms


