Market Overview
| Study Period | 2021 - 2031 |
|---|---|
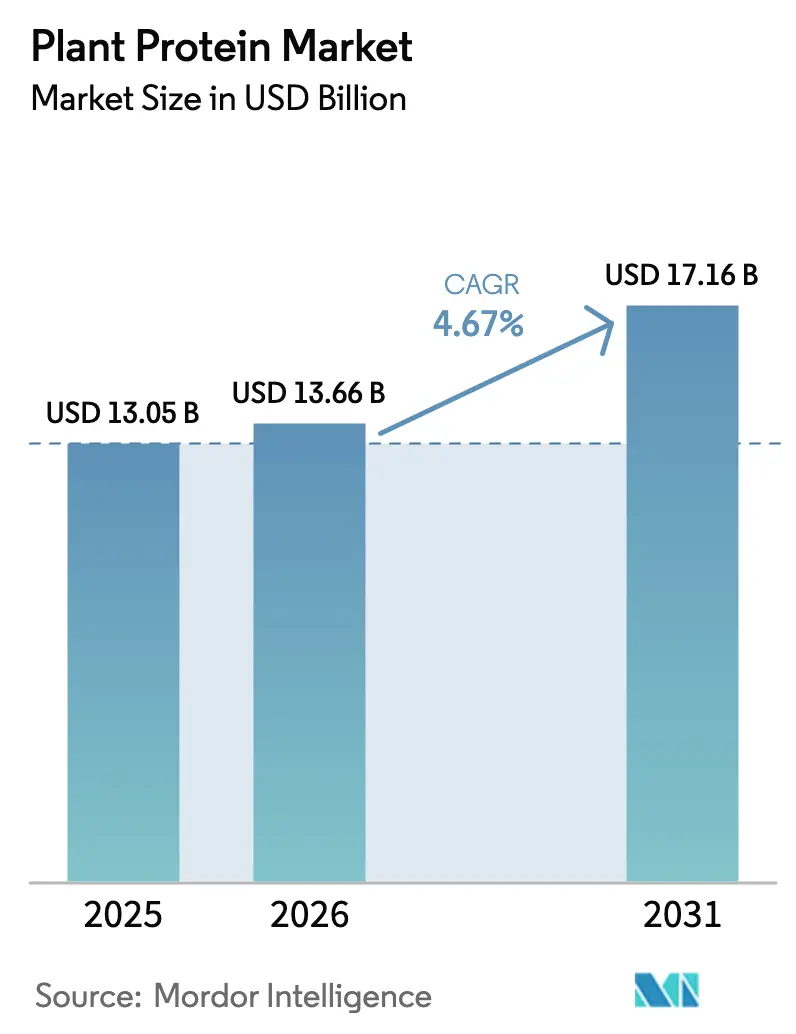
| Market Size (2026) | USD 13.66 Billion |
| Market Size (2031) | USD 17.16 Billion |
| Growth Rate (2026 - 2031) | 4.67% CAGR |
| Fastest Growing Market | Asia Pacific |
| Largest Market | Asia Pacific |
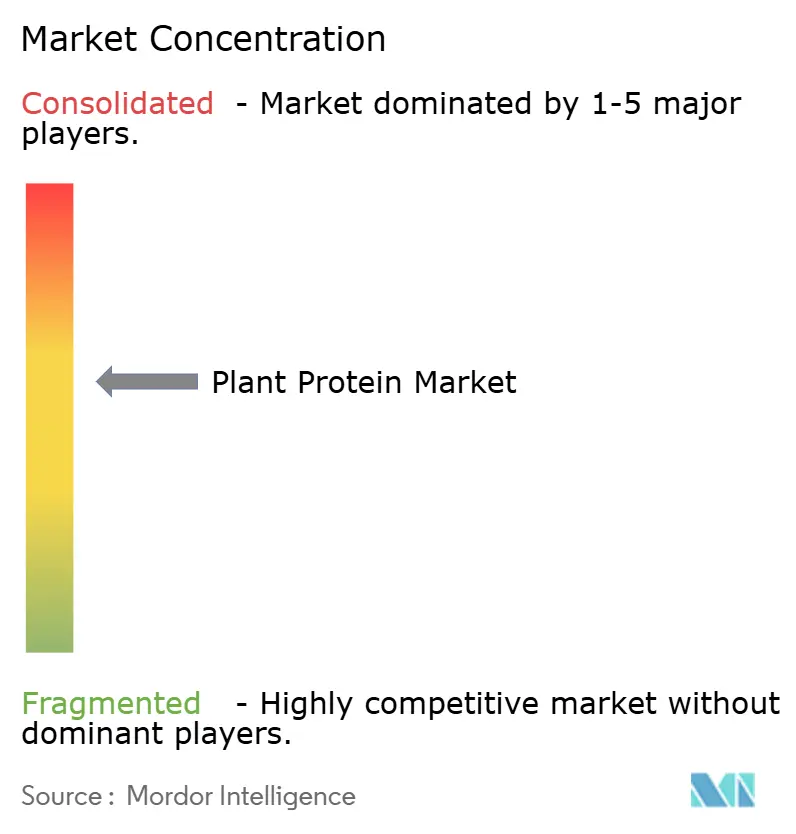
| Market Concentration | Medium |
Major Players
*Disclaimer: Major Players sorted in no particular order Image © Mordor Intelligence. Reuse requires attribution under CC BY 4.0. |
|
Plant Protein Market Analysis by Mordor Intelligence
The plant protein market size was valued at USD 13.05 billion in 2025 and estimated to grow from USD 13.66 billion in 2026 to reach USD 17.16 billion by 2031, at a CAGR of 4.67% during the forecast period (2026-2031). Demand momentum is driven by institutional recognition of pulses as primary protein sources, steady flexitarian adoption, and technological breakthroughs that expand the ingredient palette. Manufacturers are pivoting from soy and pea dominance toward hemp, rice, potato, and duckweed proteins to hedge commodity risk and meet allergen-management requirements. Regulatory bodies in the United States and the European Union have accelerated novel-food approvals, shortening commercialization cycles for innovative sources while tightening labeling rules for protein quality. Consolidation among crop processors, epitomized by Bunge’s acquisition of Viterra, raises entry barriers and reinforces the need for co-manufacturing alliances. At the same time, precision-fermentation startups are eroding incumbents’ advantages by supplying animal-identical proteins without agricultural inputs. Commodity price swings and lingering sensory gaps remain restraints, yet cost-down engineering, flavor-masking systems, and high-moisture extrusion steadily narrow the parity gap with animal proteins.
Key Report Takeaways
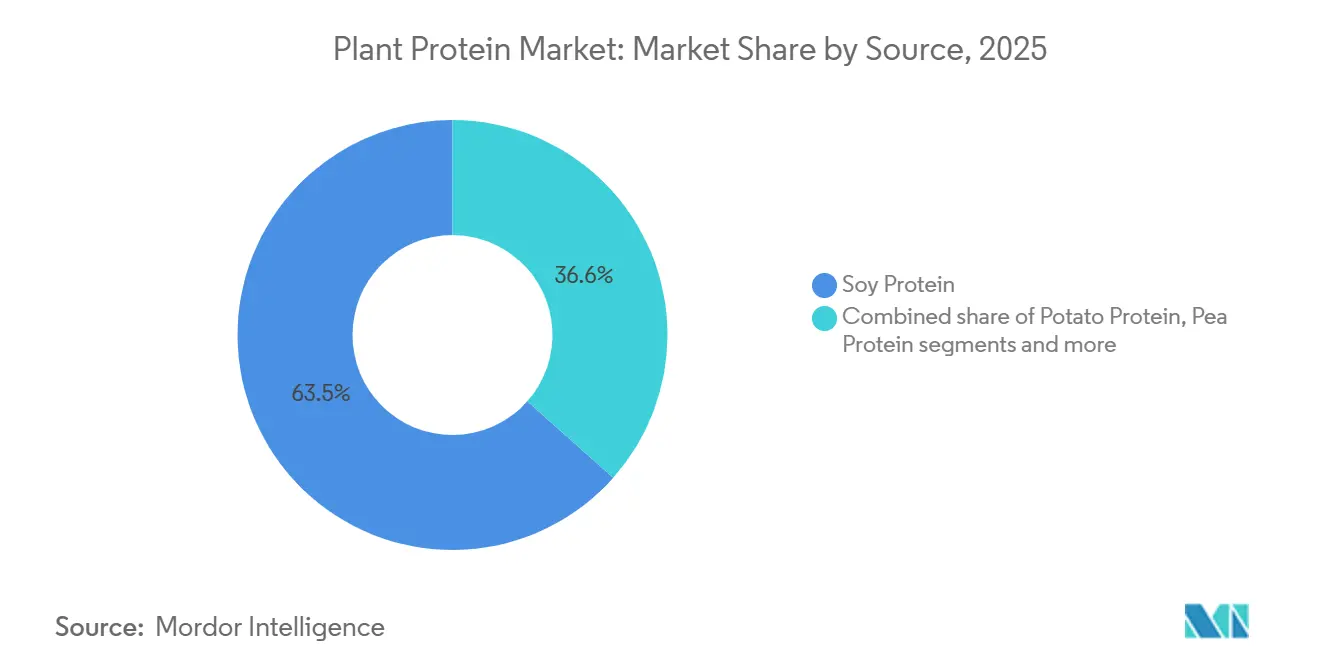
- By protein type, soy protein led with 63.45% revenue share in 2025, while pea protein is projected to climb at a 6.36% CAGR through 2031.
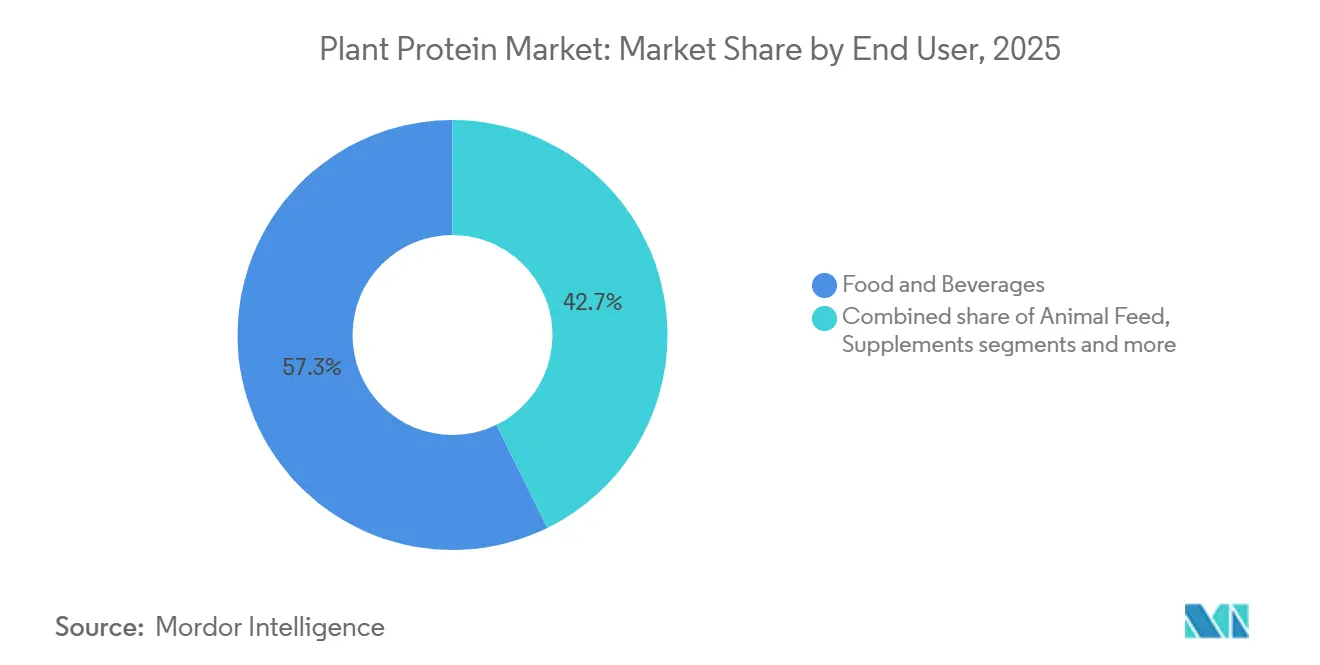
- By end user, food and beverages held 57.26% of the 2025 demand, whereas the supplements segment is advancing at a 6.12% CAGR to 2031.
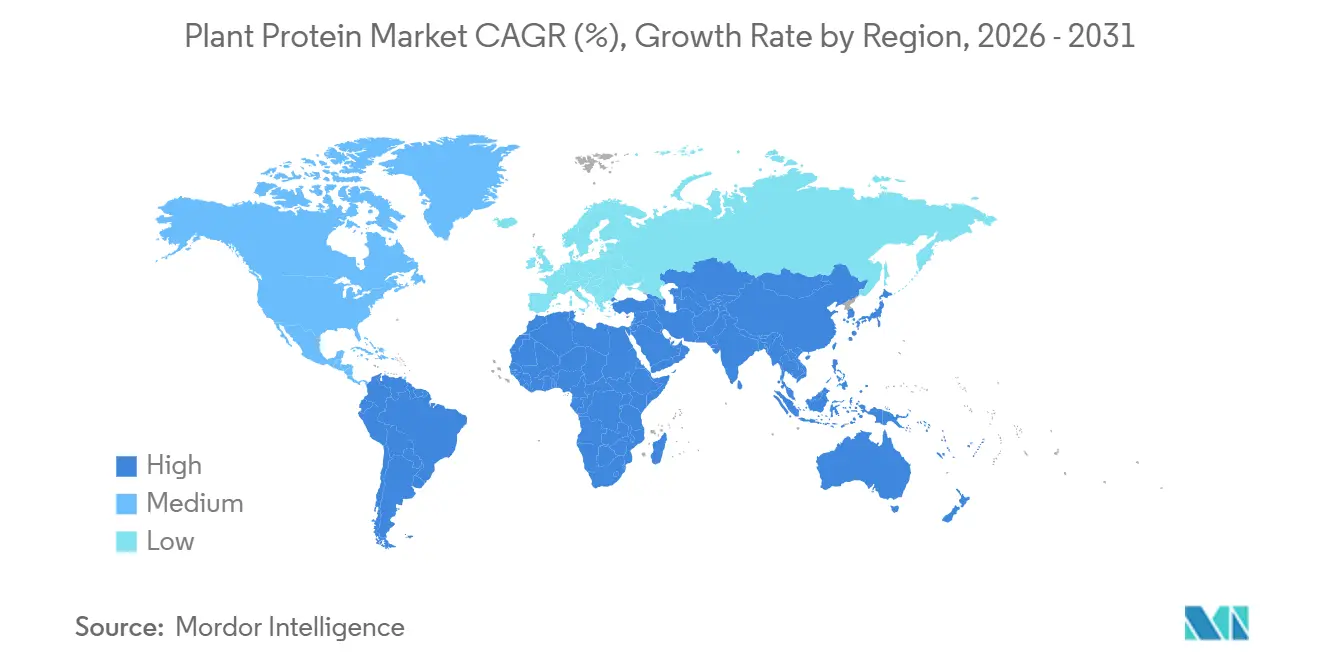
- By geography, Asia-Pacific captured 36.41% of the plant protein market share in 2025 and is forecast to expand at a 5.62% CAGR through 2031.
Note: Market size and forecast figures in this report are generated using Mordor Intelligence’s proprietary estimation framework, updated with the latest available data and insights as of January 2026.
Global Plant Protein Market Trends and Insights
Drivers Impact Analysis*
| Driver | (~) % Impact on CAGR Forecast | Geographic Relevance | Impact Timeline |
|---|---|---|---|
| Growth of plant-based and flexitarian diets | +1.2% | Global, with highest penetration in North America and Western Europe | Medium term (2-4 years) |
| Rising demand for lactose-free protein alternatives | +0.9% | North America, Europe, Asia-Pacific urban centers | Short term (≤ 2 years) |
| Consumer preferences for clean-label and digestible products | +0.8% | North America and European Union, expanding to Asia-Pacific premium segments | Medium term (2-4 years) |
| Product innovations in protein sources | +1.0% | Global, led by North America and Europe, research and development hubs | Long term (≥ 4 years) |
| Ethical and environmental sustainability | +0.7% | Europe, North America, Australia; emerging in urban Asia | Long term (≥ 4 years) |
| Technological innovations in protein development | +0.9% | Global, concentrated in North America and Europe | Long term (≥ 4 years) |
| Source: Mordor Intelligence | |||


Growth of plant‑based and flexitarian diets
The increasing adoption of plant-based and flexitarian diets is significantly influencing consumer behavior, broadening the appeal of plant proteins beyond strict vegan demographics to include mainstream consumers seeking partial or occasional alternatives to animal products. This shift is closely tied to health and wellness priorities, with a growing emphasis on protein quality, digestive comfort, and reduced saturated fat intake. A report by Good Food Institute Europe indicates that by 2025, 51% of adults in the United Kingdom and Germany plan to modify their diets by either increasing plant-based food consumption or reducing animal meat and dairy intake, with approximately 20% intending to do both [1]Source: Good Food Institute Europe (GFI Europe), "Research: Four in 10 German and UK Adults Plan to Eat More Plant-based Food," gfieurope.org. Ethical and environmental concerns, such as the climate impact, land use, and water consumption associated with livestock production, further drive this trend, positioning plant proteins as a sustainable alternative. Flexitarians are adopting these proteins to reduce Scope 3 emissions without fully eliminating animal products, aligning with corporate sustainability initiatives that encourage large consumer packaged goods (CPG) companies to incorporate plant proteins. Technological advancements, including extrusion and enzymatic modification, have enhanced the ability of plant proteins to replicate meat and dairy textures, addressing sensory barriers and increasing their appeal in hybrid products. Clean-label demand supports the use of recognizable ingredients like Roquette's NUTRALYS pea protein, which offers functionality without artificial additives. Product innovation, such as high-protein bakery items and ready-to-drink beverages, along with versatile options like Ingredion's VITESSENCE pea protein, is expanding distribution across retail and online channels, collectively driving sustained demand for plant protein ingredients as consumers increasingly adopt plant-forward eating habits.
Rising demand for lactose-free protein alternatives
The increasing demand for lactose-free protein alternatives is reshaping consumer preferences by addressing dietary intolerances and enabling dairy-free reformulations in beverages, yogurts, and desserts. This shift is driven by a growing focus on health and wellness, where consumers prioritize digestive comfort and reduced saturated fat intake, leading to a transition from animal proteins to plant-based options in both sports nutrition and daily diets. Furthermore, lactose-free plant proteins align with corporate sustainability goals by reducing the environmental impact associated with dairy production and supporting net-zero objectives through sustainable sourcing. Technological advancements, such as improved emulsification and gelling properties of plant isolates, have enhanced the ability of these alternatives to replicate the creaminess and stability of dairy products, overcoming functionality challenges for flexitarian and lactose-intolerant consumers. The demand for clean-label and transparent products further supports this trend, with solutions like Archer Daniels Midland (ADM)'s Pivotal pea protein offering lactose-free, minimally processed options that increase protein content without artificial additives or allergen risks, thereby enhancing label appeal and digestive benefits. Product and channel innovations, including lactose-free ready-to-drink (RTD) shakes, bakery items, and meat analogues, are expanding availability in mainstream markets, addressing health-driven reformulation needs. These interconnected factors, health and digestive comfort, sustainability, processing advancements, clean-label solutions, and new product formats, are collectively driving the adoption of plant proteins as consumers increasingly seek accessible, gut-friendly nutrition options.
Consumer preferences for clean-label and digestible products
Consumer demand for clean-label and easily digestible products is reshaping the food and nutrition landscape, with a focus on recognizable ingredients and minimal processing. This trend aligns with health and wellness priorities by enhancing digestive comfort and reducing saturated fat intake in daily diets and sports nutrition. Ethical and environmental considerations further drive this shift, as clean-label plant proteins contribute to transparent supply chains, support corporate ESG objectives, and mitigate the environmental impact of livestock production. Advances in processing technology have improved the solubility and texture of plant proteins, enabling better replication of traditional protein sources without chemical additives while enhancing sensory appeal. Manufacturers such as PURIS are addressing this demand with non-GMO, allergen-free pea proteins that deliver high protein content and gut-friendly digestibility. National Science Foundation data indicates that in 2024, over 76% of United Kingdom adults read food labels before purchasing, with this figure rising to 82% among 18–34-year-olds. Nearly 45% of consumers reported paying more attention to labels compared to five years ago, and 70% prioritize information on processing and ingredients, underscoring the growing need for transparency[2]Source: National Science Foundation (NSF), "NSF Research Reveals Brits Demand Greater Clarity, Transparency and Standardisation in Food Labelling," nsf.org . Product and channel innovations, including digestible formats like bakery items and ready-to-drink (RTD) beverages, are increasingly available in mainstream retail outlets, supported by health-focused reformulations. These interconnected drivers position plant proteins as a reliable and consumer-preferred choice in the evolving global market.
Ethical and environmental sustainability
Ethical and environmental sustainability are key drivers in the adoption of plant proteins, offering lower climate impacts and greater resource efficiency compared to animal proteins. These factors align with consumer priorities for health and wellness, as they seek options that support digestive health and reduce saturated fat intake, particularly in diets and sports nutrition. Life-cycle assessments reveal that plant proteins generate 89% lower greenhouse gas emissions than animal meat in 2024 [3]Source: Good Food Institute, "Key Findings and Opportunities: Comparative Life Cycle Assessment of Plant and Animal-based Meats," gfi.org. However, this environmental advantage has not translated into proportional market share gains, indicating that sustainability alone is insufficient to drive consumer switching. The Good Food Institute emphasizes the need to pair sustainability with health benefits for broader appeal. Corporate sustainability commitments are also influencing the market, with consumer packaged goods (CPG) companies integrating plant proteins to reduce Scope 3 emissions. Brazil and Argentina dominate global soy exports, with Round Table on Responsible Soy (RTRS) certifications ensuring deforestation-free sourcing, a critical factor for European firms under the EU Deforestation Regulation, effective December 2024. This regulation is expected to bifurcate supply chains, with premium brands paying higher prices for certified soy, while uncertified sourcing risks reputational damage. Besides, technological advancements are enhancing the processing of sustainable plant protein sources, improving texture and functionality to meet clean-label demands. Manufacturers like Cargill are addressing transparency with RTRS-aligned, traceable ingredients such as Prosper pea protein. Product and channel innovations are expanding sustainable formats into bakery, ready-to-drink beverages, and mainstream retail, positioning plant proteins as essential for ethical food systems globally.
Restraints Impact Analysis*
| Restraint | (~) % Impact on CAGR Forecast | Geographic Relevance | Impact Timeline |
|---|---|---|---|
| Volatile pea and soy commodity prices | -0.6% | Global, acute in North America and Europe sourcing regions | Short term (≤ 2 years) |
| Allergenicity and dietary exclusions | -0.4% | North America and European Union, where allergen labeling is stringent | Medium term (2-4 years) |
| Sensory gaps: taste, texture, and aftertaste | -0.5% | Global, most pronounced in premium food segments | Medium term (2-4 years) |
| Regulatory hurdles related to protein content claims and labeling standards | -0.3% | North America, European Union, Asia-Pacific with varying frameworks | Long term (≥ 4 years) |
| Source: Mordor Intelligence | |||
Volatile pea and soy commodity prices
Supply chain and quality consistency challenges significantly impact manufacturers in the plant protein industry. Dependence on specific crops exposes producers to harvest volatility, climate impacts, and quality variations, complicating long-term contracts and achieving consistent functional performance, such as solubility, color, and flavor. As per the Canadian Grain Commission, in 2024, yellow pea prices surged to CAD 350-400 per tonne due to Canadian drought conditions and rising European demand for non-GMO protein, while soybean prices softened to USD 10.03 per bushel in October 2024 following higher-than-expected Brazilian harvests. This inverse price correlation destabilizes procurement strategies, with pea contract holders from 2023 facing margin compression, while soy-reliant manufacturers gain temporary relief but remain vulnerable to South American weather disruptions. The absence of futures contracts for specialty crops like peas and fava beans forces reliance on spot price negotiations, unlike soy and wheat, which benefit from established hedging tools. Sustainability considerations, such as RTRS certifications, add compliance costs under the EU Deforestation Regulation, while health-conscious consumers demand reliable digestibility, which volatile sourcing threatens. Technological advancements aim to standardize processing, but clean label preferences limit the adoption of certain solutions. Manufacturers like Ingredion and Roquette address these challenges by co-investing in contract farming programs that guarantee growers minimum prices for volume commitments, creating private markets to mitigate spot price volatility and ensure consistent quality for applications like emulsification and texturizing. However, inconsistent inputs hinder product innovation and contribute to sensory challenges, such as flavor stability issues, raising costs and reputational risks across the supply chain.
Allergenicity and dietary exclusions
Allergenicity and dietary exclusions present significant challenges for the plant protein industry, particularly in "free-from" products and controlled environments such as schools and hospitals. Common protein sources like soy, wheat, and nuts are often excluded due to allergenic concerns, even though processing can mitigate risks. For example, soy, a top-8 allergen in the United States, requires labeling that discourages its use in allergen-sensitive products, despite processing removing most allergenic proteins. Similarly, pea protein, though not regulated as an allergen, has been linked to isolated IgE-mediated reactions in legume-sensitive individuals, prompting reformulations with costlier alternatives like rice or potato proteins. Formulators must navigate cross-contact risks and complex labeling requirements across multiple sources, narrowing consumer bases and aligning with clean label demands for transparency. The FDA's addition of sesame as the ninth major allergen under the FASTER Act in January 2023 has further heightened caution, necessitating dedicated production lines for allergen-free plant proteins, which smaller processors may find financially burdensome. These constraints also intersect with sustainability concerns, as switching protein sources disrupts certified supply chains like RTRS soy. While advancements in hypoallergenic processing offer solutions, they often increase costs, adding to margin pressures from volatile pea and soy pricing. Manufacturers such as Avebe address these challenges with potato protein isolates, offering allergen-free functionality for sensitive formulations. However, product innovation in bakery, ready-to-drink beverages, and dairy alternatives remains hindered by sensory and nutritional challenges, limiting market growth and formulation flexibility.
*Our forecasts treat driver/restraint impacts as directional, not additive. The impact forecasts reflect baseline growth, mix effects, and variable interactions.
Segment Analysis
By Protein Type: Pea Gains While Soy Defends Scale
Soy protein held a 63.45% share of the plant protein market in 2025, supported by its established infrastructure, agronomic maturity, and functional versatility in applications such as meat analogues, dairy alternatives, and bakery products. This extensive scale ensures supply chain stability but also exposes vulnerabilities to factors like weather conditions, trade disputes, and market speculation, driving the need for diversification. Soy's maturity facilitates advancements in processing technologies aimed at clean-label claims. However, its classification as a top-8 allergen in the United States and the associated labeling requirements limit its adoption in sensitive consumer segments, particularly those focused on digestive health. Manufacturers continue to deliver functional reliability in B2B formulations, enabling premium and sustainable product development despite regulatory challenges like the EU Deforestation Regulation impacting soy sourcing.
Pea protein is projected to grow at a CAGR of 6.36% through 2031, driven by its non-GMO appeal, allergen-friendly properties, and cold solubility, making it suitable for ready-to-drink (RTD) beverages and sports nutrition. Its growth is further supported by the exclusion of soy in certain applications. Roquette's introduction of textured pea proteins via mechanical extrusion in June 2025 aligns with clean-label demands and supports innovation in bakery and dairy alternatives. This growth helps mitigate supply volatility, such as the 2024 price surges caused by Canadian droughts. Additionally, pea protein's superior digestibility aligns with wellness trends, while sustainability certifications, similar to RTRS, contribute to reducing environmental impacts. Emerging protein sources like potato, hemp, and Lemna (duckweed) further diversify the market, addressing regulatory, sensory, and supply chain challenges while emphasizing resilience over cost.


By End User: Supplements Outpace Food Applications
Food and beverages accounted for 57.26% of demand in 2025, while the supplements category grew at a compound annual growth rate (CAGR) of 6.12%. This growth is attributed to sports nutrition brands reformulating products with plant proteins to attract flexitarian athletes and consumers who avoid whey due to digestive issues or ethical concerns. Within the food and beverage segment, dairy alternatives are driving volume growth, with plant-based milk expected to gain market share in 2024 despite challenges related to taste and nutritional parity with cow's milk. Meat and poultry alternatives, while receiving significant media attention, hold a smaller market share and experienced a volume decline in the United States in 2024 as early adopters reverted to animal meat due to high prices and sensory limitations. Bakery applications, such as breads, muffins, and protein bars, incorporate plant proteins to enhance protein content and improve moisture retention. Beverages, particularly ready-to-drink protein shakes and fortified waters, demand ultra-clean taste and high solubility, leading to the adoption of newer proteins like fava and rice over pea protein. Breakfast cereals and snacks use plant proteins to meet "good source of protein" claims, though blending multiple proteins to achieve complete amino acid profiles increases formulation costs.
Condiments and sauces primarily utilize plant proteins for emulsification and viscosity, with potato and pea proteins preferred for their functionality rather than nutritional value. Confectionery applications remain niche, as protein addition can interfere with sugar crystallization and texture. Ready-to-eat and ready-to-cook foods use plant proteins to extend shelf life and reduce reliance on animal-based ingredients, appealing to flexitarian consumers seeking convenience without fully altering their diets. In personal care and cosmetics, plant proteins such as wheat, soy, and rice are valued for their film-forming and moisturizing properties in shampoos, conditioners, and skin creams, though this category represents minimal volume compared to food applications. Supplements, including sports nutrition, dietary supplements, and medical nutrition, prioritize protein concentration and amino acid completeness, with blends of pea, rice, and hemp proteins commonly achieving Protein Digestibility-Corrected Amino Acid Scores (PDCAAS) above 0.9. Baby food and infant formula represent a high-value, highly regulated segment where hypoallergenicity and digestibility are critical. Elderly and medical nutrition products increasingly incorporate plant proteins to address lactose intolerance and reduce saturated fat intake, though taste acceptance among older consumers remains a key formulation challenge.
Geography Analysis
Asia-Pacific accounted for 36.41% of the 2025 market share and is projected to grow at a CAGR of 5.62%. This growth is supported by China's 14th Five-Year Plan, which emphasizes alternative proteins, India's expanding middle class seeking affordable protein sources, and Japan's regulatory openness to novel food ingredients. In India, the traditional vegetarian diet is shifting toward modern plant proteins due to urbanization and rising disposable incomes, with companies like ITC Limited and Tata investing in domestic pea and soy protein production to reduce reliance on imports. Japan's Ministry of Health, Labour and Welfare has streamlined novel food approvals, facilitating faster market entry for innovative proteins such as duckweed and microbial fermentation products. Emerging markets like Indonesia, Thailand, and Singapore are witnessing increased trials of plant-based products driven by rising health awareness and Western dietary influences, though price sensitivity limits adoption beyond urban centers.
North America, comprising the United States, Canada, and Mexico, represents a mature market where household penetration has plateaued. However, per-capita consumption remains modest, indicating trial without full conversion. The Dietary Guidelines Advisory Committee (DGAC) has recommended reclassifying pulses as primary protein sources in December 2024, which could accelerate institutional adoption in school lunch programs and military rations, where cost per gram of protein is a key factor. Canada's yellow pea production, concentrated in Saskatchewan, faced drought-induced yield reductions in 2024, tightening supply and driving up prices. Mexico's growing middle class and proximity to the United States manufacturing hubs position it as a cost-effective production base for plant protein ingredients destined for North American food brands.
Europe, led by Germany, the United Kingdom, France, and the Netherlands, demonstrates the highest regulatory sophistication and consumer willingness to pay premiums for sustainability-certified products. Germany and the Netherlands host major research and development centers for companies like Roquette, Ingredion, and Kerry, where pilot plants focus on developing next-generation proteins and processing technologies. The UK's post-Brexit regulatory framework has diverged from EU novel food approvals, creating a dual-pathway market. While this complicates product launches, it also enables faster approvals for innovative ingredients. Growth markets such as Italy, Spain, and Poland are experiencing accelerated plant-based adoption from lower baselines, driven by younger consumers and expanding retail distribution. South America, dominated by Brazil and Argentina, primarily serves as a raw material supplier rather than a major consumption market. However, urbanization in cities like São Paulo and Buenos Aires is fostering local demand for plant-based products. Brazil, the world's largest soy producer, underpins global protein supply chains, while Argentina specializes in soy protein concentrates for export. The Middle East and Africa remain nascent markets where halal certification and cultural dietary patterns significantly influence product formulations. The United Arab Emirates and South Africa are leading early adoption in premium retail channels.

Competitive Landscape
The global plant protein market exhibits moderate consolidation, with major players such as Archer Daniels Midland, Cargill, and Roquette dominating raw material extraction and supply. Meanwhile, innovators like Burcon NutraScience and Axiom Foods focus on technological advancements to improve solubility, reduce off-flavors, and support clean-label claims. The 2025 acquisition of Viterra by Bunge for USD 8.2 billion established vertical integration from soy sourcing to protein isolates, creating significant barriers for mid-tier companies. Supply chain challenges, including crop dependency and the lack of futures hedging, amplify vulnerabilities, which are further tied to sustainability initiatives like RTRS certifications and compliance with EU regulations. Established players are expanding backward integration to maintain soy's projected 63.45% market share in 2025, while startups are leveraging fermentation technologies to drive a 6.36% CAGR in pea protein growth.
Competition in the market is shaped by strategic bifurcation. Large-scale players are investing in capacity expansions to secure pea and soy supplies amid market volatility caused by Canadian droughts and Brazilian surpluses. Startups are focusing on enzymatic modifications to improve texture and address sensory challenges, such as the "beany" flavor in meat analogues. Opportunities are emerging in hypoallergenic proteins derived from rice, potato, and duckweed, particularly for infant and medical applications. However, regulatory approvals create entry barriers, complementing rice protein's hypoallergenic niche despite its lysine limitations. Technological advancements, including high-moisture extrusion for meat substitutes, hydrolysis for improved digestibility, and encapsulation to mask flavors, are accelerating adoption. Organic and non-GMO certifications are becoming critical for meeting ESG goals and ensuring transparency, aligning with increasing scrutiny from labels like NSF.
Regulatory and sustainability drivers are playing a pivotal role in shaping the market. ISO 22000 certifications are critical for premium market access, ensuring traceability and reducing risks of quality inconsistencies and cross-contamination. The focus on hypoallergenic proteins intersects with allergen restrictions, with potato and hemp proteins filling gaps in sports nutrition beyond just protein quantity. European Food Safety Authority (EFSA) approvals for Lemna (duckweed) proteins enable urban farming, reducing emissions as highlighted by life cycle assessments (LCAs). The market is positioned to capture growth opportunities in segments such as ready-to-drink (RTD) products and meat analogues, leveraging advancements in technology, sustainability, and clean-label demands to meet evolving consumer preferences and regulatory requirements.
Plant Protein Industry Leaders
-
Archer Daniels Midland Company
-
Kerry Group PLC
-
Cargill, Incorporated
-
Roquette Frères
-
Ingredion Incorporated
- *Disclaimer: Major Players sorted in no particular order

Recent Industry Developments
- June 2025: Roquette expanded its Nutralys portfolio by introducing two new solutions: a textured wheat protein and a textured pea protein. Nutralys T Wheat 600L, the company's first textured wheat protein, was developed to address evolving consumer preferences for fibrous, chicken-style meat alternatives. This product featured a protein content exceeding 60%, enabling the production of high-protein products to meet market demands.
- November 2024: Axiom Foods, a supplier of rice, pea proteins, and other plant-based ingredients, formulated a new pea protein product named Pea Protein Vegotein N. The company announced that this pea protein would be manufactured in North America and emphasized that it was soy-free, gluten-free, and non-GMO. Axiom Foods' plant protein product portfolio also included Oryzatein Clear Rice Protein, VegOtein Clear Pea Protein, Oryzatein Ultra ADV, Oryzatein Brown Rice Protein, Oryzatein SG-BN, VegOtein N, VegOtein TX, Cannatein, Cucurbotein, and Sacha Inchi.
- June 2024: Roquette announced the introduction of Nutralys Fava S900M, its first fava bean protein isolate, across Europe and North America. This addition to the Nutralys plant protein portfolio offered a 90% protein content, making it well-suited for applications such as meat substitutes, non-dairy alternatives, and baked goods.


Global Plant Protein Market Report Scope
Hemp Protein, Pea Protein, Potato Protein, Rice Protein, Soy Protein, Wheat Protein are covered as segments by Protein Type. Animal Feed, Food and Beverages, Personal Care and Cosmetics, Supplements are covered as segments by End User. Africa, Asia-Pacific, Europe, Middle East, North America, South America are covered as segments by Region.
By Protein Type
| Hemp Protein |
| Pea Protein |
| Potato Protein |
| Rice Protein |
| Soy Protein |
| Wheat Protein |
| Other Plant Protein |
By End User
| Animal Feed | |
| Food and Beverages | Bakery |
| Beverages | |
| Breakfast Cereals | |
| Condiments/Sauces | |
| Confectionery | |
| Dairy and Dairy Alternatives | |
| Meat/Poultry/Seafood and Alternatives | |
| RTE/RTC Foods | |
| Snacks | |
| Personal Care and Cosmetics | |
| Supplements | Baby Food and Infant Formula |
| Elderly and Medical Nutrition | |
| Sport and Dietary Supplements |
By Geography
| North America | United States |
| Canada | |
| Mexico | |
| Rest of North America | |
| Europe | Germany |
| United Kingdom | |
| Italy | |
| France | |
| Spain | |
| Netherlands | |
| Poland | |
| Belgium | |
| Sweden | |
| Rest of Europe | |
| Asia-Pacific | China |
| India | |
| Japan | |
| Australia | |
| Indonesia | |
| South Korea | |
| Thailand | |
| Singapore | |
| Rest of Asia-Pacific | |
| South America | Brazil |
| Argentina | |
| Colombia | |
| Chile | |
| Peru | |
| Rest of South America | |
| Middle East and Africa | South Africa |
| Saudi Arabia | |
| United Arab Emirates | |
| Nigeria | |
| Egypt | |
| Morocco | |
| Turkey | |
| Rest of Middle East and Africa |
| By Protein Type | Hemp Protein | |
| Pea Protein | ||
| Potato Protein | ||
| Rice Protein | ||
| Soy Protein | ||
| Wheat Protein | ||
| Other Plant Protein | ||
| By End User | Animal Feed | |
| Food and Beverages | Bakery | |
| Beverages | ||
| Breakfast Cereals | ||
| Condiments/Sauces | ||
| Confectionery | ||
| Dairy and Dairy Alternatives | ||
| Meat/Poultry/Seafood and Alternatives | ||
| RTE/RTC Foods | ||
| Snacks | ||
| Personal Care and Cosmetics | ||
| Supplements | Baby Food and Infant Formula | |
| Elderly and Medical Nutrition | ||
| Sport and Dietary Supplements | ||
| By Geography | North America | United States |
| Canada | ||
| Mexico | ||
| Rest of North America | ||
| Europe | Germany | |
| United Kingdom | ||
| Italy | ||
| France | ||
| Spain | ||
| Netherlands | ||
| Poland | ||
| Belgium | ||
| Sweden | ||
| Rest of Europe | ||
| Asia-Pacific | China | |
| India | ||
| Japan | ||
| Australia | ||
| Indonesia | ||
| South Korea | ||
| Thailand | ||
| Singapore | ||
| Rest of Asia-Pacific | ||
| South America | Brazil | |
| Argentina | ||
| Colombia | ||
| Chile | ||
| Peru | ||
| Rest of South America | ||
| Middle East and Africa | South Africa | |
| Saudi Arabia | ||
| United Arab Emirates | ||
| Nigeria | ||
| Egypt | ||
| Morocco | ||
| Turkey | ||
| Rest of Middle East and Africa | ||


Market Definition
- End User - The Protein Ingredients Market operates on a B2B basis. Food, Beverages, Supplements, Animal Feed, and Personal Care & Cosmetic manufacturers are considered to be end-consumers in the market studied. The scope excludes manufacturers buying liquid/dry whey to be used for application as a binding agent or thickener or other non-protein applications.
- Penetration Rate - Penetration Rate is defined as the percentage of Protein-Fortified End User Market Volume in the Overall End User Market Volume.
- Average Protein Content - Average protein content is the average protein content present per 100 g of product manufactured by all end-user companies considered under the scope of this report.
- End User Market Volume - End-user market volume is the consolidated volume of all types and forms of end-user products in the country or region.
| Keyword | Definition |
|---|---|
| Alpha-lactalbumin (α-Lactalbumin) | It is a protein that regulates the production of lactose in the milk of almost all mammalian species. |
| Amino acid | It is an organic compound that contains both amino and carboxylic acid functional groups, which are required for the synthesis of body protein and other important nitrogen-containing compounds, such as creatine, peptide hormones, and some neurotransmitters. |
| Blanching | It is the process of briefly heating vegetables with steam or boiling water. |
| BRC | British Retail Consortium |
| Bread improver | It is a flour-based blend of several components with specific functional properties designed to modify dough characteristics and give quality attributes to bread. |
| BSF | Black Soldier Fly |
| Caseinate | It is a substance produced by adding an alkali to acid casein, a derivative of casein. |
| Celiac disease | Celiac disease is an immune reaction to eating gluten, a protein found in wheat, barley, and rye. |
| Colostrum | It is a milky fluid that’s released by mammals that have recently given birth before breast milk production begins. |
| Concentrate | It is the least processed form of protein and has a protein content ranging from 40-90% by weight. |
| Dry protein basis | It refers to the percentage of "pure protein" present in a supplement after the water in it is completely removed through heat. |
| Dry whey | It is the product resulting from drying fresh whey which has been pasteurized and to which nothing has been added as a preservative. |
| Egg protein | It is a mixture of individual proteins, including ovalbumin, ovomucoid, ovoglobulin, conalbumin, vitellin, and vitellenin. |
| Emulsifier | It is a food additive that facilitates the blending of foods that are immiscible with one another, such as oil and water. |
| Enrichment | It is the process of addition of micronutrients that are lost during the processing of the product. |
| ERS | Economic Research Service of the USDA |
| Extrusion | It is the process of forcing soft mixed ingredients through an opening in a perforated plate or die designed to produce the required shape. The extruded food is then cut to a specific size by blades. |
| Fava | Also known as Faba, it is another word for yellow split beans. |
| FDA | Food and Drug Administration |
| Flaking | It is a process in which typically a cereal grain (like corn, wheat, or rice) is broken down into grits, cooked with flavors and syrups, and then pressed into flakes between cooled rollers. |
| Foaming agent | It is a food ingredient that makes it possible to form or maintain a uniform dispersion of a gaseous phase in a liquid or solid food. |
| Foodservice | It refers to the part of the food industry which includes businesses, institutions, and companies which prepare meals outside the home. It includes restaurants, school and hospital cafeterias, catering operations, and many other formats. |
| Fortification | It is the deliberate addition of micronutrients that are not found in them naturally or which are lost during processing, to improve a food product's nutritional value. |
| FSANZ | Food Standards Australia New Zealand |
| FSIS | Food Safety and Inspection Service |
| FSSAI | Food Safety and Standards Authority of India |
| Gelling agent | It is an ingredient that functions as a stabilizer and thickener to provide thickening without stiffness through the formation of gel. |
| GHG | Greenhouse Gas |
| Gluten | It is a family of proteins found in grains, including wheat, rye, spelt, and barley. |
| Hemp | It is a botanical class of Cannabis sativa cultivars grown specifically for industrial or medicinal use. |
| Hydrolysate | It is a form of protein manufactured by exposing the protein to enzymes that can partially break the bonds between the protein's amino acids and break down large, complicated proteins into smaller pieces. Its processing makes it easier and quicker to digest. |
| Hypoallergenic | It refers to a substance that causes fewer allergic reactions. |
| Isolate | It is the purest and most processed form of protein which has undergone separation to obtain a pure protein fraction. It typically contains ≥ 90% of protein by weight. |
| Keratin | It is a protein that helps form hair, nails, and the outer layer of skin. |
| Lactalbumin | It is the albumin contained in milk and obtained from whey. |
| Lactoferrin | It is an iron‑binding glycoprotein that is present in the milk of most mammals. |
| Lupin | It is the yellow legume seeds of the genus Lupinus. |
| Millenial | Also known as Generation Y or Gen Y, it refers to the people born from 1981 to 1996. |
| Monogastric | It refers to an animal with a single-compartmented stomach. Examples of monogastric include humans, poultry, pigs, horses, rabbits, dogs, and cats. Most monogastric are generally unable to digest much cellulose food materials such as grasses. |
| MPC | Milk protein concentrate |
| MPI | Milk protein isolate |
| MSPI | Methylated soy protein isolate |
| Mycoprotein | Mycoprotein is a form of single-cell protein, also known as fungal protein, derived from fungi for human consumption. |
| Nutricosmetics | It is a category of products and ingredients that act as nutritional supplements to care for skin, nails, and hair natural beauty. |
| Osteoporosis | It is a medical condition in which the bones become brittle and fragile from loss of tissue, typically as a result of hormonal changes, or deficiency of calcium or vitamin D. |
| PDCAAS | Protein digestibility-corrected amino acid score (PDCAAS) is a method of evaluating the quality of a protein based on both the amino acid requirements of humans and their ability to digest it. |
| Per-capita consumption of animal protein | It is the average amount of animal protein (such as milk, whey, gelatin, collagen, and egg proteins) that is readily available for consumption by each person in an actual population. |
| Per-capita consumption of plant protein | It is the average amount of plant protein (such as soy, wheat, pea, oat, and hemp proteins) that is readily available for consumption by each person in an actual population. |
| Quorn | It is a microbial protein manufactured using mycoprotein as an ingredient, in which the fungus culture is dried and mixed with egg albumen or potato protein, which acts as a binder, and then is adjusted in texture and pressed into various forms. |
| Ready-to-Cook (RTC) | It refers to food products that include all of the ingredients, where some preparation or cooking is required through a process that is given on the package. |
| Ready-to-Eat (RTE) | It refers to a food product prepared or cooked in advance, with no further cooking or preparation required before being eaten. |
| RTD | Ready-to-Drink |
| RTS | Ready-to-Serve |
| Saturated fat | It is a type of fat in which the fatty acid chains have all single bonds. It is generally considered unhealthy. |
| Sausage | It is a meat product made of finely chopped and seasoned meat, which may be fresh, smoked, or pickled and which is then usually stuffed into a casing. |
| Seitan | It is a plant-based meat substitute made out of wheat gluten. |
| Softgel | It is a gelatin-based capsule with a liquid fill. |
| SPC | Soy protein concentrate |
| SPI | Soy protein isolate |
| Spirulina | It is a biomass of cyanobacteria that can be consumed by humans and animals. |
| Stabilizer | It is an ingredient added to food products to help maintain or enhance their original texture, and physical and chemical characteristics. |
| Supplementation | It is the consumption or provision of concentrated sources of nutrients or other substances that are intended to supplement nutrients in the diet and is intended to correct nutritional deficiencies. |
| Texturant | It is a specific type of food ingredient that is used to control and alter the mouthfeel and texture of food and beverage products. |
| Thickener | It is an ingredient that is used to increase the viscosity of a liquid or dough and make it thicker, without substantially changing its other properties. |
| Trans fat | Also called trans-unsaturated fatty acids or trans fatty acids, it is a type of unsaturated fat that naturally occurs in small amounts in meat. |
| TSP | Textured soy protein |
| TVP | Textured vegetable protein |
| WPC | Whey protein concentrate |
| WPI | Whey protein isolate |


Research Methodology
Mordor Intelligence follows a four-step methodology in all our reports.
- Step-1: Identify Key Variables: The quantifiable key variables (industry and extraneous) pertaining to the specific product segment and country are selected from a group of relevant variables & factors based on desk research & literature review; along with primary expert inputs. These variables are further confirmed through regression modeling (wherever required).
- Step-2: Build a Market Model: In order to build a robust forecasting methodology, the variables and factors identified in Step-1 are tested against available historical market numbers. Through an iterative process, the variables required for market forecast are set and the model is built on the basis of these variables.
- Step-3: Validate and Finalize: In this important step, all market numbers, variables and analyst calls are validated through an extensive network of primary research experts from the market studied. The respondents are selected across levels and functions to generate a holistic picture of the market studied.
- Step-4: Research Outputs: Syndicated Reports, Custom Consulting Assignments, Databases & Subscription Platforms


