Market Overview
| Study Period | 2021 - 2031 |
|---|---|
| Forecast Data Period | 2026 - 2031 |
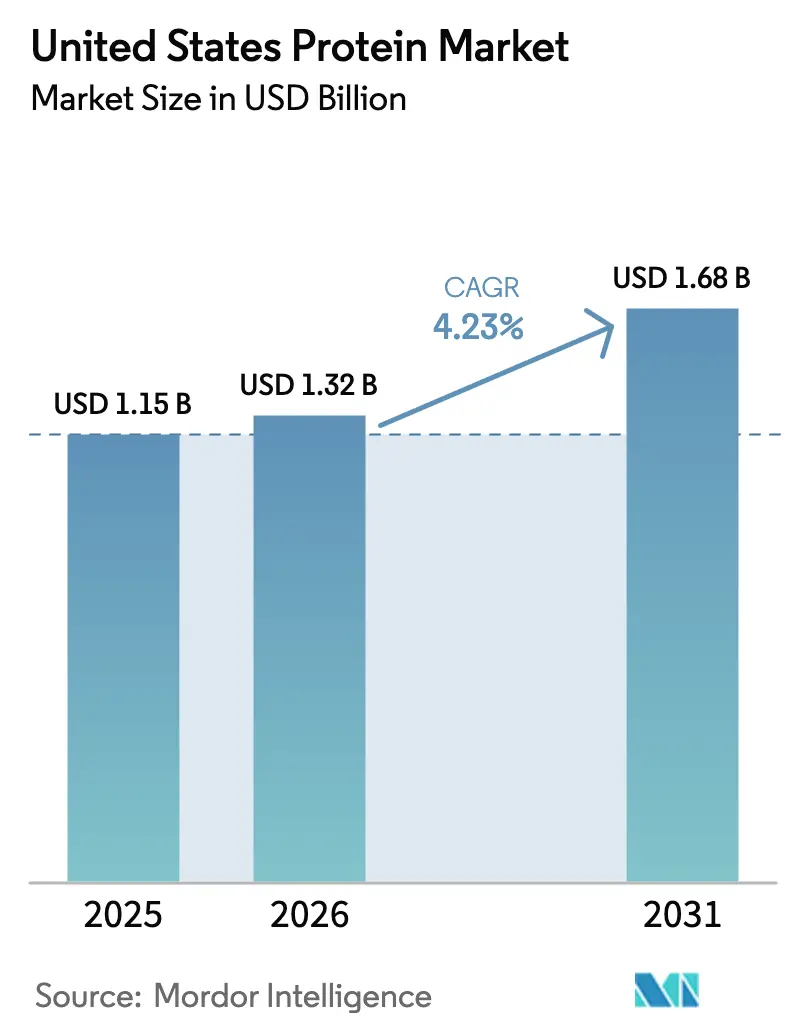
| Base Year Market Size (2025) | USD 1.15 Billion |
| Market Size (2026) | USD 1.32 Billion |
| Market Size (2031) | USD 1.68 Billion |
| Growth Rate (2026 - 2031) | 4.23% CAGR |
| Market Concentration | Low |
Major Players*Disclaimer: Major Players sorted in no particular order Image © Mordor Intelligence. Reuse requires attribution under CC BY 4.0. |
|
United States Protein Market Analysis by Mordor Intelligence
The United States protein market size is valued at USD 1.32 billion in 2026, growing from the 2025 value of USD 1.15 billion, and is forecast to climb to USD 1.68 billion by 2031, advancing at a 4.23% CAGR. Volume growth is steady, yet sweeping shifts in sourcing and formulation are reshaping competitive dynamics. Animal proteins remain dominant, but tighter environmental rules, port delays, and the FDA’s new “healthy” claim framework are accelerating the pivot toward plant-based and microbial inputs. Ingredient buyers are shortening innovation cycles to under 12 months, adding strain to supply chains already contending with 14-day shipping delays and 37% commodity price swings. At the same time, demographic tailwinds, from aging boomers prioritizing muscle preservation to Gen Z athletes demanding clean-label shakes, are expanding premium niches and favoring suppliers that pair technical support with verified sustainability credentials.
Key Report Takeaways
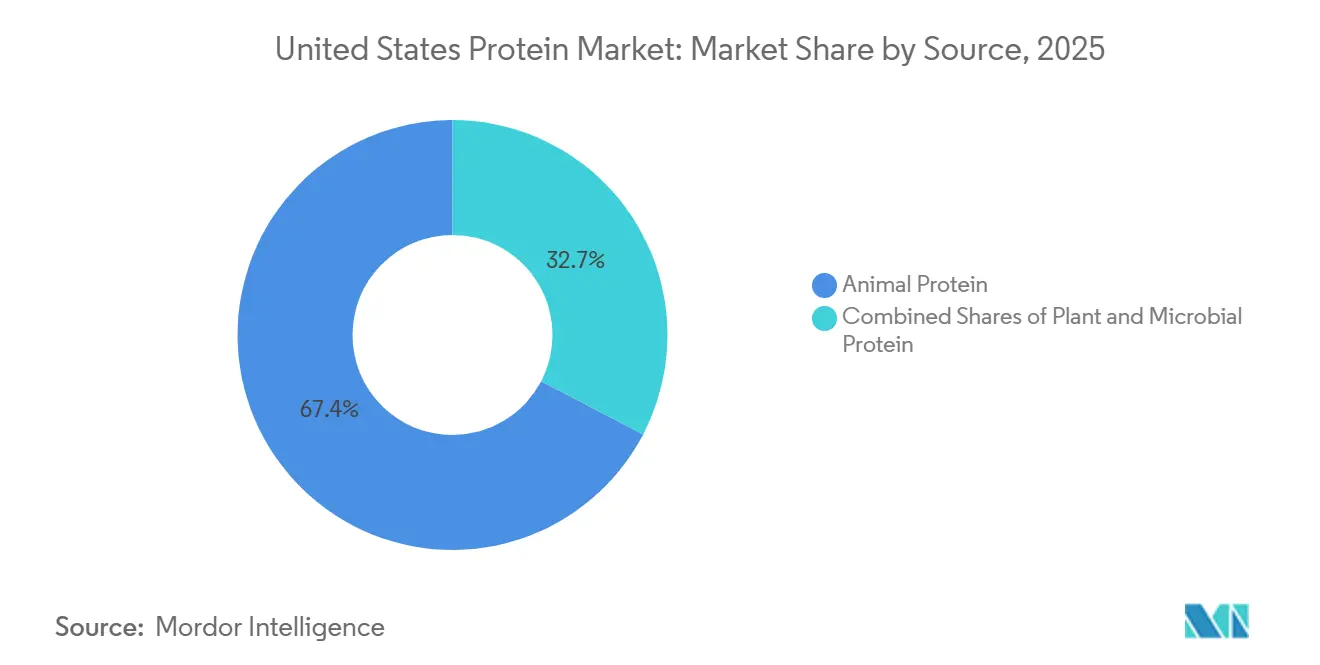
- By source, animal proteins led with a 67.35% United States protein market share in 2025, while plant proteins are forecast to advance at a 5.48% CAGR through 2031.
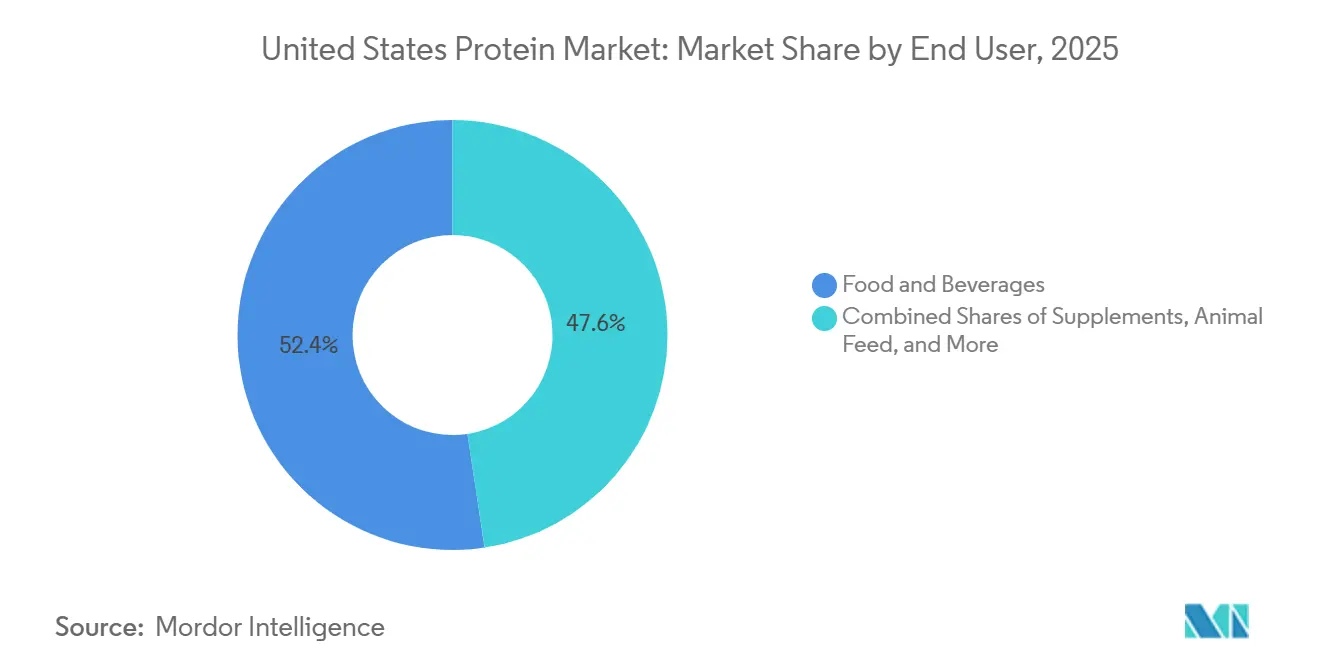
- By end user, food and beverage accounted for 52.38% of the United States protein market size in 2025, whereas sports nutrition is projected to expand at a 6.21% CAGR to 2031.
Note: Market size and forecast figures in this report are generated using Mordor Intelligence’s proprietary estimation framework, updated with the latest available data and insights as of January 2026.
United States Protein Market Trends and Insights
Drivers Impact Analysis*
| Drivers | (~) % Impact on CAGR Forecasts | Geographic Relevance | Impact Timeline |
|---|---|---|---|
| Surge in Plant-Based Protein Demand from Vegan/Flexitarian Trends | +1.2% | National, with concentration in West Coast and Northeast urban centers | Medium term (2-4 years) |
| Continuous Innovation in Protein-Fortified Beverages and Functional Foods | +0.8% | National, led by sports nutrition hubs in California, Texas, and Florida | Short term (≤ 2 years) |
| Fitness and Sports Nutrition Boom | +1.0% | National, strongest in metropolitan areas with high gym membership penetration | Short term (≤ 2 years) |
| Rising Research and Development Investments | +0.6% | National, concentrated in Midwest fermentation clusters and California biotech corridors | Long term (≥ 4 years) |
| Growth in High-Protein Snacks and Meat Alternatives | +0.7% | National, with early adoption in Pacific and Mid-Atlantic regions | Medium term (2-4 years) |
| Sustainability Mandates Push Manufacturers Toward Eco-Friendly Proteins | +0.5% | National, with stricter enforcement in California, Oregon, and Washington | Long term (≥ 4 years) |
| Source: Mordor Intelligence | |||


Surge in Plant-Based Protein Demand from Vegan/Flexitarian Trends
Flexitarian households—those reducing but not eliminating animal protein—now represent 42% of United States consumers, up from 36% in 2023, according to a 2025 survey by the Good Food Institute. This behavioral shift is less about ideology and more about perceived health benefits; 68% of flexitarians cite cardiovascular risk reduction as their primary motivation, not animal welfare. The implication for ingredient suppliers is stark: formulators are blending pea and rice proteins into dairy-based shakes to lower saturated fat without sacrificing leucine content, a tactic that preserves muscle-protein synthesis efficacy while meeting the Food and Drug Administration's revised "healthy" claim criteria. Retail velocity data from 2024 show plant-based protein powders grew unit sales by 19%, while traditional whey isolates advanced only 4%, signaling a permanent reallocation of shelf space. Smaller brands like Puris Proteins are capitalizing on this gap by offering organic, non-GMO pea protein that commands a 15% to 20% price premium over commodity soy isolates, eroding the cost advantage that once anchored animal proteins.
Continuous Innovation in Protein-Fortified Beverages and Functional Foods
Protein-fortified ready-to-drink beverages reached USD 2.8 billion in United States retail sales during 2024, with functional hydration products combining electrolytes, collagen peptides, and branched-chain amino acids, growing at double the rate of traditional sports drinks. Gatorade's 2024 launch of a 20-gram whey isolate recovery drink exemplifies how incumbents are defending market share against upstarts like Fairlife, which posted 23% year-over-year growth by fortifying ultra-filtered milk with lactase and additional casein. The innovation cycle has compressed; brands now iterate formulations every 9 to 12 months instead of the historical 18-month cadence, driven by real-time social-media feedback and direct-to-consumer testing. Functional foods are following suit, breakfast cereals fortified with cricket protein or mycoprotein are entering regional chains, targeting consumers willing to pay USD 1.50 to USD 2.00 more per box for perceived sustainability and amino-acid completeness. This premiumization trend is reshaping ingredient procurement, as buyers prioritize suppliers offering co-manufacturing support and rapid prototyping over lowest-cost commodity providers.
Fitness and Sports Nutrition Boom
Gym membership in the United States surpassed 73 million in 2024, a 12% increase from 2022, while home-fitness equipment sales stabilized after pandemic-era spikes, according to the International Health, Racquet & Sportsclub Association[1]Source: International Health, Racquet and Sportsclub Association, "IHRSA Global Report," ihrsa.org. This return to commercial gyms is driving on-premise protein shake sales, with chains like 24 Hour Fitness and Equinox reporting 30% higher point-of-sale beverage revenue in 2024 versus 2023. The demographic skew is notable: adults aged 50 to 65 now account for 28% of sports nutrition purchases, up from 19% in 2020, as sarcopenia awareness prompts preventive supplementation. Whey protein isolates remain the gold standard for this cohort due to rapid digestion kinetics, yet plant-based blends are gaining traction among younger consumers who prioritize environmental impact over leucine bioavailability. Glanbia's North America performance nutrition segment grew 8% in fiscal 2024, driven by contract manufacturing for private-label brands that undercut national names by 20% to 25% on price while maintaining comparable protein quality. This bifurcation, premium branded products for older consumers, value private-label for millennials, is fragmenting distribution strategies and forcing ingredient suppliers to offer tiered quality specifications.
Rising Research and Development Investments
In 2024, corporate R&D investments in alternative protein technologies in the U.S. totaled USD 1.4 billion, with precision fermentation and cellular agriculture accounting for 62% of venture capital inflows, as reported by the Good Food Institute. MycoTechnology is advancing fermentation platforms that convert agricultural by-products into mycoprotein. They have successfully lowered production costs to under USD 3.00 per kilogram, making their fungal proteins competitive with soy isolates for bulk applications. Meanwhile, Ajinomoto's 2024 investment in amino-acid fermentation capacity in Iowa highlights confidence in enzyme-optimized methods to create customized protein blends. These blends offer unique functional properties, such as improved foaming or emulsification, surpassing standard commodity ingredients. Patent filings for protein-modification techniques increased by 34% in 2024, focusing on enzymatic hydrolysis and extrusion texturization, according to the United States Patent and Trademark Office. This wave of innovation is driving the emergence of a two-tier market: high-volume commodity proteins for cost-sensitive applications and specialty proteins that command 2x to 3x premiums, particularly for clean-label or allergen-free positioning.
Restraints Impact Analysis*
| Restraints | (~) % Impact on CAGR Forecasts | Geographic Relevance | Impact Timeline |
|---|---|---|---|
| Supply Chain Disruptions | -0.9% | National, with acute pressure on West Coast ports and Midwest rail corridors | Short term (≤ 2 years) |
| Stringent FDA Labeling and Nutritional Regulations | -0.6% | National, uniform enforcement across all states | Medium term (2-4 years) |
| Fluctuating Raw Material Prices for Soy, Pea, and Whey | -0.8% | National, with regional variance tied to crop yields in Midwest and Northern Plains | Short term (≤ 2 years) |
| Environmental Scrutiny on Production | -0.4% | National, with stricter oversight in California, Oregon, and Northeast states | Long term (≥ 4 years) |
| Source: Mordor Intelligence | |||
Supply Chain Disruptions
In early 2024, congestion at the ports of Los Angeles and Long Beach increased average container dwell times to 8.2 days, a sharp rise from the pre-pandemic average of 3.5 days. This delay disrupted imports of whey protein concentrate from New Zealand and Ireland, causing setbacks of 10 to 14 days. Adding to the challenges, domestic rail bottlenecks worsened the situation. Soybean meal shipments from Iowa processing plants to East Coast blenders faced transit delays of 12% to 18%, driven by crew shortages and outdated infrastructure, according to the Association of American Railroads. These disruptions forced ingredient buyers to maintain inventory levels 25% to 30% higher than historical norms, tying up working capital and driving up warehousing costs by an estimated USD 40 million to USD 50 million across the industry in 2024. Smaller formulators, with limited financial flexibility, turned to spot-market purchases, paying premiums of 8% to 12% over contract rates. This approach reduced their gross margins and delayed product launches. To address these challenges, companies have implemented dual-sourcing strategies. By qualifying secondary suppliers in various geographies, they aim to mitigate the risks of single-point failures. Although this strategy adds complexity, it significantly reduces exposure to localized disruptions.
Stringent FDA Labeling and Nutritional Regulations
In December 2024, the FDA issued a final rule that redefined the "healthy" nutrient-content claim. Under the new criteria, protein-rich foods must now provide at least 10% of the daily value for specific nutrients of public health concern, such as potassium, calcium, or vitamin D, while also meeting limits on saturated fat, sodium, and added sugars[2]Source: U.S. Food and Drug Administration, “Use of the Term ‘Healthy’ in Food Labeling,” fda.gov. This multi-criteria framework disqualifies many existing protein bars and shakes that rely on isolated proteins without added fortification. Consequently, manufacturers face costly reformulation cycles, with expenses ranging from USD 50,000 to USD 150,000 per SKU, including stability testing and label redesigns. Additionally, the rule requires updated Nutrition Facts panels by 2026, mandating manufacturers to disclose added sugars in protein blends. This transparency measure particularly highlights formulations that use bulking agents like maltodextrin or corn syrup solids. Mid-sized brands with 10 to 50 SKUs bear a disproportionate share of compliance costs, as they lack the scale to distribute regulatory expenses across high-volume production runs. In response, ingredient suppliers are offering pre-blended, claim-compliant protein systems to simplify formulation. However, these turnkey solutions come at a premium, costing 12% to 18% more than standard commodity proteins, which further tightens formulators' margin flexibility.
*Our forecasts treat driver/restraint impacts as directional, not additive. The impact forecasts reflect baseline growth, mix effects, and variable interactions.
Segment Analysis
By Source: Animal Proteins Retain Share Despite Plant Surge
In 2025, animal-derived ingredients led the U.S. protein market, capturing a 67.35% share. Whey and casein, essential for sports recovery and as emulsifiers in baked goods, were key contributors to this dominance. Microbial proteins, while accounting for less than 2% of the volume share, attract significant research and development funding due to their potential for near-carbon-neutral production through continuous fermentation. Algae proteins, such as spirulina, are gaining popularity in smoothie bowls. Mycoprotein is nearing production costs of USD 2.50–3.00 per kilogram, approaching the price of soy concentrate. Insect protein remains a niche category, primarily used in specialty bars and pet food, with consumer acceptance at just 18%.
Plant proteins, led by pea and soy, are anticipated to grow at a 5.48% CAGR, driven by allergen-free claims and sustainability initiatives that reduce water usage by up to 75%. Pea isolates, priced 30%–50% higher than soy, justify their premium with a neutral taste and non-GMO status. Meanwhile, rice and potato proteins are gaining traction for their hypoallergenic properties. As regulatory and carbon cost pressures increase, the United States protein market is expected to allocate a larger share to these emerging sources. Plant-protein processors are addressing challenges by incorporating flavor-masking and enzymatic hydrolysis technologies. These advancements produce cleaner taste profiles, enabling their use in confectionery products and ready-to-drink coffee. The overall trend is a gradual integration of animal and plant proteins by formulators. This approach optimizes performance, reduces risks, and enhances label claims, ensuring all supplier segments remain relevant in the United States protein market.


By End User: Sports Nutrition Outpaces Food and Beverage
In 2025, the food and beverage sector held a significant 52.38% share of the United States protein market, fueled by the rising popularity of high-protein yogurt, ultra-filtered milk, and fortified plant-based beverages. Meat and dairy alternatives, using textured soy and pea, effectively replicate 15–25 grams of protein per serving. Bakery manufacturers are boosting bread protein content from 4 grams to 10 grams by incorporating whey concentrate. Snacks such as bars, jerky, and fortified chips are driving sub-segment growth due to their convenience and appeal as permissible indulgences. Ready-to-eat frozen meals have increased their protein content from 13 grams to an average of 20 grams over the past five years, supporting their placement in premium price tiers. To differentiate through sustainability, condiment and cereal brands are exploring the use of cricket and mycoprotein.
Supplements, including sports, infant, and elderly nutrition, are expected to grow at a strong 6.21% CAGR, surpassing all other consumption channels. While whey isolates continue to dominate post-workout powders, blended plant formulations are gaining popularity among environmentally-conscious athletes. Infant-formula proteins, which must comply with strict digestibility standards, are increasingly sourced from a concentrated supplier base that ensures consistent quality across batches. Elderly-nutrition beverages are leveraging micellar casein for its slower absorption properties to help mitigate sarcopenia. In pet food, applications account for up to 15% of volume, with premium functional ingredients like insect meal and algae gaining momentum.
Geography Analysis
The United States protein ingredients market exhibits regional production concentration, with the Midwest serving as the epicenter for soy and dairy protein manufacturing due to proximity to soybean fields and dairy herds. Iowa, Illinois, and Wisconsin collectively host over 60% of the nation's soy protein isolate and whey protein concentrate capacity, benefiting from integrated supply chains that minimize transportation costs and enable just-in-time delivery to food manufacturers. California and the Pacific Northwest are emerging as plant-based protein innovation hubs, with companies like Puris Proteins and MycoTechnology establishing fermentation and pea protein processing facilities to serve the region's concentration of alternative-protein brands. The Northeast, particularly New York and Pennsylvania, retains legacy dairy protein production but faces margin pressure from Midwest competitors with lower input costs. Texas and the Southeast are growth frontiers, with Ingredion and ADM expanding specialty protein capacity to serve the region's fast-growing Hispanic population, which exhibits higher per-capita consumption of protein-rich foods like beans, dairy, and meat.
Consumption patterns vary by region, reflecting demographic and cultural differences. West Coast consumers over-index on plant-based proteins, with California accounting for 28% of national plant-based food sales despite representing 12% of the population SPINS. The Midwest and South exhibit stronger preference for animal proteins, particularly whey and casein in sports nutrition products, driven by higher rates of gym membership and participation in strength training. Urban centers—New York, Los Angeles, Chicago, and Houston, drive innovation adoption, with functional beverages and high-protein snacks achieving 15% to 20% higher velocity in metropolitan areas compared to rural markets. The Mountain West, including Colorado and Utah, shows elevated demand for outdoor-focused nutrition products, with collagen peptides and plant-based protein bars tailored for hiking and endurance sports gaining traction.
Regulatory dynamics are nationally uniform due to FDA jurisdiction, yet state-level environmental regulations create regional cost disparities. California's stringent air and water quality standards raise protein production costs by an estimated 6% to 10% compared to Midwest facilities, prompting some manufacturers to expand capacity in states with less prescriptive environmental oversight, as noted by California Air Resources Board[3]Source: California Air Resources Board, "California Air Resources Board - Dairy Methane,"ww2.arb.ca.gov. The FDA's 2024 updates to the "healthy" claim and Nutrition Facts labeling apply uniformly, but enforcement intensity varies; states with robust consumer-protection agencies, such as New York and California, conduct more frequent audits and issue penalties for non-compliance, incentivizing early adoption of updated labels.
Competitive Landscape
The U.S. protein ingredients market is characterized by a mix of strategies employed by established players and emerging disruptors. Companies like Archer Daniels Midland and Glanbia utilize vertical integration, managing soy crushing and dairy collection networks to ensure raw material supply and maintain cost leadership in commodity proteins. At the same time, these firms are expanding into specialty proteins; for example, ADM's 2024 acquisition of Sojaprotein, a European soy protein producer, enhanced its portfolio with non-GMO and organic offerings aimed at premium market segments. Mid-tier specialists such as Roquette and Ingredion focus on functional differentiation, providing proteins with tailored solubility, emulsification, or foaming properties that command 20% to 40% premiums over commodity grades. Smaller players like Puris Proteins, MycoTechnology, and Nature's Fynd are exploring novel sources such as pea, mycoprotein, and fermentation-derived proteins. These innovations appeal to sustainability-conscious brands willing to pay 30% to 50% more for verified low-carbon ingredients.
Technology adoption remains the primary competitive differentiator. Precision fermentation platforms, which use genetically optimized microbes to produce animal-identical proteins without livestock, are attracting venture capital but remain limited in scale. With production costs of USD 8 to USD 12 per kilogram, 2x to 3x higher than dairy whey, their commercial application is largely restricted to niche markets like infant formula. Extrusion texturization, a mechanical process that imparts a meat-like fibrous structure to plant proteins, is becoming a standard requirement for meat-alternative suppliers. Companies such as Bunge and Ingredion are addressing this need by offering toll manufacturing services to brands without in-house capabilities.
Enzymatic hydrolysis, which breaks proteins into peptides for improved digestibility and reduced allergenicity, is facilitating entry into highly regulated segments like infant formula and medical nutrition. These segments have traditionally been dominated by incumbents such as Fonterra and Arla Foods due to stringent regulatory barriers. In 2024, patent activity in protein modification increased by 34%, with claims focusing on flavor masking, solubility enhancement, and allergen reduction. These advancements are expanding the market potential of plant proteins, enabling them to compete in applications historically dominated by dairy.
United States Protein Industry Leaders
-
Archer Daniels Midland Company
-
Darling Ingredients Inc.
-
Glanbia PLC
-
International Flavors & Fragrances, Inc.
-
Kerry Group PLC
- *Disclaimer: Major Players sorted in no particular order


Recent Industry Developments
- August 2024: Global dairy co-operative Fonterra and natural ingredient manufacturer Superbrewed Food have teamed up to boost sustainable food production. The partnership combines Superbrewed’s biomass protein platform with Fonterra’s dairy processing, ingredients, and application expertise to develop additional nutrient-rich, functional biomass protein.
- July 2024: Ingredion Incorporated expanded its range of North American-grown and produced protein fortification solutions by launching VITESSENCE® Pea 100 HD in the U.S. and Canada. This pea protein is specifically designed for cold-pressed bars. The new product helps maintain bar softness throughout shelf life, enhances texture and sensory attributes, and increases nutritional value to improve consumer appeal.
- July 2024: Arla Foods Ingredients has secured US Food & Drug Administration approval for the use of whey protein hydrolysates that support allergy management and gut comfort in infant formula. The FDA agreed that four ingredients in the company’s Peptigen® and Lacprodan® ranges meet the definition of peptones in the US Code of Federal Regulations and are permitted for use in early-life nutrition.


United States Protein Market Report Scope
Animal, Microbial, Plant are covered as segments by Source. Animal Feed, Food and Beverages, Personal Care and Cosmetics, Supplements are covered as segments by End User.
Source
| Animal | Casein and Caseinates |
| Collagen | |
| Egg Protein | |
| Gelatin | |
| Insect Protein | |
| Milk Protein | |
| Whey Protein | |
| Other Animal Protein | |
| Microbial | Algae Protein |
| Mycoprotein | |
| Plant | Hemp Protein |
| Pea Protein | |
| Potato Protein | |
| Rice Protein | |
| Soy Protein | |
| Wheat Protein | |
| Other Plant Protein |
End User
| Animal Feed and Pet Food | |
| Food and Beverages | Bakery |
| Beverages | |
| Breakfast Cereals | |
| Condiments/Sauces | |
| Confectionery | |
| Dairy and Dairy Alternative Products | |
| Meat/Poultry/Seafood and Meat Alternative Products | |
| RTE/RTC Food Products | |
| Snacks | |
| Personal Care and Cosmetics | |
| Supplements | Baby Food and Infant Formula |
| Elderly Nutrition and Medical Nutrition | |
| Sport/Performance Nutrition |
| Source | Animal | Casein and Caseinates |
| Collagen | ||
| Egg Protein | ||
| Gelatin | ||
| Insect Protein | ||
| Milk Protein | ||
| Whey Protein | ||
| Other Animal Protein | ||
| Microbial | Algae Protein | |
| Mycoprotein | ||
| Plant | Hemp Protein | |
| Pea Protein | ||
| Potato Protein | ||
| Rice Protein | ||
| Soy Protein | ||
| Wheat Protein | ||
| Other Plant Protein | ||
| End User | Animal Feed and Pet Food | |
| Food and Beverages | Bakery | |
| Beverages | ||
| Breakfast Cereals | ||
| Condiments/Sauces | ||
| Confectionery | ||
| Dairy and Dairy Alternative Products | ||
| Meat/Poultry/Seafood and Meat Alternative Products | ||
| RTE/RTC Food Products | ||
| Snacks | ||
| Personal Care and Cosmetics | ||
| Supplements | Baby Food and Infant Formula | |
| Elderly Nutrition and Medical Nutrition | ||
| Sport/Performance Nutrition | ||


Market Definition
- End User - The Protein Ingredients Market operates on a B2B basis. Food, Beverages, Supplements, Animal Feed, and Personal Care & Cosmetic manufacturers are considered to be end-consumers in the market studied. The scope excludes manufacturers buying liquid/dry whey to be used for application as a binding agent or thickener or other non-protein applications.
- Penetration Rate - Penetration Rate is defined as the percentage of Protein-Fortified End User Market Volume in the Overall End User Market Volume.
- Average Protein Content - Average protein content is the average protein content present per 100 g of product manufactured by all end-user companies considered under the scope of this report.
- End User Market Volume - End-user market volume is the consolidated volume of all types and forms of end-user products in the country or region.
| Keyword | Definition |
|---|---|
| Alpha-lactalbumin (α-Lactalbumin) | It is a protein that regulates the production of lactose in the milk of almost all mammalian species. |
| Amino acid | It is an organic compound that contains both amino and carboxylic acid functional groups, which are required for the synthesis of body protein and other important nitrogen-containing compounds, such as creatine, peptide hormones, and some neurotransmitters. |
| Blanching | It is the process of briefly heating vegetables with steam or boiling water. |
| BRC | British Retail Consortium |
| Bread improver | It is a flour-based blend of several components with specific functional properties designed to modify dough characteristics and give quality attributes to bread. |
| BSF | Black Soldier Fly |
| Caseinate | It is a substance produced by adding an alkali to acid casein, a derivative of casein. |
| Celiac disease | Celiac disease is an immune reaction to eating gluten, a protein found in wheat, barley, and rye. |
| Colostrum | It is a milky fluid that’s released by mammals that have recently given birth before breast milk production begins. |
| Concentrate | It is the least processed form of protein and has a protein content ranging from 40-90% by weight. |
| Dry protein basis | It refers to the percentage of "pure protein" present in a supplement after the water in it is completely removed through heat. |
| Dry whey | It is the product resulting from drying fresh whey which has been pasteurized and to which nothing has been added as a preservative. |
| Egg protein | It is a mixture of individual proteins, including ovalbumin, ovomucoid, ovoglobulin, conalbumin, vitellin, and vitellenin. |
| Emulsifier | It is a food additive that facilitates the blending of foods that are immiscible with one another, such as oil and water. |
| Enrichment | It is the process of addition of micronutrients that are lost during the processing of the product. |
| ERS | Economic Research Service of the USDA |
| Extrusion | It is the process of forcing soft mixed ingredients through an opening in a perforated plate or die designed to produce the required shape. The extruded food is then cut to a specific size by blades. |
| Fava | Also known as Faba, it is another word for yellow split beans. |
| FDA | Food and Drug Administration |
| Flaking | It is a process in which typically a cereal grain (like corn, wheat, or rice) is broken down into grits, cooked with flavors and syrups, and then pressed into flakes between cooled rollers. |
| Foaming agent | It is a food ingredient that makes it possible to form or maintain a uniform dispersion of a gaseous phase in a liquid or solid food. |
| Foodservice | It refers to the part of the food industry which includes businesses, institutions, and companies which prepare meals outside the home. It includes restaurants, school and hospital cafeterias, catering operations, and many other formats. |
| Fortification | It is the deliberate addition of micronutrients that are not found in them naturally or which are lost during processing, to improve a food product's nutritional value. |
| FSANZ | Food Standards Australia New Zealand |
| FSIS | Food Safety and Inspection Service |
| FSSAI | Food Safety and Standards Authority of India |
| Gelling agent | It is an ingredient that functions as a stabilizer and thickener to provide thickening without stiffness through the formation of gel. |
| GHG | Greenhouse Gas |
| Gluten | It is a family of proteins found in grains, including wheat, rye, spelt, and barley. |
| Hemp | It is a botanical class of Cannabis sativa cultivars grown specifically for industrial or medicinal use. |
| Hydrolysate | It is a form of protein manufactured by exposing the protein to enzymes that can partially break the bonds between the protein's amino acids and break down large, complicated proteins into smaller pieces. Its processing makes it easier and quicker to digest. |
| Hypoallergenic | It refers to a substance that causes fewer allergic reactions. |
| Isolate | It is the purest and most processed form of protein which has undergone separation to obtain a pure protein fraction. It typically contains ≥ 90% of protein by weight. |
| Keratin | It is a protein that helps form hair, nails, and the outer layer of skin. |
| Lactalbumin | It is the albumin contained in milk and obtained from whey. |
| Lactoferrin | It is an iron‑binding glycoprotein that is present in the milk of most mammals. |
| Lupin | It is the yellow legume seeds of the genus Lupinus. |
| Millenial | Also known as Generation Y or Gen Y, it refers to the people born from 1981 to 1996. |
| Monogastric | It refers to an animal with a single-compartmented stomach. Examples of monogastric include humans, poultry, pigs, horses, rabbits, dogs, and cats. Most monogastric are generally unable to digest much cellulose food materials such as grasses. |
| MPC | Milk protein concentrate |
| MPI | Milk protein isolate |
| MSPI | Methylated soy protein isolate |
| Mycoprotein | Mycoprotein is a form of single-cell protein, also known as fungal protein, derived from fungi for human consumption. |
| Nutricosmetics | It is a category of products and ingredients that act as nutritional supplements to care for skin, nails, and hair natural beauty. |
| Osteoporosis | It is a medical condition in which the bones become brittle and fragile from loss of tissue, typically as a result of hormonal changes, or deficiency of calcium or vitamin D. |
| PDCAAS | Protein digestibility-corrected amino acid score (PDCAAS) is a method of evaluating the quality of a protein based on both the amino acid requirements of humans and their ability to digest it. |
| Per-capita consumption of animal protein | It is the average amount of animal protein (such as milk, whey, gelatin, collagen, and egg proteins) that is readily available for consumption by each person in an actual population. |
| Per-capita consumption of plant protein | It is the average amount of plant protein (such as soy, wheat, pea, oat, and hemp proteins) that is readily available for consumption by each person in an actual population. |
| Quorn | It is a microbial protein manufactured using mycoprotein as an ingredient, in which the fungus culture is dried and mixed with egg albumen or potato protein, which acts as a binder, and then is adjusted in texture and pressed into various forms. |
| Ready-to-Cook (RTC) | It refers to food products that include all of the ingredients, where some preparation or cooking is required through a process that is given on the package. |
| Ready-to-Eat (RTE) | It refers to a food product prepared or cooked in advance, with no further cooking or preparation required before being eaten. |
| RTD | Ready-to-Drink |
| RTS | Ready-to-Serve |
| Saturated fat | It is a type of fat in which the fatty acid chains have all single bonds. It is generally considered unhealthy. |
| Sausage | It is a meat product made of finely chopped and seasoned meat, which may be fresh, smoked, or pickled and which is then usually stuffed into a casing. |
| Seitan | It is a plant-based meat substitute made out of wheat gluten. |
| Softgel | It is a gelatin-based capsule with a liquid fill. |
| SPC | Soy protein concentrate |
| SPI | Soy protein isolate |
| Spirulina | It is a biomass of cyanobacteria that can be consumed by humans and animals. |
| Stabilizer | It is an ingredient added to food products to help maintain or enhance their original texture, and physical and chemical characteristics. |
| Supplementation | It is the consumption or provision of concentrated sources of nutrients or other substances that are intended to supplement nutrients in the diet and is intended to correct nutritional deficiencies. |
| Texturant | It is a specific type of food ingredient that is used to control and alter the mouthfeel and texture of food and beverage products. |
| Thickener | It is an ingredient that is used to increase the viscosity of a liquid or dough and make it thicker, without substantially changing its other properties. |
| Trans fat | Also called trans-unsaturated fatty acids or trans fatty acids, it is a type of unsaturated fat that naturally occurs in small amounts in meat. |
| TSP | Textured soy protein |
| TVP | Textured vegetable protein |
| WPC | Whey protein concentrate |
| WPI | Whey protein isolate |


Research Methodology
Mordor Intelligence follows a four-step methodology in all our reports.
- Step-1: Identify Key Variables: The quantifiable key variables (industry and extraneous) pertaining to the specific product segment and country are selected from a group of relevant variables & factors based on desk research & literature review; along with primary expert inputs. These variables are further confirmed through regression modeling (wherever required).
- Step-2: Build a Market Model: In order to build a robust forecasting methodology, the variables and factors identified in Step-1 are tested against available historical market numbers. Through an iterative process, the variables required for market forecast are set and the model is built on the basis of these variables.
- Step-3: Validate and Finalize: In this important step, all market numbers, variables and analyst calls are validated through an extensive network of primary research experts from the market studied. The respondents are selected across levels and functions to generate a holistic picture of the market studied.
- Step-4: Research Outputs: Syndicated Reports, Custom Consulting Assignments, Databases & Subscription Platforms


