Market Overview
| Study Period | 2021 - 2031 |
|---|---|
| Forecast Data Period | 2026 - 2031 |
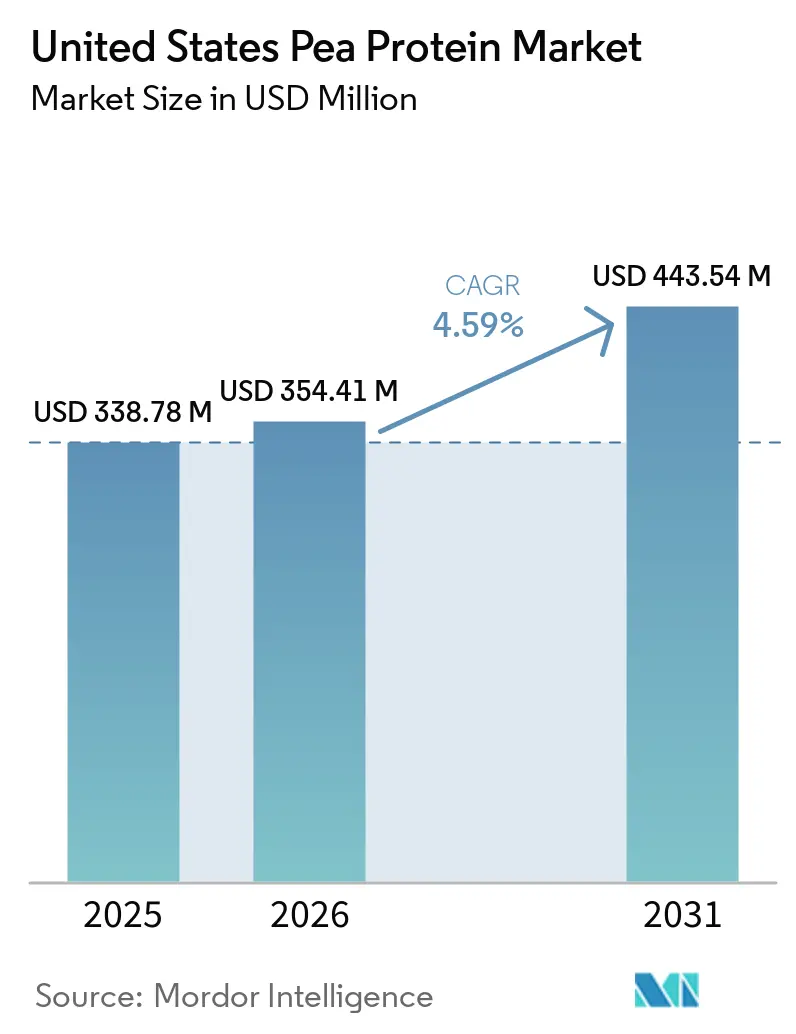
| Base Year Market Size (2025) | USD 338.78 Million |
| Market Size (2026) | USD 354.41 Million |
| Market Size (2031) | USD 443.54 Million |
| Growth Rate (2026 - 2031) | 4.59% CAGR |
| Market Concentration | Medium |
Major Players
*Disclaimer: Major Players sorted in no particular order Image © Mordor Intelligence. Reuse requires attribution under CC BY 4.0. |
|
United States Pea Protein Market Analysis by Mordor Intelligence
The United States pea protein market size was valued at USD 338.78 million in 2025 and estimated to grow from USD 354.41 million in 2026 to reach USD 443.54 million by 2031, at a CAGR of 4.59% during the forecast period (2026-2031). This growth is primarily driven by the rising consumer preference for plant-based and clean-label protein sources, as health-conscious consumers increasingly seek natural, minimally processed ingredients with transparent labeling. The growing popularity of vegetarian, vegan, and flexitarian lifestyles in the United States is significantly accelerating the adoption of pea protein across multiple food categories. Its expanding incorporation in meat alternatives, dairy-free beverages, plant-based yogurts, protein bars, ready-to-drink shakes, and sports nutrition products continues to broaden its application base. Moreover, manufacturers are actively investing in advanced processing technologies and formulation improvements to enhance taste, texture, solubility, and overall functionality, addressing earlier concerns related to flavor and mouthfeel.
Key Report Takeaways
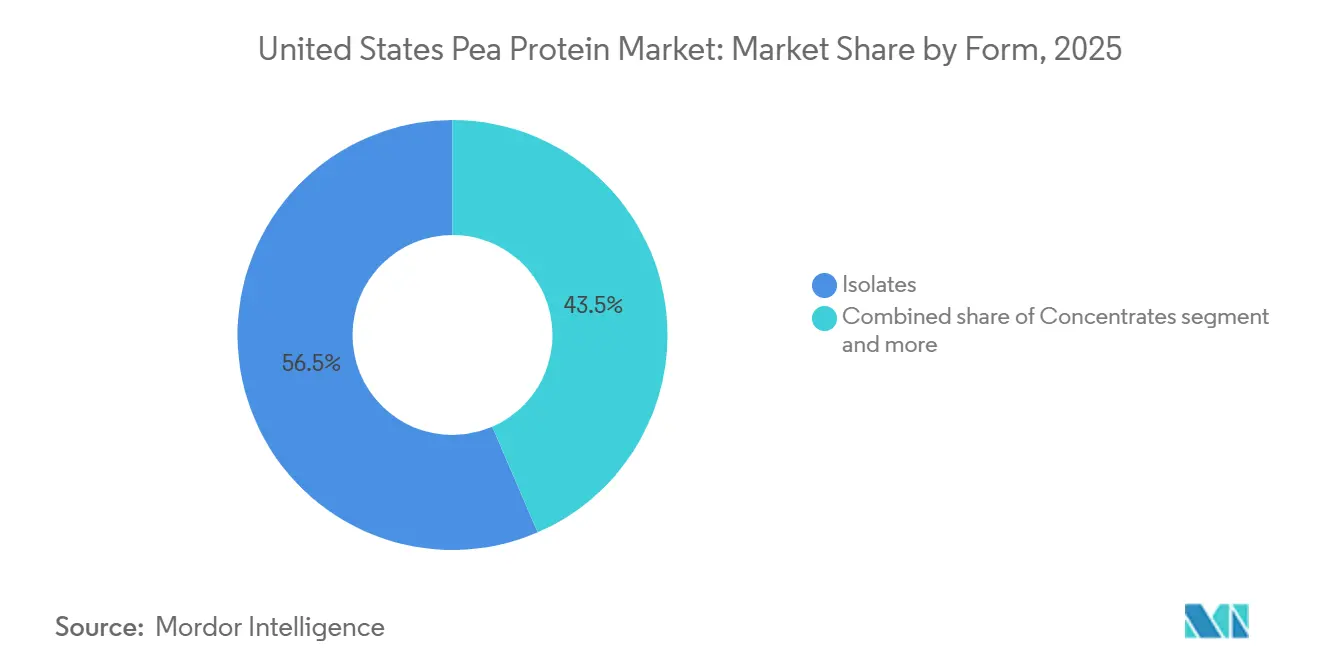
- By form, isolates led with 56.49% revenue share in 2025, whereas concentrates are forecast to advance at a 5.04% CAGR to 2031.
- By nature, conventional grades accounted for 79.38% of 2025 revenue, while organic variants are set to grow at a 5.89% CAGR through 2031.
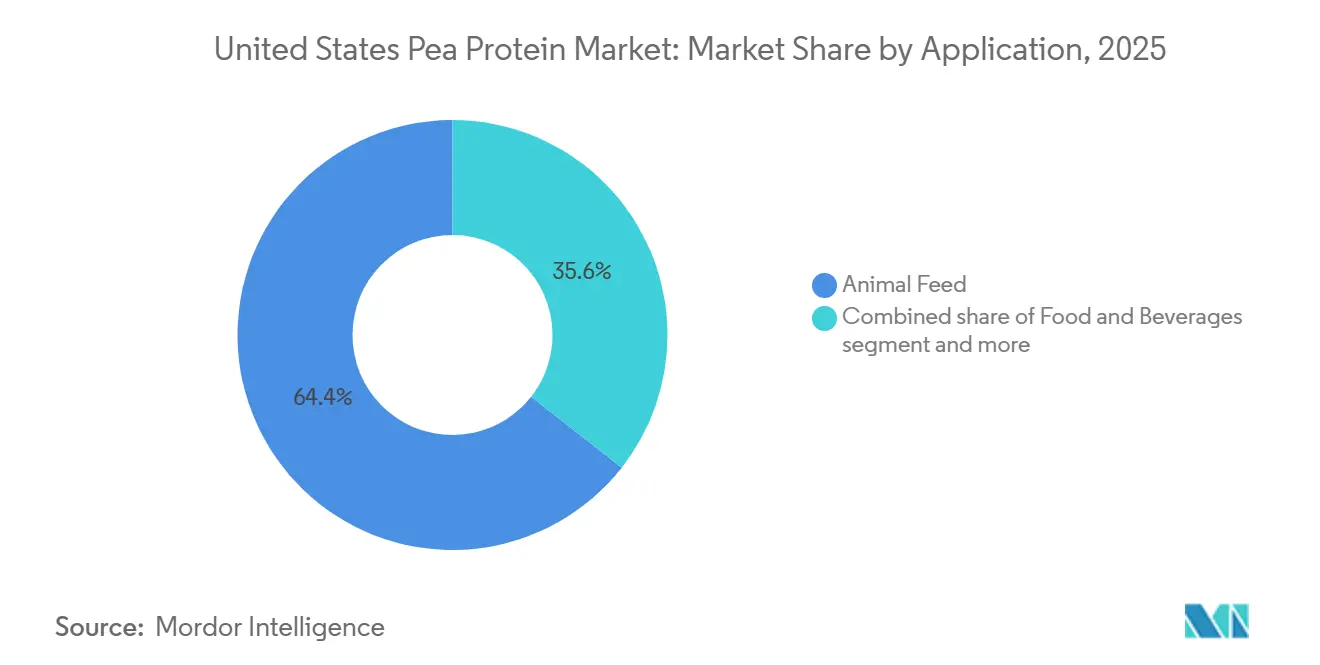
- By application, animal feed held 64.41% of the United States pea protein market share in 2025, and supplements represent the fastest-growing segment with a 5.58% CAGR to 2031.
Note: Market size and forecast figures in this report are generated using Mordor Intelligence’s proprietary estimation framework, updated with the latest available data and insights as of 2026.
United States Pea Protein Market Trends and Insights
Drivers Impact Analysis*
| Driver | (~) % Impact on CAGR Forecast | Geographic Relevance | Impact Timeline |
|---|---|---|---|
| Growing adoption of plant-based and flexitarian diets | +1.2% | National, with concentration in coastal urban centers and college towns | Medium term (2-4 years) |
| Consumer preference for clean and transparent labeling | +0.8% | National, strongest in Northeast and Pacific regions | Short term (≤ 2 years) |
| Strong demand from sports nutrition and protein supplements | +1.0% | National, with early gains in California, Texas, Florida | Medium term (2-4 years) |
| Rising health and wellness awareness among consumers | +0.7% | National, accelerating in suburban and affluent demographics | Long term (≥ 4 years) |
| Increasing use in meat alternatives and plant-based foods | +0.6% | National, led by metropolitan areas and foodservice channels | Medium term (2-4 years) |
| Sustainability and environmental benefits of pea cultivation | +0.5% | National, with regulatory influence from USDA conservation programs | Long term (≥ 4 years) |
| Source: Mordor Intelligence | |||


Growing adoption of plant-based and flexitarian diets
The growing adoption of plant-based and flexitarian diets in the United States is significantly boosting the demand for pea protein. According to the Good Food Institute Report, around 60% of U.S. households purchased some type of plant-based food in 2024, reflecting a strong shift toward plant-forward eating habits[1]Source: Good Food Institute, “U.S. retail market insights for the plant-based industry”, gfi.org. Consumers are increasingly seeking alternatives to animal-based proteins due to health, environmental, and ethical considerations, which has created a wider market for pea protein products. Pea protein is particularly favored for its allergen-free nature, neutral taste, and versatility across applications such as beverages, meat substitutes, and nutritional supplements. Food and beverage manufacturers are responding by incorporating pea protein into a range of products, from protein shakes to snack bars. As more households include plant-based items in their regular diet, the United States pea protein market is poised for steady growth over the coming years.
Consumer preference for clean and transparent labeling
Consumer preference for clean and transparent labeling is shaping purchasing decisions in the United States pea protein market. According to the 2024 IFIC Food & Health Survey, foods labeled as “Natural,” “Organic,” or “Healthy” rank among the top in-store signals, with 36% of American consumers preferring such labels[2]Source: International Food Information Council, “2024 IFIC Food & Health SURVEY”, ific.org. This trend reflects growing demand for products with clear ingredient lists, non-GMO certifications, and minimal processing. Manufacturers are increasingly focusing on clean-label formulations to meet these expectations, which influences product development and marketing strategies. Pea protein, being allergen-free and plant-based, aligns well with these preferences, allowing companies to appeal to health-conscious and environmentally aware consumers. Transparent labeling also builds trust and encourages repeat purchases, especially in the premium and functional foods segments.
Strong demand from sports nutrition and protein supplements
The United States pea protein market is experiencing strong growth due to rising demand in protein supplements and sports nutrition. For example, according to the Health & Fitness Association, nearly 77 million Americans utilized fitness facilities in 2024, highlighting a substantial consumer base focused on health, fitness, and performance[3]Source: Health & Fitness Association, "2025 US Health & Fitness Consumer Report" healthandfitness.org. These individuals increasingly turn to pea protein as a plant-based, allergen-free alternative to traditional whey and soy proteins to support muscle recovery, endurance, and overall wellness. Its high protein content, neutral taste, and easy digestibility make it ideal for protein powders, meal replacements, and ready-to-drink shakes. Sports nutrition brands are expanding their product lines to include pea protein formulations, responding to consumer preference for vegan and clean-label options. The growing emphasis on functional foods and active lifestyles further drives the incorporation of pea protein in supplements.
Rising health and wellness awareness among consumers
Rising health and wellness awareness among consumers is significantly influencing the United States pea protein market. More individuals are prioritizing balanced diets, nutrient-rich foods, and plant-based alternatives to support overall well-being. Pea protein, being high in protein, low in allergens, and easily digestible, aligns well with these consumer priorities. It is increasingly incorporated into snacks, beverages, meal replacements, and functional foods aimed at promoting fitness, weight management, and general health. The trend toward preventive healthcare and lifestyle-focused nutrition encourages manufacturers to develop products that emphasize natural, clean-label, and sustainable ingredients. Additionally, educational campaigns and media coverage about the benefits of plant-based proteins further drive consumer interest.
Restraints Impact Analysis*
| Restraint | (~) % Impact on CAGR Forecast | Geographic Relevance | Impact Timeline |
|---|---|---|---|
| Higher production and processing costs than conventional proteins | -0.9% | National, most acute in regions distant from Upper Midwest processing hubs | Short term (≤ 2 years) |
| Price sensitivity among mass-market consumers | -0.6% | National, concentrated in value retail channels and foodservice | Medium term (2-4 years) |
| Raw material supply volatility and dependence on pea harvests | -0.5% | National, with acute exposure in Montana and North Dakota production zones | Short term (≤ 2 years) |
| Taste and flavor challenges in certain food applications | -0.7% | National, most pronounced in beverage and dairy-alternative segments | Medium term (2-4 years) |
| Source: Mordor Intelligence | |||
Higher production and processing costs than conventional proteins
Higher production and processing costs compared to conventional proteins are limiting the widespread adoption of pea protein in the United States market. Extracting and refining pea protein into isolates and concentrates requires specialized equipment and energy-intensive processes, which increase manufacturing expenses. These higher costs are often reflected in the final product price, making pea protein less competitive against traditional proteins like soy, whey, and casein. Small and medium-sized food manufacturers may face budget constraints when incorporating pea protein into their formulations. Additionally, fluctuations in raw material availability and quality can further drive up production costs. While consumer demand for plant-based proteins is growing, price sensitivity among mainstream buyers continues to influence purchasing decisions.
Price sensitivity among mass-market consumers
Price sensitivity among mass-market consumers is affecting the adoption of pea protein in the United States. While pea protein offers health and functional benefits, its higher cost compared to conventional proteins can make it less attractive to budget-conscious buyers. Many consumers in the mainstream segment prioritize affordability over specialty attributes, limiting large-scale penetration in everyday food and beverage products. This sensitivity can influence purchasing decisions for items such as protein bars, shakes, and snacks where price plays a key role. Retailers and manufacturers must balance product quality with competitive pricing to appeal to this demographic. Additionally, promotional strategies and value-pack offerings are often required to encourage trial and repeat purchases. As a result, price-conscious consumer behavior can slow market growth and restrict adoption in cost-sensitive applications.
*Our forecasts treat driver/restraint impacts as directional, not additive. The impact forecasts reflect baseline growth, mix effects, and variable interactions.
Segment Analysis
By Form: Isolates Dominate, Concentrates Accelerate
Pea protein isolates accounted for the largest share of the United States pea protein market in 2025, capturing 56.49% of total revenue, primarily due to their high protein concentration and functional advantages. With protein purity levels typically ranging between 85–90%, isolates are widely preferred in applications requiring consistent nutritional value and clean sensory attributes. Their neutral taste profile and excellent solubility make them especially suitable for ready-to-drink protein beverages, nutritional powders, and medical nutrition products. Isolates are also extensively used in infant formula and clinical nutrition, where digestibility and allergen-free characteristics are critical. Food and beverage manufacturers increasingly favor isolates for premium and performance-driven formulations.
Pea protein concentrates are projected to be the fastest growing segment in the market, registering a CAGR of 5.04% during the forecast period (2026-2031). Growth is largely driven by their cost-effectiveness compared to isolates, making them attractive for price-sensitive and high-volume applications. Concentrates are increasingly adopted in bakery, snacks, cereals, and meat analog formulations where moderate protein enrichment is sufficient. Their relatively lower processing intensity also aligns with clean-label and minimally processed ingredient trends. Additionally, food manufacturers are leveraging concentrates to balance functionality and affordability without compromising on plant-based positioning.


By Nature: Conventional Leads, Organic Surges
Conventional grades dominated the United States pea protein market in 2025, accounting for 79.38% of total revenue, supported by their widespread availability and cost advantages. These products are extensively used across mainstream food and beverage applications, including bakery products, snacks, beverages, and meat alternatives. Conventional pea protein benefits from established supply chains and large-scale production capabilities, which help manufacturers maintain consistent quality and pricing. Food processors often prefer conventional variants for high-volume formulations where affordability and functional reliability are key considerations. The segment also enjoys strong demand from sports nutrition and general wellness products aimed at mass-market consumers.
Organic pea protein is expected to be the fastest growing segment in the United States market, expanding at a CAGR of 5.89% through 2031. Growth is driven by rising consumer preference for organic, non-GMO, and clean-label food ingredients. Increasing awareness around sustainable agriculture and chemical-free farming practices is further supporting demand for organic variants. Organic pea protein is gaining traction in premium plant-based foods, nutritional supplements, and infant nutrition products. Although organic variants carry higher prices, consumers are increasingly willing to pay for perceived health and environmental benefits. Continued expansion of organic-certified product lines and retail availability is expected to accelerate segment growth during the forecast period.
By Application: Animal Feed Dominates, Supplements Surge
By application, animal feed dominated the United States pea protein market in 2025, accounting for 64.41% of total market share, driven by its growing use as a sustainable plant-based protein source in livestock and pet nutrition. Pea protein is increasingly incorporated into feed formulations due to its favorable amino acid profile and high digestibility. Feed manufacturers value pea protein as an alternative to soy-based ingredients, particularly amid concerns related to allergens and price volatility. Its compatibility with poultry, aquaculture, and companion animal diets further supports widespread adoption. The segment also benefits from rising demand for plant-based and clean-label pet food products.
The supplements segment is projected to be the fastest growing application in the United States pea protein market, registering a CAGR of 5.58% through 2031. Growth is fueled by increasing consumer focus on fitness, active lifestyles, and protein-enriched diets. Pea protein is widely used in protein powders, meal replacements, and functional nutrition products due to its allergen-free and vegan-friendly attributes. The segment is further supported by rising adoption among lactose-intolerant and health-conscious consumers. Product innovation, including improved flavor masking and enhanced solubility, is expanding its use in nutritional supplements. As demand for plant-based sports and wellness nutrition continues to rise, the supplements segment is expected to experience sustained growth over the forecast period.
Geography Analysis
The United States pea protein market shows significant regional diversity, with production and consumption patterns influenced by agricultural capacity and consumer preferences. The Midwest region, known as the nation’s primary pea-growing area, accounts for a substantial portion of domestic pea cultivation. States such as North Dakota, Montana, and Minnesota have favorable climatic conditions and soil quality that support high-yield pea farming, ensuring a steady supply of raw materials for protein extraction. This region also benefits from well-established processing infrastructure, enabling manufacturers to produce isolates and concentrates efficiently. The availability of locally sourced raw materials helps reduce transportation costs and ensures consistent quality, making the Midwest a strategic hub for the pea protein industry.
The Western and Southern regions of the United States are emerging as key consumption markets, driven by growing demand in foodservice, retail, and supplements. Urban centers such as Los Angeles, New York, and Chicago show high adoption of plant-based diets, fueling the use of pea protein in snacks, beverages, and meat alternatives. Health-conscious and flexitarian consumers in these regions prefer allergen-free, sustainable, and clean-label protein options, which has increased market penetration.
The Northeastern and Southeastern U.S. markets are witnessing gradual growth due to increased awareness of plant-based nutrition and environmental sustainability. Retail and e-commerce channels are expanding in these regions, offering greater accessibility to pea protein products. Institutional adoption in schools, hospitals, and corporate cafeterias is also contributing to demand. Organic and specialty product lines are gaining popularity in high-income urban centers, reflecting consumer willingness to pay a premium for quality and sustainability.
Competitive Landscape
The United States pea protein market is highly consolidated, with a limited number of key players controlling a significant share of production and distribution. Major companies, including Archer Daniels Midland Company, Cargill, Incorporated and Roquette Frères, dominate the market through established manufacturing capacities, extensive supply networks, and strong brand recognition. These companies leverage their technological expertise to produce high-quality pea protein isolates and concentrates that meet the diverse needs of food, beverage, and supplement manufacturers. The consolidation allows leading players to maintain pricing power and influence market standards, particularly regarding protein purity, solubility, and functional performance.
Market competition is primarily driven by product innovation and functional differentiation. Companies are investing heavily in research and development to improve taste, texture, and solubility of pea protein, catering to applications ranging from ready-to-drink beverages to infant nutrition. Collaborations and strategic partnerships between ingredient manufacturers and foodservice brands further strengthen competitive positioning. Leading players also focus on clean-label, non-GMO, and allergen-free certifications to meet consumer preferences, creating additional differentiation.
Despite the dominance of key players, emerging trends offer opportunities for new entrants and niche brands. Specialty organic pea protein variants and innovative blends for sports nutrition and functional foods are gaining traction. Smaller companies and startups are targeting premium and health-conscious consumer segments, often focusing on sustainability and traceability as key selling points. However, the consolidated nature of the market means that competitive pressure remains high, requiring continuous product innovation, strategic partnerships, and marketing investments to capture and retain market share.
United States Pea Protein Industry Leaders
-
Archer Daniels Midland Company
-
Kerry Group PLC
-
Bunge Global SA
-
Cargill, Incorporated
-
Ingredion Incorporated
- *Disclaimer: Major Players sorted in no particular order

Recent Industry Developments
- January 2025: Axiom Foods launched Vegotein N Neutral, a pea protein ingredient, to address the rising demand for plant-based proteins in the market. This product, derived from yellow non-GMO peas, offers an 80% protein concentration and is fully digestible, making it a suitable choice for various applications.
- December 2024: Burcon NutraScience unveiled Peazazz C, a pea protein concentrate tailored for high-moisture extrusion in meat alternatives. Boasting a 15% superior water-holding capacity compared to rival concentrates, Peazazz C promises juicier plant-based patties and sausages. The product is aimed at food manufacturers in search of clean-label texturizers.
- April 2024: Ingredion rolled out VITESSENCE Pea 200 D, a textured pea protein concentrate crafted for plant-based nuggets and tenders. Utilizing twin-screw extrusion to align protein fibrils, the product achieves a chew profile that sensory panels rated within 10% of traditional poultry. Priced at USD 5-6 per kilogram, it strategically undercuts isolates.


United States Pea Protein Market Report Scope
Pea protein is a high-quality, plant-based protein powder made from yellow split peas, popular in vegan, dairy-free, and allergen-friendly diets, valued for its digestibility, iron content, and essential amino acids. The United States pea protein market is segmented by form, nature, and application. By form, the market is segmented into concentrates, isolates, and textured/hydrolyzed. By nature, the market is segmented into conventional and organic. By application, the market is segmented into animal feed, personal care and cosmetics, food and beverages, and Supplements. The Market Forecasts are Provided in Terms of Value (USD) and Volume (Tons).
By Form
| Concentrates |
| Isolates |
| Textured/Hydrolyzed |
By Nature
| Conventional |
| Organic |
By Application
| Animal Feed | |
| Personal Care and Cosmetics | |
| Food and Beverages | Bakery |
| Beverages | |
| Breakfast Cereals | |
| Condiments/Sauces | |
| Dairy and Dairy Alternative Products | |
| Meat/Poultry/Seafood and Meat Alternative Products | |
| RTE/RTC Food Products | |
| Snacks | |
| Supplements | Baby Food and Infant Formula |
| Elderly Nutrition and Medical Nutrition | |
| Sport/Performance Nutrition |
| By Form | Concentrates | |
| Isolates | ||
| Textured/Hydrolyzed | ||
| By Nature | Conventional | |
| Organic | ||
| By Application | Animal Feed | |
| Personal Care and Cosmetics | ||
| Food and Beverages | Bakery | |
| Beverages | ||
| Breakfast Cereals | ||
| Condiments/Sauces | ||
| Dairy and Dairy Alternative Products | ||
| Meat/Poultry/Seafood and Meat Alternative Products | ||
| RTE/RTC Food Products | ||
| Snacks | ||
| Supplements | Baby Food and Infant Formula | |
| Elderly Nutrition and Medical Nutrition | ||
| Sport/Performance Nutrition | ||


Market Definition
- End User - The Protein Ingredients Market operates on a B2B basis. Food, Beverages, Supplements, Animal Feed, and Personal Care & Cosmetic manufacturers are considered to be end-consumers in the market studied. The scope excludes manufacturers buying liquid/dry whey to be used for application as a binding agent or thickener or other non-protein applications.
- Penetration Rate - Penetration Rate is defined as the percentage of Protein-Fortified End User Market Volume in the Overall End User Market Volume.
- Average Protein Content - Average protein content is the average protein content present per 100 g of product manufactured by all end-user companies considered under the scope of this report.
- End User Market Volume - End-user market volume is the consolidated volume of all types and forms of end-user products in the country or region.
| Keyword | Definition |
|---|---|
| Alpha-lactalbumin (α-Lactalbumin) | It is a protein that regulates the production of lactose in the milk of almost all mammalian species. |
| Amino acid | It is an organic compound that contains both amino and carboxylic acid functional groups, which are required for the synthesis of body protein and other important nitrogen-containing compounds, such as creatine, peptide hormones, and some neurotransmitters. |
| Blanching | It is the process of briefly heating vegetables with steam or boiling water. |
| BRC | British Retail Consortium |
| Bread improver | It is a flour-based blend of several components with specific functional properties designed to modify dough characteristics and give quality attributes to bread. |
| BSF | Black Soldier Fly |
| Caseinate | It is a substance produced by adding an alkali to acid casein, a derivative of casein. |
| Celiac disease | Celiac disease is an immune reaction to eating gluten, a protein found in wheat, barley, and rye. |
| Colostrum | It is a milky fluid that’s released by mammals that have recently given birth before breast milk production begins. |
| Concentrate | It is the least processed form of protein and has a protein content ranging from 40-90% by weight. |
| Dry protein basis | It refers to the percentage of "pure protein" present in a supplement after the water in it is completely removed through heat. |
| Dry whey | It is the product resulting from drying fresh whey which has been pasteurized and to which nothing has been added as a preservative. |
| Egg protein | It is a mixture of individual proteins, including ovalbumin, ovomucoid, ovoglobulin, conalbumin, vitellin, and vitellenin. |
| Emulsifier | It is a food additive that facilitates the blending of foods that are immiscible with one another, such as oil and water. |
| Enrichment | It is the process of addition of micronutrients that are lost during the processing of the product. |
| ERS | Economic Research Service of the USDA |
| Extrusion | It is the process of forcing soft mixed ingredients through an opening in a perforated plate or die designed to produce the required shape. The extruded food is then cut to a specific size by blades. |
| Fava | Also known as Faba, it is another word for yellow split beans. |
| FDA | Food and Drug Administration |
| Flaking | It is a process in which typically a cereal grain (like corn, wheat, or rice) is broken down into grits, cooked with flavors and syrups, and then pressed into flakes between cooled rollers. |
| Foaming agent | It is a food ingredient that makes it possible to form or maintain a uniform dispersion of a gaseous phase in a liquid or solid food. |
| Foodservice | It refers to the part of the food industry which includes businesses, institutions, and companies which prepare meals outside the home. It includes restaurants, school and hospital cafeterias, catering operations, and many other formats. |
| Fortification | It is the deliberate addition of micronutrients that are not found in them naturally or which are lost during processing, to improve a food product's nutritional value. |
| FSANZ | Food Standards Australia New Zealand |
| FSIS | Food Safety and Inspection Service |
| FSSAI | Food Safety and Standards Authority of India |
| Gelling agent | It is an ingredient that functions as a stabilizer and thickener to provide thickening without stiffness through the formation of gel. |
| GHG | Greenhouse Gas |
| Gluten | It is a family of proteins found in grains, including wheat, rye, spelt, and barley. |
| Hemp | It is a botanical class of Cannabis sativa cultivars grown specifically for industrial or medicinal use. |
| Hydrolysate | It is a form of protein manufactured by exposing the protein to enzymes that can partially break the bonds between the protein's amino acids and break down large, complicated proteins into smaller pieces. Its processing makes it easier and quicker to digest. |
| Hypoallergenic | It refers to a substance that causes fewer allergic reactions. |
| Isolate | It is the purest and most processed form of protein which has undergone separation to obtain a pure protein fraction. It typically contains ≥ 90% of protein by weight. |
| Keratin | It is a protein that helps form hair, nails, and the outer layer of skin. |
| Lactalbumin | It is the albumin contained in milk and obtained from whey. |
| Lactoferrin | It is an iron‑binding glycoprotein that is present in the milk of most mammals. |
| Lupin | It is the yellow legume seeds of the genus Lupinus. |
| Millenial | Also known as Generation Y or Gen Y, it refers to the people born from 1981 to 1996. |
| Monogastric | It refers to an animal with a single-compartmented stomach. Examples of monogastric include humans, poultry, pigs, horses, rabbits, dogs, and cats. Most monogastric are generally unable to digest much cellulose food materials such as grasses. |
| MPC | Milk protein concentrate |
| MPI | Milk protein isolate |
| MSPI | Methylated soy protein isolate |
| Mycoprotein | Mycoprotein is a form of single-cell protein, also known as fungal protein, derived from fungi for human consumption. |
| Nutricosmetics | It is a category of products and ingredients that act as nutritional supplements to care for skin, nails, and hair natural beauty. |
| Osteoporosis | It is a medical condition in which the bones become brittle and fragile from loss of tissue, typically as a result of hormonal changes, or deficiency of calcium or vitamin D. |
| PDCAAS | Protein digestibility-corrected amino acid score (PDCAAS) is a method of evaluating the quality of a protein based on both the amino acid requirements of humans and their ability to digest it. |
| Per-capita consumption of animal protein | It is the average amount of animal protein (such as milk, whey, gelatin, collagen, and egg proteins) that is readily available for consumption by each person in an actual population. |
| Per-capita consumption of plant protein | It is the average amount of plant protein (such as soy, wheat, pea, oat, and hemp proteins) that is readily available for consumption by each person in an actual population. |
| Quorn | It is a microbial protein manufactured using mycoprotein as an ingredient, in which the fungus culture is dried and mixed with egg albumen or potato protein, which acts as a binder, and then is adjusted in texture and pressed into various forms. |
| Ready-to-Cook (RTC) | It refers to food products that include all of the ingredients, where some preparation or cooking is required through a process that is given on the package. |
| Ready-to-Eat (RTE) | It refers to a food product prepared or cooked in advance, with no further cooking or preparation required before being eaten. |
| RTD | Ready-to-Drink |
| RTS | Ready-to-Serve |
| Saturated fat | It is a type of fat in which the fatty acid chains have all single bonds. It is generally considered unhealthy. |
| Sausage | It is a meat product made of finely chopped and seasoned meat, which may be fresh, smoked, or pickled and which is then usually stuffed into a casing. |
| Seitan | It is a plant-based meat substitute made out of wheat gluten. |
| Softgel | It is a gelatin-based capsule with a liquid fill. |
| SPC | Soy protein concentrate |
| SPI | Soy protein isolate |
| Spirulina | It is a biomass of cyanobacteria that can be consumed by humans and animals. |
| Stabilizer | It is an ingredient added to food products to help maintain or enhance their original texture, and physical and chemical characteristics. |
| Supplementation | It is the consumption or provision of concentrated sources of nutrients or other substances that are intended to supplement nutrients in the diet and is intended to correct nutritional deficiencies. |
| Texturant | It is a specific type of food ingredient that is used to control and alter the mouthfeel and texture of food and beverage products. |
| Thickener | It is an ingredient that is used to increase the viscosity of a liquid or dough and make it thicker, without substantially changing its other properties. |
| Trans fat | Also called trans-unsaturated fatty acids or trans fatty acids, it is a type of unsaturated fat that naturally occurs in small amounts in meat. |
| TSP | Textured soy protein |
| TVP | Textured vegetable protein |
| WPC | Whey protein concentrate |
| WPI | Whey protein isolate |


Research Methodology
Mordor Intelligence follows a four-step methodology in all our reports.
- Step-1: Identify Key Variables: The quantifiable key variables (industry and extraneous) pertaining to the specific product segment and country are selected from a group of relevant variables & factors based on desk research & literature review; along with primary expert inputs. These variables are further confirmed through regression modeling (wherever required).
- Step-2: Build a Market Model: In order to build a robust forecasting methodology, the variables and factors identified in Step-1 are tested against available historical market numbers. Through an iterative process, the variables required for market forecast are set and the model is built on the basis of these variables.
- Step-3: Validate and Finalize: In this important step, all market numbers, variables and analyst calls are validated through an extensive network of primary research experts from the market studied. The respondents are selected across levels and functions to generate a holistic picture of the market studied.
- Step-4: Research Outputs: Syndicated Reports, Custom Consulting Assignments, Databases & Subscription Platforms


