Market Overview
| Study Period | 2021 - 2031 |
|---|---|
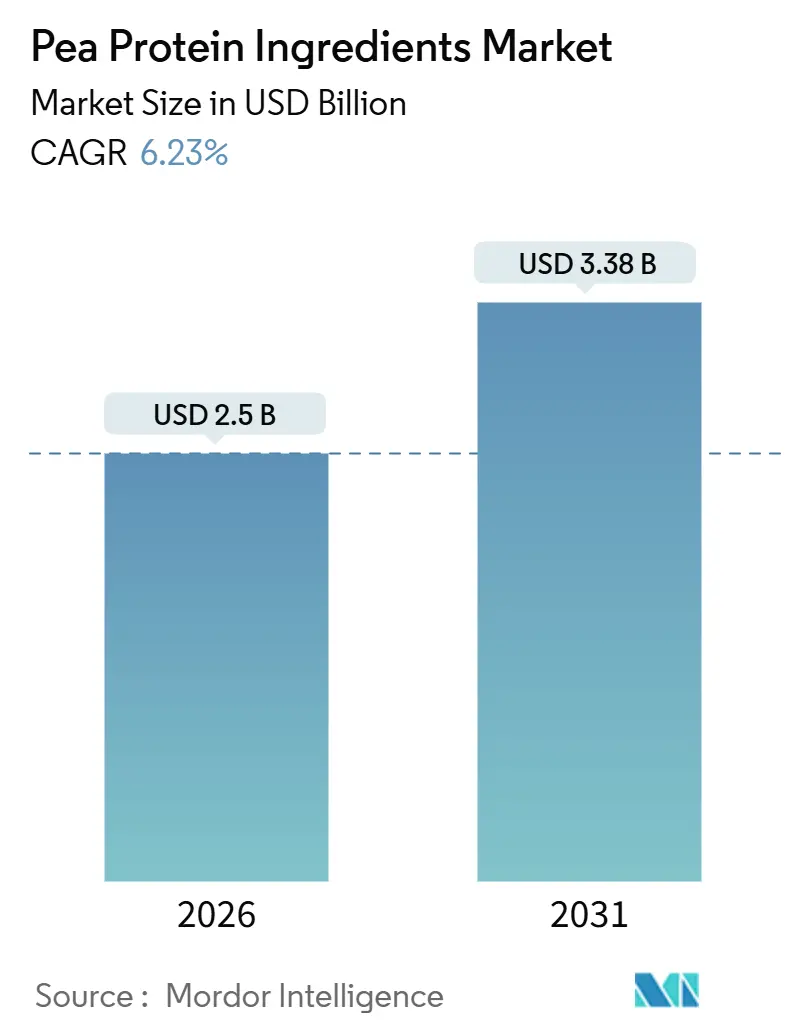
| Market Size (2026) | USD 2.5 Billion |
| Market Size (2031) | USD 3.38 Billion |
| Growth Rate (2026 - 2031) | 6.23% CAGR |
| Fastest Growing Market | Asia Pacific |
| Largest Market | North America |
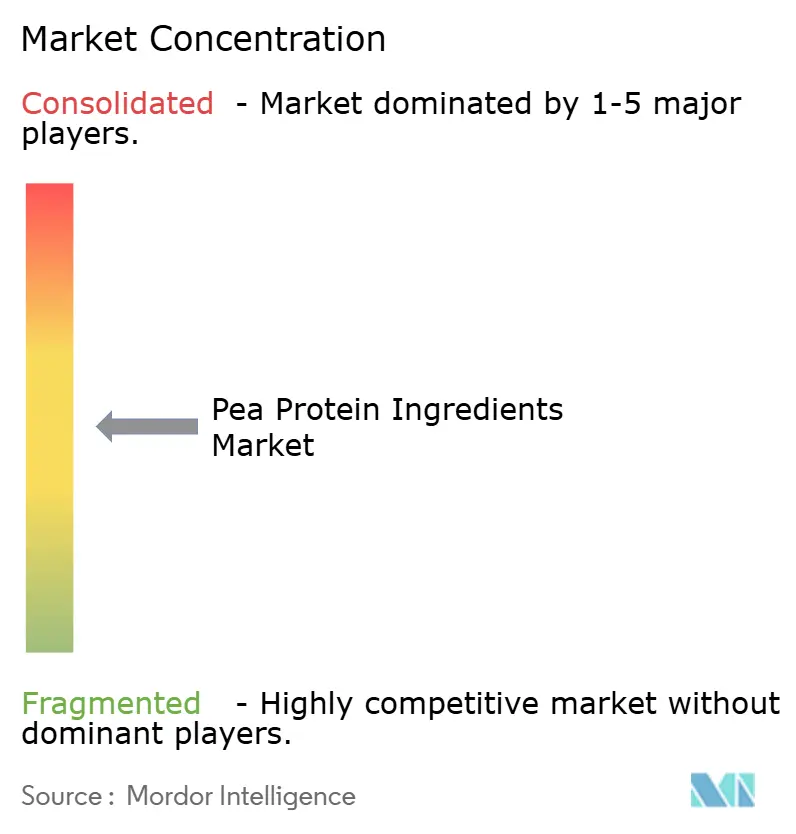
| Market Concentration | Medium |
Major Players*Disclaimer: Major Players sorted in no particular order Image © Mordor Intelligence. Reuse requires attribution under CC BY 4.0. |
|
Pea Protein Ingredients Market Analysis by Mordor Intelligence
The pea protein ingredients market size is estimated at USD 2.5 billion in 2026, and is expected to reach USD 3.38 billion by 2031, at a CAGR of 6.23% during the forecast period (2026-2031). Manufacturers are pivoting toward plant-based ingredients that satisfy evolving food-safety regulations, sustainability mandates, and consumer health expectations. Multiple U.S. FDA GRAS notices granted between 2024 and 2025, including GRN 851 for infant-formula use, reflect regulatory confidence in pea protein’s safety profile[1]Source: U.S Food & Drug Administration, "GRAS Notice Inventory", fda.gov. A PDCAAS of 0.89 positions pea protein as a near-complete source that rivals dairy alternatives in bioavailability. Life-cycle assessments confirm that pea protein generates 89%–93% fewer greenhouse-gas emissions than beef protein, reinforcing corporate Scope 3 reduction strategies[2]Source: American Chemical Society, "Life-Cycle Assessments", pubs.acs.org . Strategic capacity expansions, such as Roquette’s 2025 addition of 20,000 metric tons in Manitoba, signal supplier commitment to scale.
Key Report Takeaways
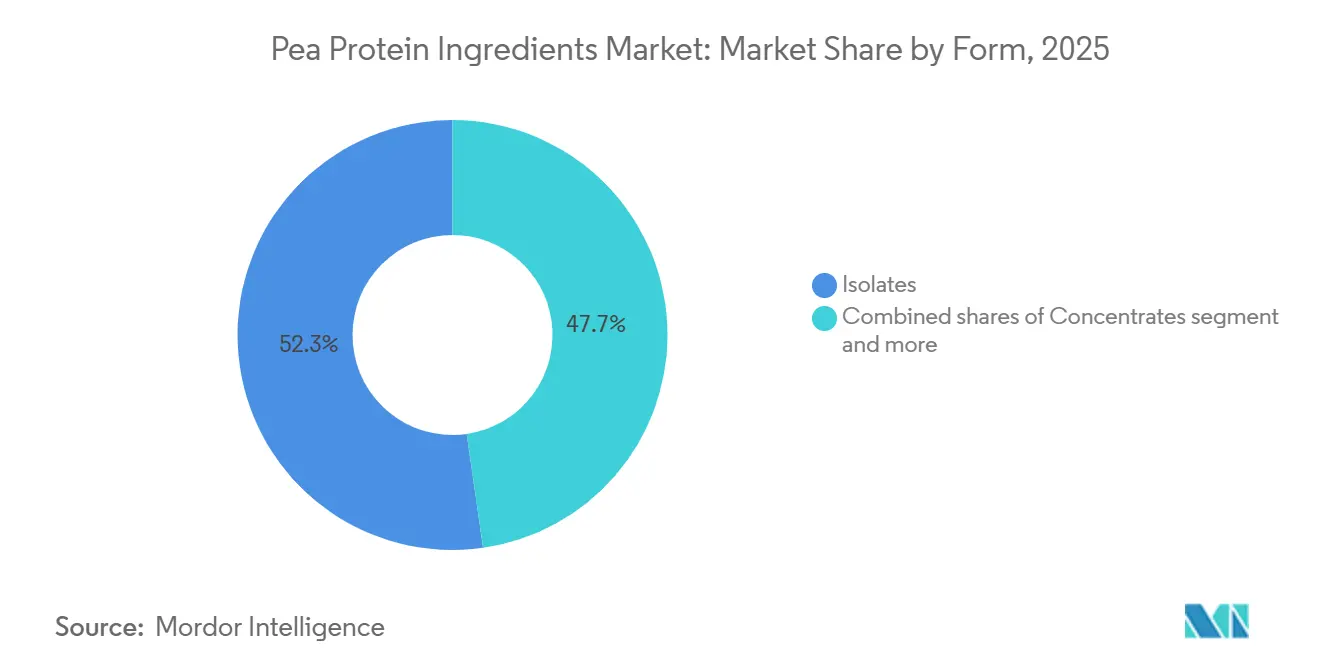
- By form, isolates commanded 52.27% of the pea protein market share in 2025, concentrates are forecast to expand at a 7.99% CAGR to 2031, the fastest among form segments.
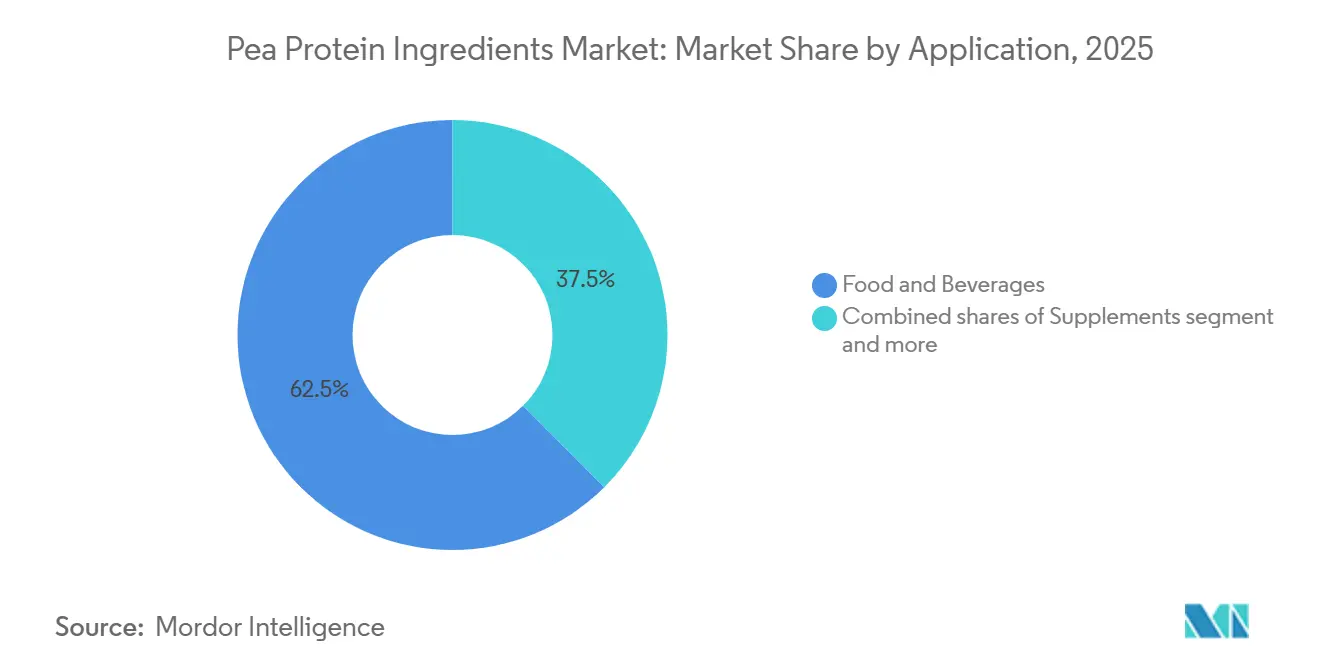
- Within applications, food and beverages led with 62.48% revenue share in 2025; supplements are projected to grow at 7.23% CAGR through 2031.
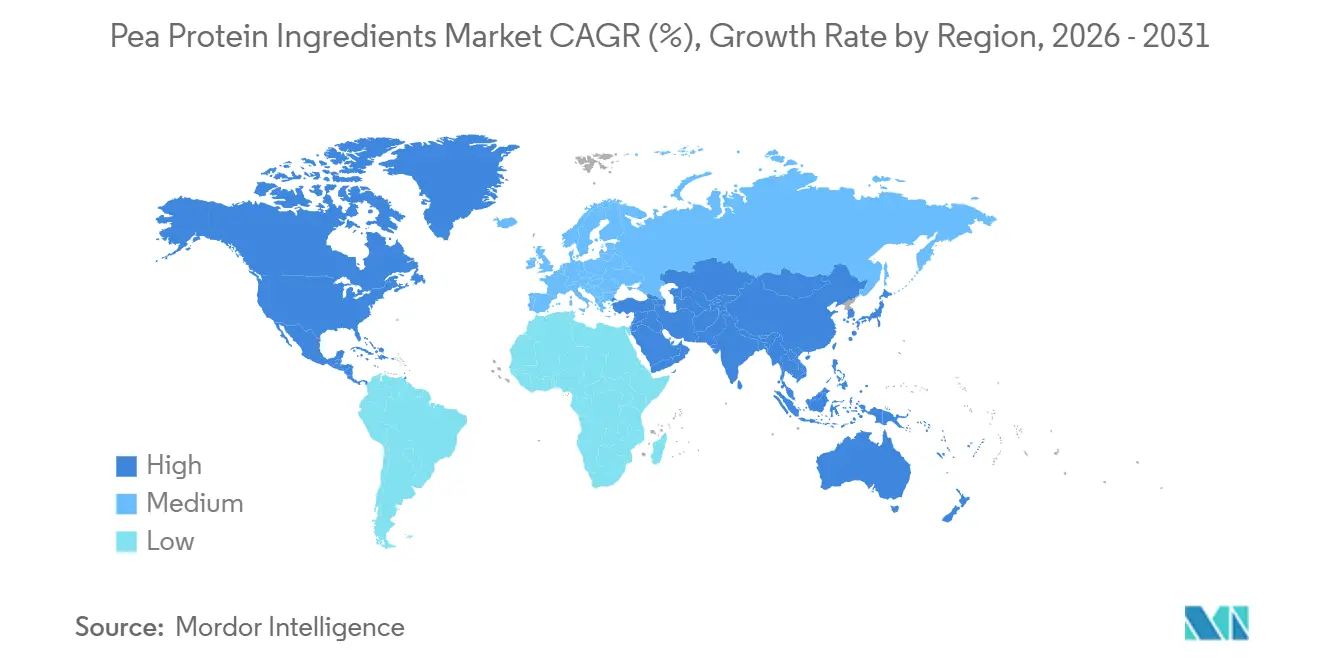
- By geography, North America captured 40.02% of the pea protein market share in 2025, while Asia-Pacific is poised to advance at a 6.87% CAGR between 2026 and 2031.
Note: Market size and forecast figures in this report are generated using Mordor Intelligence’s proprietary estimation framework, updated with the latest available data and insights as of January 2026.
Global Pea Protein Ingredients Market Trends and Insights
Drivers Impact Analysis*
| Driver | (~) % Impact on CAGR Forecast | Geographic Relevance | Impact Timeline |
|---|---|---|---|
| Hypoallergenic profile attracts health-conscious consumers | +1.2% | North America, Europe | Medium term (2-4 years) |
| Vegan and flexitarian diet adoption | +1.5% | Global, strongest in North America, Europe, and APAC urban centers | Long term (≥ 4 years) |
| Sustainable, low-carbon protein alternative | +1.3% | Europe, North America, and expanding in APAC (Asia-Pacific) | Long term (≥ 4 years) |
| Sports-nutrition uptake | +0.9% | North America, Europe, Australia, and emerging in APAC | Medium term (2-4 years) |
| Brand partnerships expedite product launches | +0.7% | North America, Europe | Short term (≤ 2 years) |
| Processing advances improve texture and solubility | +0.6% | Technology diffusion from North America and Europe to Asia | Medium term (2-4 years) |
| Source: Mordor Intelligence | |||
Health-conscious consumers prefer hypoallergenic pea protein
Food allergies affect children worldwide and often persist into adulthood, creating demand for allergen-free protein options. FDA GRN 851, issued in 2024 for infant-formula use, underpins confidence in pea protein’s suitability for sensitive populations. Clinical studies published in 2025 confirmed minimal cross-reactivity with common allergens and highlighted lysine levels that exceed wheat and methionine levels that approach soy. Manufacturers are leveraging this attribute to penetrate medical nutrition and elderly care segments, where protein malnutrition remains prevalent and allergen-free options are limited. The European Food Safety Authority (EFSA) has similarly recognized pea protein's low allergenic potential, facilitating its inclusion in novel food applications across EU member states.
Rising vegan and flexitarian diet adoption
Flexitarian consumers, those who reduce but do not eliminate animal products, represented most of the global population in a 2025 EAT-GlobeScan survey. This demographic shift is reshaping protein demand, with plant-based protein consumption rising faster than population growth in North America, Europe, and urban Asia-Pacific markets. Pea protein's neutral flavor profile relative to soy and its non-GMO status appeal to flexitarians seeking clean-label ingredients. Regulatory frameworks are reinforcing this trend; the EU's Farm to Fork Strategy, part of the Green Deal, explicitly promotes plant protein production to reduce reliance on imported soy and animal feed. China's 2024 dietary guidelines, issued by the National Health Commission, recommend increased legume consumption to address rising obesity and cardiovascular disease rates, indirectly boosting demand for pea protein in processed foods[3]Source: National Health Commission of China, "China's 2024 Dietary Guidelines", en.nhc.gov.cn.
Sustainable protein alternative with low environmental footprint
Life-cycle assessments published in Environmental Science and Technology in 2025 quantified pea protein's greenhouse gas emissions at 0.4 to 0.9 kilograms of CO2-equivalent per kilogram of protein, compared to 35 kilograms for beef protein and 5.5 kilograms for whey protein, according to the Environmental Science and Technology. As awareness grows about the environmental impact of traditional animal-based proteins, pea protein’s credentials, including lower greenhouse gas emissions, reduced water and land use, and nitrogen-fixing crop benefits, make it an attractive choice for companies aiming to meet sustainability goals and consumers seeking environmentally responsible foods. This reduced resource intensity not only aligns with global concerns about climate change and agricultural sustainability but also supports the market’s expansion into a wide range of plant-based foods, beverages, and clean-label products, contributing to robust demand and long-term growth projections in the pea protein sector.
Brand partnerships drive product innovation
Collaborations between pea protein suppliers and food brands are compressing product development cycles and expanding application breadth. Roquette's 2024 partnership with a leading European bakery chain resulted in the launch of high-protein bread rolls containing 15% pea protein isolate, demonstrating the ingredient's functionality in baked goods where texture and moisture retention are critical. Ingredion's co-development agreement with a North American plant-based meat startup, announced in early 2025, focuses on textured pea protein formulations that mimic the fibrous structure of animal muscle tissue. These partnerships provide suppliers with real-time feedback on formulation challenges, enabling iterative improvements in protein solubility, emulsification, and flavor masking.
Restraints Impact Analysis*
| Restraint | (~) % Impact on CAGR Forecast | Geographic Relevance | Impact Timeline |
|---|---|---|---|
| Distinct taste limits consumer acceptance | -0.8% | Global, most acute in Asia-Pacific and emerging markets | Medium term (2-4 years) |
| Seasonal variability affects pea protein supply | -0.5% | North America (Canada), Europe (France), China | Short term (≤ 2 years) |
| High production costs restrict widespread use | -0.6% | Global, particularly in price-sensitive markets (South America, MEA) | Long term (≥ 4 years) |
| Low awareness in certain global regions | -0.4% | Middle East and Africa, parts of South America, rural Asia-Pacific | Long term (≥ 4 years) |
| Source: Mordor Intelligence | |||
Distinct taste limits consumer acceptance
Off-flavor notes in pea protein, variously described as grassy, earthy, or beany, stem from volatile compounds such as hexanal and 1-octen-3-ol, which form during pea seed maturation and persist through conventional processing. Sensory panels conducted in 2024 identified these flavors as the primary barrier to consumer acceptance in neutral applications like protein waters and unflavored shakes. Fermentation-based flavor masking, in which lactic acid bacteria metabolize off-flavor precursors, reduced hexanal levels in laboratory trials, but commercial adoption remains limited due to longer processing times and higher costs. Until these solutions scale, manufacturers are compensating with heavy flavoring in chocolate, vanilla, and fruit-based formulations, which constrains pea protein's penetration into savory and clean-label categories.
Seasonal variability affects pea protein supply
Yellow peas, the primary feedstock for pea protein, are cultivated in temperate climates with a single annual harvest in major producing regions, Canada (Saskatchewan and Alberta), France, and northern China. Harvest timing concentrates in July through September in the Northern Hemisphere, creating supply bottlenecks when downstream demand spikes or weather disrupts yields. Statistics Canada reported that the 2024 pea harvest fell 18% short of the previous year due to drought conditions in Saskatchewan, tightening raw material availability and pushing spot prices for yellow peas up by 22% in the fourth quarter. Processors with limited storage capacity faced production interruptions, while those holding multi-month inventories gained pricing power. Diversifying cultivation to Southern Hemisphere origins or investing in controlled-environment agriculture could mitigate this risk, though neither solution is economically viable at current pea protein price points.
*Our forecasts treat driver/restraint impacts as directional, not additive. The impact forecasts reflect baseline growth, mix effects, and variable interactions.
Segment Analysis
By Form: Isolates Lead, Concentrates Accelerate
Wet fractionation technologies enabled isolates to capture 52.27% of the market in 2025, driven by demand from beverages, dairy alternatives, and sports nutrition segments that require protein purity for functional performance and clean labeling. Textured and hydrolyzed pea proteins serve niche applications in plant-based meats and infant formula, respectively, but remain constrained by higher processing complexity and limited supplier capacity. Isolates' dominance reflects their superior solubility and neutral flavor profile, attributes critical for clear protein waters and ready-to-drink shakes.
Concentrates are forecasted to grow at a 7.99% CAGR from 2026 to 2031, the fastest rate among form segments, as bakery and snack manufacturers adopt lower-cost formulations where protein content is sufficient. The cost differential, which ranges from USD 5 to USD 7 per kilogram for concentrates versus USD 8 to USD 12 for isolates, makes them attractive for high-volume applications where margins are thin. Textured pea protein, produced through extrusion cooking, mimics the fibrous structure of meat and is gaining traction in plant-based burgers and sausages. Roquette's NUTRALYS® textured pea protein line, expanded in 2025, targets this segment with formulations optimized for juiciness and chewiness.


By Application: Food and Beverages Dominate, Supplements Surge
Food and beverages accounted for 62.48% of application share in 2025, reflecting pea protein's versatility across bakery, dairy alternatives, meat substitutes, and ready-to-eat products. Within the food and beverages sector, dairy and dairy alternative products accounted for a prominent volume, driven by pea milk brands such as Ripple and Sproud, which leverage pea protein's creamy mouthfeel and 8 grams of protein per serving, matching the protein content of cow's milk. Meat and poultry alternatives, including plant-based burgers and nuggets, represent the fastest-growing sub-segment, with pea protein providing the structural integrity and protein density required to replicate animal muscle tissue.
The supplements segment is projected to expand at 7.23% CAGR through 2031, outpacing other applications as sports nutrition and medical nutrition categories reformulate around plant-based proteins. Bakery applications benefit from pea protein's water-binding capacity, which improves dough elasticity and extends shelf life. Beverages, particularly protein shakes and smoothies, demand high solubility and low viscosity; advances in micronization and enzyme treatment are addressing these requirements. Condiments and sauces use pea protein as an emulsifier and thickener, replacing egg yolk in vegan mayonnaise formulations. Breakfast cereals and snacks incorporate pea protein to boost protein content and meet clean-label demands, with brands such as KIND and RXBAR launching pea protein-fortified bars in 2025.
Geography Analysis
North America held a 40.02% market share in 2025, underpinned by Saskatchewan's position as the world's largest yellow pea exporter and a mature ecosystem of pea protein processors, including Roquette, Puris, and Ingredion. Regulatory clarity from the FDA and Health Canada, including multiple GRAS notices for infant formula and medical nutrition applications, is accelerating product launches. The United States and Canada together account for the majority of North American consumption, with Mexico emerging as a growth market driven by rising middle-class incomes and plant-based diet awareness.
Asia-Pacific is forecast to grow at 6.87% CAGR from 2026 to 2031, the fastest among geographic segments, as urbanization and protein consumption rise in China, India, and Southeast Asia. India's plant-based protein market is expanding as lactose intolerance affects an estimated majority of the adult population, creating demand for dairy alternatives fortified with pea protein. Japan's aging population is driving growth in medical nutrition and elderly care products, where pea protein's hypoallergenic profile and amino acid adequacy are valued. Indonesia and other Southeast Asian markets remain nascent, constrained by low consumer awareness and limited distribution of specialty ingredients.
Europe commanded a significant market share in 2025, with Germany, France, and the United Kingdom leading consumption. The European Union's Green Deal and Farm to Fork Strategy are steering food companies toward low-carbon protein sources; pea protein's lower greenhouse gas emissions relative to beef protein align with corporate sustainability commitments. South America and the Middle East and Africa are constrained by low awareness, limited distribution, and price sensitivity. Brazil's plant-based market is expanding, but soy protein remains the dominant plant protein due to domestic soybean production and established supply chains. The Middle East's halal certification requirements are straightforward for pea protein, but consumer familiarity remains low. South Africa's plant-based market is nascent, with pea protein penetration limited to urban centers and premium retail channels.

Competitive Landscape
The pea protein market exhibits moderate fragmentation, as global ingredient suppliers compete alongside regional specialists and vertically integrated processors. Roquette, Cargill, Ingredion, and Puris dominate North American and European markets through backward integration into pea cultivation, proprietary fractionation technologies, and long-term supply agreements with plant-based food brands. Strategic emphasis centers on capacity expansion, co-development partnerships, and intellectual property around flavor masking and texture optimization.
Burcon NutraScience's patent portfolio, which includes over 30 filings related to pea protein extraction and modification, illustrates the competitive value of process innovation in a market where functional performance differentiates suppliers. White-space opportunities exist in infant formula, medical nutrition, and clear beverage applications, where technical barriers to entry remain high and regulatory approvals create moats. Smaller players such as Axiom Foods and NutriPea are carving niches through organic certification and non-GMO positioning, appealing to premium brands willing to pay price premiums for supply-chain transparency.
Chinese producers, including Shandong Jianyuan Foods and Yantai T. Full Biotech, are scaling production to serve domestic demand and export to Southeast Asia, leveraging lower labor costs and proximity to yellow pea cultivation in Heilongjiang province. Technology adoption varies widely; leading suppliers are piloting ultrasound-assisted extraction and fermentation-based flavor masking, while smaller processors rely on conventional wet fractionation. The absence of dominant global standards for pea protein quality, unlike soy protein, which has established USDA and ISO specifications, creates differentiation opportunities but also complicates cross-border trade and quality assurance.
Pea Protein Ingredients Industry Leaders
-
Archer Daniels Midland Company
-
International Flavors & Fragrances, Inc.
-
Cargill, Incorporated
-
Kerry Group plc
-
Ingredion
- *Disclaimer: Major Players sorted in no particular order

Recent Industry Developments
- June 2025: Meala FoodTech partners with DSM-Firmenich to commercialize Vertis™ PB Pea, a high‑performance texturizing pea protein ingredient for plant‑based meat alternatives, now available in Europe.
- April 2025: Protein Industries Canada announced a CAD 48.7 million partnership with Louis Dreyfus Company and Seven Oaks Hospital Centre to develop new pea protein ingredients and finished food products, aiming to scale ingredient development in Canada.
- April 2025: The European Investment Bank granted EUR 50 million to Lantmännen to co‑finance the construction of a new pea protein isolate factory in Sweden with an annual processing capacity of over 40,000 tons.


Global Pea Protein Ingredients Market Report Scope
Pea protein is a high-quality, plant-based protein powder made from yellow split peas, popular in vegan, dairy-free, and allergen-friendly diets, valued for its digestibility, iron content, and essential amino acids, used as a supplement or ingredient in bars, shakes, and meat substitutes. The pea protein ingredients market is segmented by form (concentrates, isolates, textured/hydrolyzed), application (animal feed, food and beverages, personal care and cosmetics, and more), and geography (Asia-Pacific, Europe, the Middle East and Africa, North America, South America). The market forecasts are provided in terms of value (USD) and volume (tons).
Form
| Concentrates |
| Isolates |
| Textured/Hydrolyzed |
Application
| Animal Feed | |
| Personal Care and Cosmetics | |
| Food and Beverages | Bakery |
| Beverages | |
| Breakfast Cereals | |
| Condiments/Sauces | |
| Dairy and Dairy Alternative Products | |
| Meat/Poultry/Seafood and Meat Alternative Products | |
| RTE/RTC Food Products | |
| Snacks | |
| Supplements | Baby Food and Infant Formula |
| Elderly Nutrition and Medical Nutrition | |
| Sport/Performance Nutrition |
By Geography
| North America | United States |
| Canada | |
| Rest of North America | |
| Europe | Germany |
| United Kingdom | |
| Italy | |
| France | |
| Spain | |
| Rest of Europe | |
| Asia-Pacific | China |
| India | |
| Japan | |
| IndOnesia | |
| Australia | |
| Rest of Asia-Pacific | |
| South America | Brazil |
| Argentina | |
| Rest of South America | |
| Middle East and Africa | South Africa |
| Saudi Arabia | |
| United Arab Emirates | |
| Rest of Middle East and Africa |
| Form | Concentrates | |
| Isolates | ||
| Textured/Hydrolyzed | ||
| Application | Animal Feed | |
| Personal Care and Cosmetics | ||
| Food and Beverages | Bakery | |
| Beverages | ||
| Breakfast Cereals | ||
| Condiments/Sauces | ||
| Dairy and Dairy Alternative Products | ||
| Meat/Poultry/Seafood and Meat Alternative Products | ||
| RTE/RTC Food Products | ||
| Snacks | ||
| Supplements | Baby Food and Infant Formula | |
| Elderly Nutrition and Medical Nutrition | ||
| Sport/Performance Nutrition | ||
| By Geography | North America | United States |
| Canada | ||
| Rest of North America | ||
| Europe | Germany | |
| United Kingdom | ||
| Italy | ||
| France | ||
| Spain | ||
| Rest of Europe | ||
| Asia-Pacific | China | |
| India | ||
| Japan | ||
| IndOnesia | ||
| Australia | ||
| Rest of Asia-Pacific | ||
| South America | Brazil | |
| Argentina | ||
| Rest of South America | ||
| Middle East and Africa | South Africa | |
| Saudi Arabia | ||
| United Arab Emirates | ||
| Rest of Middle East and Africa | ||


Market Definition
- End User - The Protein Ingredients Market operates on a B2B basis. Food, Beverages, Supplements, Animal Feed, and Personal Care & Cosmetic manufacturers are considered to be end-consumers in the market studied. The scope excludes manufacturers buying liquid/dry whey to be used for application as a binding agent or thickener or other non-protein applications.
- Penetration Rate - Penetration Rate is defined as the percentage of Protein-Fortified End User Market Volume in the Overall End User Market Volume.
- Average Protein Content - Average protein content is the average protein content present per 100 g of product manufactured by all end-user companies considered under the scope of this report.
- End User Market Volume - End-user market volume is the consolidated volume of all types and forms of end-user products in the country or region.
| Keyword | Definition |
|---|---|
| Alpha-lactalbumin (α-Lactalbumin) | It is a protein that regulates the production of lactose in the milk of almost all mammalian species. |
| Amino acid | It is an organic compound that contains both amino and carboxylic acid functional groups, which are required for the synthesis of body protein and other important nitrogen-containing compounds, such as creatine, peptide hormones, and some neurotransmitters. |
| Blanching | It is the process of briefly heating vegetables with steam or boiling water. |
| BRC | British Retail Consortium |
| Bread improver | It is a flour-based blend of several components with specific functional properties designed to modify dough characteristics and give quality attributes to bread. |
| BSF | Black Soldier Fly |
| Caseinate | It is a substance produced by adding an alkali to acid casein, a derivative of casein. |
| Celiac disease | Celiac disease is an immune reaction to eating gluten, a protein found in wheat, barley, and rye. |
| Colostrum | It is a milky fluid that’s released by mammals that have recently given birth before breast milk production begins. |
| Concentrate | It is the least processed form of protein and has a protein content ranging from 40-90% by weight. |
| Dry protein basis | It refers to the percentage of "pure protein" present in a supplement after the water in it is completely removed through heat. |
| Dry whey | It is the product resulting from drying fresh whey which has been pasteurized and to which nothing has been added as a preservative. |
| Egg protein | It is a mixture of individual proteins, including ovalbumin, ovomucoid, ovoglobulin, conalbumin, vitellin, and vitellenin. |
| Emulsifier | It is a food additive that facilitates the blending of foods that are immiscible with one another, such as oil and water. |
| Enrichment | It is the process of addition of micronutrients that are lost during the processing of the product. |
| ERS | Economic Research Service of the USDA |
| Extrusion | It is the process of forcing soft mixed ingredients through an opening in a perforated plate or die designed to produce the required shape. The extruded food is then cut to a specific size by blades. |
| Fava | Also known as Faba, it is another word for yellow split beans. |
| FDA | Food and Drug Administration |
| Flaking | It is a process in which typically a cereal grain (like corn, wheat, or rice) is broken down into grits, cooked with flavors and syrups, and then pressed into flakes between cooled rollers. |
| Foaming agent | It is a food ingredient that makes it possible to form or maintain a uniform dispersion of a gaseous phase in a liquid or solid food. |
| Foodservice | It refers to the part of the food industry which includes businesses, institutions, and companies which prepare meals outside the home. It includes restaurants, school and hospital cafeterias, catering operations, and many other formats. |
| Fortification | It is the deliberate addition of micronutrients that are not found in them naturally or which are lost during processing, to improve a food product's nutritional value. |
| FSANZ | Food Standards Australia New Zealand |
| FSIS | Food Safety and Inspection Service |
| FSSAI | Food Safety and Standards Authority of India |
| Gelling agent | It is an ingredient that functions as a stabilizer and thickener to provide thickening without stiffness through the formation of gel. |
| GHG | Greenhouse Gas |
| Gluten | It is a family of proteins found in grains, including wheat, rye, spelt, and barley. |
| Hemp | It is a botanical class of Cannabis sativa cultivars grown specifically for industrial or medicinal use. |
| Hydrolysate | It is a form of protein manufactured by exposing the protein to enzymes that can partially break the bonds between the protein's amino acids and break down large, complicated proteins into smaller pieces. Its processing makes it easier and quicker to digest. |
| Hypoallergenic | It refers to a substance that causes fewer allergic reactions. |
| Isolate | It is the purest and most processed form of protein which has undergone separation to obtain a pure protein fraction. It typically contains ≥ 90% of protein by weight. |
| Keratin | It is a protein that helps form hair, nails, and the outer layer of skin. |
| Lactalbumin | It is the albumin contained in milk and obtained from whey. |
| Lactoferrin | It is an iron‑binding glycoprotein that is present in the milk of most mammals. |
| Lupin | It is the yellow legume seeds of the genus Lupinus. |
| Millenial | Also known as Generation Y or Gen Y, it refers to the people born from 1981 to 1996. |
| Monogastric | It refers to an animal with a single-compartmented stomach. Examples of monogastric include humans, poultry, pigs, horses, rabbits, dogs, and cats. Most monogastric are generally unable to digest much cellulose food materials such as grasses. |
| MPC | Milk protein concentrate |
| MPI | Milk protein isolate |
| MSPI | Methylated soy protein isolate |
| Mycoprotein | Mycoprotein is a form of single-cell protein, also known as fungal protein, derived from fungi for human consumption. |
| Nutricosmetics | It is a category of products and ingredients that act as nutritional supplements to care for skin, nails, and hair natural beauty. |
| Osteoporosis | It is a medical condition in which the bones become brittle and fragile from loss of tissue, typically as a result of hormonal changes, or deficiency of calcium or vitamin D. |
| PDCAAS | Protein digestibility-corrected amino acid score (PDCAAS) is a method of evaluating the quality of a protein based on both the amino acid requirements of humans and their ability to digest it. |
| Per-capita consumption of animal protein | It is the average amount of animal protein (such as milk, whey, gelatin, collagen, and egg proteins) that is readily available for consumption by each person in an actual population. |
| Per-capita consumption of plant protein | It is the average amount of plant protein (such as soy, wheat, pea, oat, and hemp proteins) that is readily available for consumption by each person in an actual population. |
| Quorn | It is a microbial protein manufactured using mycoprotein as an ingredient, in which the fungus culture is dried and mixed with egg albumen or potato protein, which acts as a binder, and then is adjusted in texture and pressed into various forms. |
| Ready-to-Cook (RTC) | It refers to food products that include all of the ingredients, where some preparation or cooking is required through a process that is given on the package. |
| Ready-to-Eat (RTE) | It refers to a food product prepared or cooked in advance, with no further cooking or preparation required before being eaten. |
| RTD | Ready-to-Drink |
| RTS | Ready-to-Serve |
| Saturated fat | It is a type of fat in which the fatty acid chains have all single bonds. It is generally considered unhealthy. |
| Sausage | It is a meat product made of finely chopped and seasoned meat, which may be fresh, smoked, or pickled and which is then usually stuffed into a casing. |
| Seitan | It is a plant-based meat substitute made out of wheat gluten. |
| Softgel | It is a gelatin-based capsule with a liquid fill. |
| SPC | Soy protein concentrate |
| SPI | Soy protein isolate |
| Spirulina | It is a biomass of cyanobacteria that can be consumed by humans and animals. |
| Stabilizer | It is an ingredient added to food products to help maintain or enhance their original texture, and physical and chemical characteristics. |
| Supplementation | It is the consumption or provision of concentrated sources of nutrients or other substances that are intended to supplement nutrients in the diet and is intended to correct nutritional deficiencies. |
| Texturant | It is a specific type of food ingredient that is used to control and alter the mouthfeel and texture of food and beverage products. |
| Thickener | It is an ingredient that is used to increase the viscosity of a liquid or dough and make it thicker, without substantially changing its other properties. |
| Trans fat | Also called trans-unsaturated fatty acids or trans fatty acids, it is a type of unsaturated fat that naturally occurs in small amounts in meat. |
| TSP | Textured soy protein |
| TVP | Textured vegetable protein |
| WPC | Whey protein concentrate |
| WPI | Whey protein isolate |


Research Methodology
Mordor Intelligence follows a four-step methodology in all our reports.
- Step-1: Identify Key Variables: The quantifiable key variables (industry and extraneous) pertaining to the specific product segment and country are selected from a group of relevant variables & factors based on desk research & literature review; along with primary expert inputs. These variables are further confirmed through regression modeling (wherever required).
- Step-2: Build a Market Model: In order to build a robust forecasting methodology, the variables and factors identified in Step-1 are tested against available historical market numbers. Through an iterative process, the variables required for market forecast are set and the model is built on the basis of these variables.
- Step-3: Validate and Finalize: In this important step, all market numbers, variables and analyst calls are validated through an extensive network of primary research experts from the market studied. The respondents are selected across levels and functions to generate a holistic picture of the market studied.
- Step-4: Research Outputs: Syndicated Reports, Custom Consulting Assignments, Databases & Subscription Platforms


