Market Overview
| Study Period | 2021 - 2031 |
|---|---|
| Forecast Data Period | 2026 - 2031 |
| Historical Data Period | 2021 - 2024 |
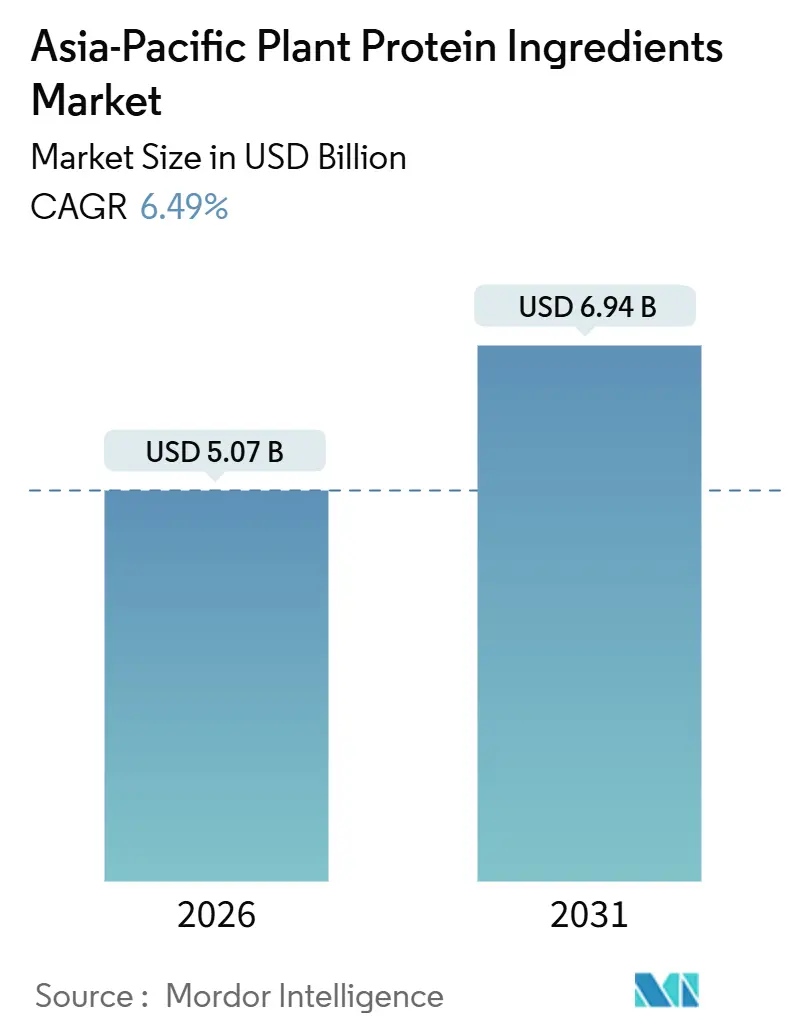
| Market Size (2026) | USD 5.07 Billion |
| Market Size (2031) | USD 6.94 Billion |
| Growth Rate (2026 - 2031) | 6.49% CAGR |
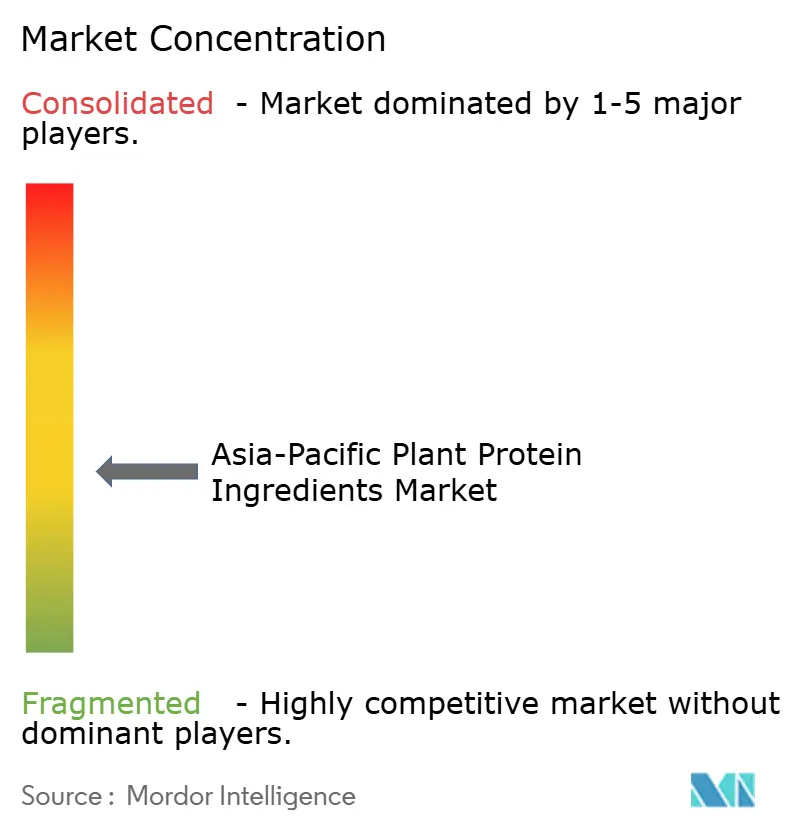
| Market Concentration | Medium |
Major Players*Disclaimer: Major Players sorted in no particular order Image © Mordor Intelligence. Reuse requires attribution under CC BY 4.0. | |
Asia-Pacific Plant Protein Ingredients Market Analysis by Mordor Intelligence
The plant protein ingredients market size in Asia-Pacific is valued at USD 5.07 billion in 2026 and is projected to reach USD 6.94 billion by 2031, advancing at a 6.49% CAGR over the forecast period. In urban centers, the plant protein ingredients market is expanding, driven by robust government nutrition policies, a surge in co-manufacturing capacity across Southeast Asia, and the mainstreaming of flexitarian diets. Under Singapore’s 90-day novel food review pathway, precision-fermented and extruded proteins are being commercialized rapidly. Meanwhile, Malaysia’s National Agrofood Policy 2.0 is injecting MYR 2 billion (USD 450 million) into processing infrastructure, further energizing the market[1]Source: Ministry of Agriculture and Food Security, “Introduction to The National Agrofood Policy 2021-2030 (NAP 2.0),” kpkm.gov.my. Regional brands are capitalizing on dual-use applications, exporting premium meat alternatives while providing cost-efficient animal feed for the domestic livestock industry. By sourcing locally, they compress lead times, avoiding the 8- to 12-week shipping delays of previously imported isolates. Competitive dynamics are moderate; while multinational incumbents utilize global procurement, regional specialists carve out niches with halal certification, specialty formulations, and valorization of crop co-products, ensuring the market remains vibrant and innovative.
Key Report Takeaways
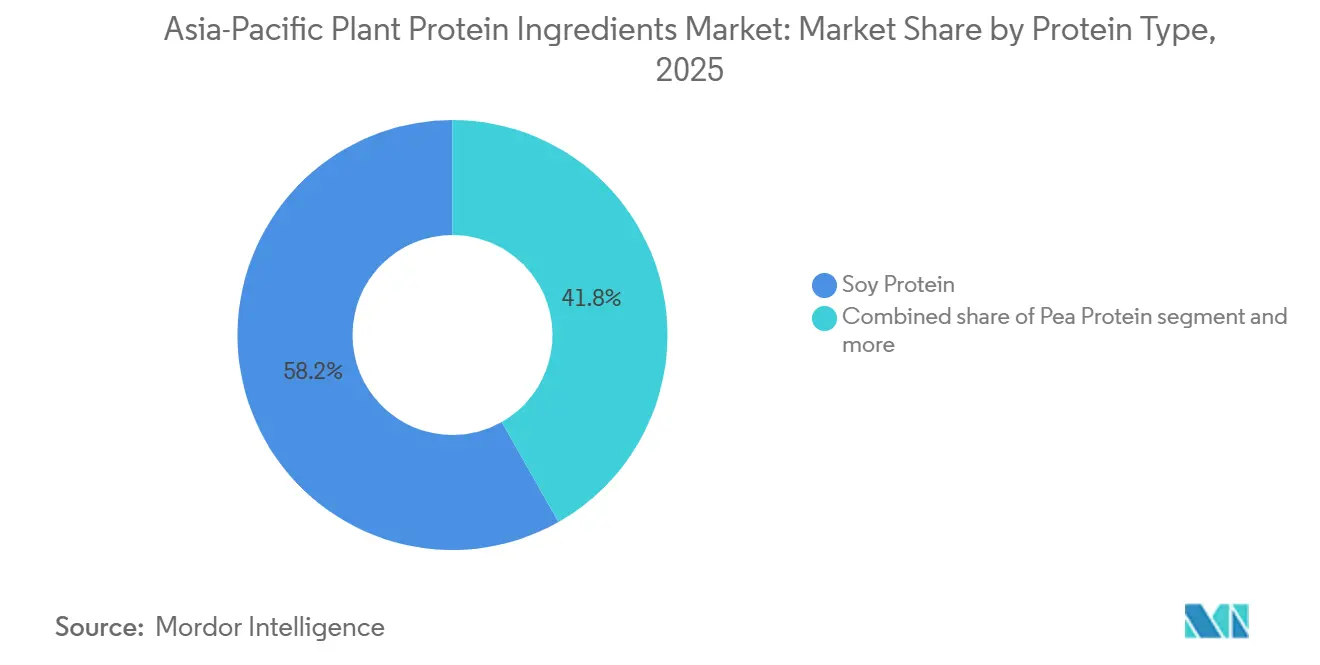
- By protein type, soy protein held a 58.20% plant protein ingredients market share in 2025; pea protein is forecast to expand at an 8.12% CAGR to 2031.
- By end user, food and beverages led with 54.42% of the plant protein ingredients market size in 2025; animal feed is set to grow at a 6.81% CAGR through 2031.
- By geography, China dominated with 34.05% revenue contribution in 2025; Malaysia is projected to record the highest 7.23% CAGR between 2026 and 2031.
Note: Market size and forecast figures in this report are generated using Mordor Intelligence’s proprietary estimation framework, updated with the latest available data and insights as of January 2026.
Asia-Pacific Plant Protein Ingredients Market Trends and Insights
Drivers Impact Analysis*
| Driver | (~) % Impact on CAGR Forecast | Geographic Relevance | Impact Timeline |
|---|---|---|---|
| Growing flexitarian and vegan population | +1.2% | Urban China, Singapore, Malaysia | Medium term (2-4 years) |
| Functional-food demand in sports and clinical nutrition | +0.9% | Japan, South Korea, Australia, urban India | Medium term (2-4 years) |
| Government nutrition and sustainability policies | +1.1% | Singapore, Malaysia, Thailand, China | Short term (≤2 years) |
| Surge in Southeast-Asian co-manufacturing capacity | +1.0% | Thailand, Vietnam, Malaysia, Indonesia | Short term (≤2 years) |
| Valorization of crop side-streams | +0.5% | China, India, Thailand | Long term (≥4 years) |
| Precision extrusion analytics lowering formulation costs | +0.6% | Early adoption in Japan, South Korea | Medium term (2-4 years) |
| Source: Mordor Intelligence | |||


Growing flexitarian and vegan population
Flexitarian diets are outpacing strict veganism in growth, with consumers increasingly prioritizing taste, convenience, and complete amino acid profiles. The Vegan Society highlighted a 47% surge in flexitarian-focused SKUs in Southeast Asia from 2024 to 2025, outpacing a 28% rise in strictly vegan launches. Singapore’s Temasek Foundation bolstered this trend, pouring millions into hybrid meat-plant startups, thereby easing the financial shift for consumers moving away from traditional meat. In urban centers like Shanghai, Kuala Lumpur, and Bangkok, where disposable incomes exceed USD 15,000, plant-based ready meals achieved over 12% market penetration in 2025. Brands are now blending pea, rice, and mung bean proteins to attain PDCAAS scores surpassing 0.95, aligning with flexitarian preferences. These advancements not only broaden the market potential for plant protein ingredients but also diversify their applications.
Functional-food demand in sports and clinical nutrition
In 2025, Japan streamlined its Foods with Function Claims, paving the way for sarcopenia-focused supplements derived from pea and rice isolates. This regulatory change facilitated a significant increase in ingredient approvals within clinical channels, enabling manufacturers to introduce innovative products targeting muscle health. Techniques like enzymatic deamidation and high-moisture extrusion have successfully masked off-notes and enhanced textures, making plant-based formulations more comparable to dairy in taste and mouthfeel. Hospitals in India and Indonesia are now using soy-pea blends in enteral feeds, significantly reducing lactose exposure for at-risk patients, such as those with compromised digestive systems or specific dietary restrictions. Collectively, these advancements are propelling the plant protein ingredients market deeper into institutional nutrition sectors, highlighting its potential to address diverse nutritional needs.
Government nutrition and sustainability policies
In 2025, Singapore amended its Food Safety Act, introducing a swift 90-day review channel for novel plant proteins, slashing approval timelines to just one-sixth of the global standard[2]Source: Singapore Food Agency, “Food Safety and Security Act,” sfa.gov.sg. This move positions Singapore as a leader in regulatory efficiency for plant-based innovations, encouraging faster market entry for novel products. In 2025, Malaysia introduced its National Agrofood Policy 2.0, offering protein processors 10-year tax holidays and subsidized leases to promote domestic production and reduce reliance on imports. Also in 2025, Thailand’s Board of Investment greenlit 15 projects, totaling USD 240 million, with a focus on facilities harnessing renewable energy and implementing zero-liquid-discharge systems. These projects are expected to enhance sustainability and operational efficiency in the plant protein sector. These strategic policies aim to bolster food security, reduce imports, and assert halal export dominance, all while boosting investor confidence. Major players like ADM, Roquette, and Wilmar have already responded, diving into joint ventures and broadening the production base of the plant protein ingredients market.
Surge in Southeast-Asian co-manufacturing capacity
Gemini Food's 60,000-ton soy isolate plant in Chonburi has significantly reduced order-to-delivery lead times to just three weeks for its Japanese and Korean clientele, enhancing supply chain efficiency and customer satisfaction. Backed by 2,400 contracted soy farmers, Vietnam Agrifood's USD 100 million crushing site processes an impressive volume annually, ensuring a reliable and secure supply of raw materials critical for production continuity. In Singapore, Monde Nissin's Green Protein Hub integrates research and development, pilot-scale extrusion, and regulatory testing under one roof. This setup enables brands to streamline product iteration and secure regulatory approvals within a rapid nine-month timeframe, accelerating time-to-market for new products. Southeast Asia's contract manufacturing offers a cost advantage of 20-30% compared to Europe and North America, making it a highly attractive option for mid-sized brands seeking cost efficiency without compromising quality. This growing trend introduces much-needed flexible capacity, ensuring the plant protein ingredients market remains agile and capable of addressing sudden demand surges effectively.
Restraints Impact Analysis*
| Restraint | (~) % Impact on CAGR Forecast | Geographic Relevance | Impact Timeline |
|---|---|---|---|
| Price volatility of soy and pea commodities | -0.8% | India, China, Thailand | Short term (≤2 years) |
| Allergen/GMO perception issues | -0.6% | Japan, South Korea, urban China | Medium term (2-4 years) |
| Batch-to-batch functional variability in novel proteins | -0.4% | Global | Medium term (2-4 years) |
| Limited high-moisture extrusion technicians in APAC | -0.3% | Southeast Asia, India | Long term (≥4 years) |
| Source: Mordor Intelligence | |||
Price volatility of soy and pea commodities
In 2025, soybean futures at the Chicago Board of Trade fluctuated between USD 485 and USD 572 per ton, impacted by monsoon delays in Madhya Pradesh, India, which disrupted supply chains and created uncertainty in the market. By the end of the year, prices stabilized at USD 510 per ton as weather conditions normalized. Prices for European yellow peas ranged between EUR 420 and 510 per ton, driven by strong demand from both the feed and food sectors, highlighting the dual-purpose nature of this commodity. Due to their limited hedging capacity, smaller processors in Thailand and Indonesia faced up to a 70% shock in spot prices, which significantly eroded their gross margins from 22% to 14%, putting additional pressure on their operational sustainability. Meanwhile, major players like Cargill and ADM mitigated risks effectively through diversified multi-origin sourcing strategies and vertically integrated contracts, ensuring greater control over their supply chains. This persistent volatility has hindered the swift expansion of the plant protein ingredients market, particularly for mid-tier firms that are financially constrained and unable to absorb such price fluctuations.
Allergen and GMO perception issues
Despite the presence of non-GMO labels, a 2025 survey revealed that a significant number of Japanese consumers associate soy protein with GMOs, highlighting the challenges posed by misinformation and the need for better consumer education. In South Korea, a stricter 3% GMO disclosure threshold compared to the EU's 5% introduces added compliance costs for manufacturers, potentially impacting pricing and market competitiveness. Concerns over allergens are steering formulators of baby food and nutrition for the elderly towards proteins derived from peas, rice, and mung beans, as these alternatives are perceived to be safer and less likely to trigger allergic reactions. The Codex Alimentarius has set a new standard, requiring the declaration of protein sources exceeding 10 mg/kg, which complicates the formulation of multi-source blends by necessitating more detailed labeling and adherence to regulations. Such perceptions and regulatory complexities are dampening the demand growth in the premium segments of the plant protein ingredients market, as manufacturers face increased costs and challenges in meeting consumer expectations.
*Our forecasts treat driver/restraint impacts as directional, not additive. The impact forecasts reflect baseline growth, mix effects, and variable interactions.
Segment Analysis
By Protein Type: Pea Protein Outpaces Soy on Allergen-Free Appeal
In 2025, soy protein led the plant protein ingredients market with a commanding 58.20% share. Its dominance is attributed to its versatility in beverages, bakery items, and meat alternatives, striking a cost-effective balance between nutrition and functionality. Bolstered by a well-established processing infrastructure and a global supply network, soy's prominence is evident. However, it's not without challenges: concerns regarding allergens and perceptions of GMOs present modest hurdles. Meanwhile, rice and wheat proteins enjoy steady, niche demand, particularly in hypoallergenic and bakery sectors. In contrast, hemp and potato proteins face limitations due to regulatory and performance issues. Overall, soy sets the standard for pricing and formulation efficiency in the regional plant protein arena.
Pea protein is emerging as the fastest-growing segment, projected to achieve an 8.12% CAGR through 2031. Its rising popularity is fueled by its allergen-free nature and sustainable cultivation practices. Technological advancements, such as refined wet-milling and co-product valorization, have slashed costs by 12%, bolstering its competitiveness against soy. Following FSANZ's 2024 nod for faba bean and other emerging sources in premium applications, the segment is venturing into infant and clinical nutrition. Companies like Australian Plant Proteins are capitalizing on innovations, such as smoother faba bean concentrates, to secure price premiums of 25–35%. This shift highlights a market trend towards diversified, multi-source blends, aiming to reduce allergen and supply chain risks.


By End User: Animal Feed Growth Surpasses Food and Beverages
In 2025, the Asia-Pacific plant protein ingredients market saw food and beverages dominate, accounting for 54.42%. This stronghold is largely due to the widespread adoption of these ingredients in meat analogs, dairy alternatives, and protein-enriched beverages. This trend aligns seamlessly with the region's consumers increasingly gravitating towards plant-based and fortified products. Last year, meat alternatives witnessed a robust 9.2% growth, spurred by retail expansions in China and new quick-service launches in Singapore. Meanwhile, dairy analogs saw a 7.8% uptick, strategically tapping into East Asia's notable lactose intolerance rates, which exceed 90%. Furthermore, the realm of sports nutrition and dietary supplements is turning to pea-rice blends, ensuring they deliver allergen-free products with complete amino acid profiles.
Animal feed has emerged as the fastest-growing end-user segment in the plant protein market, with projections indicating a 6.81% CAGR through 2031. This growth surge is largely attributed to recovery initiatives from the African swine fever in Vietnam and Thailand. These countries are now prioritizing cost-effective plant proteins, moving away from their traditional reliance on imported fishmeal. Such a shift not only bolsters the segment's expansion but also enhances supply-chain resilience, reducing dependency on the often-volatile marine sources. In parallel, sectors like baby food and clinical nutrition are turning to soy-pea hybrids, ensuring compliance with the stringent Codex PDCAAS standards. These evolving dynamics underscore animal feed's pivotal role as a volume driver, all while showcasing its versatility across other regulated, high-value categories.
Geography Analysis
In 2025, China secured a dominant 34.05% share of the Asia-Pacific plant protein ingredients market. China's supremacy is underpinned by its annual crushing capacity, surpassing 100 million tons, and a seamless supply chain that connects Northeast farms directly to coastal processors. This vast scale allows China to produce soy isolates and textured proteins cost-effectively, catering to both domestic needs and export demands. Additionally, China's agricultural investments, driven by policy and its closeness to major end-users, such as meat analogs and animal feed, bolster its market leadership. Collectively, these elements establish China as the region's pricing and volume benchmark.
Malaysia is set to outpace its Asia-Pacific counterparts, boasting a projected 7.23% CAGR through 2031. This surge is fueled by halal-certified refineries, initially designed for palm oil, achieving up to 40% capital cost savings through repurposing. Strategically positioned, Malaysia not only caters to the regional demand for clean-label proteins but also exports to Muslim-majority markets. With an emphasis on value-added processing, Malaysia is enhancing its margins in sectors like sports nutrition and bakery applications, positioning itself for significant share gains as premium formulations gain traction.
Asia's plant protein ingredients market is a tapestry of diverse contributions. Co-manufacturing is on the rise in Indonesia and Thailand, underscored by Thailand's THB 8.2 billion project approvals in 2025. India harmonizes its export-driven soy hubs in Gujarat and Maharashtra with a robust domestic appetite for textured vegetable protein, a nod to its vegetarian populace. Meanwhile, Japan and South Korea command a significant premium for organic, non-GMO products. Australia stands out by exporting 50% of its pulse output to Southeast Asia, and Vietnam is evolving into a net supplier, bolstered by a new 500,000-ton crushing plant[3]Source: Australian Export Grains Innovation Centre “Pulses,” aegic.org.au. Even smaller players, like New Zealand and the Philippines, are drawing early investments, broadening the region's market landscape.
Competitive Landscape
In the Asia-Pacific, the plant protein ingredients market is witnessing a moderate fragmentation. Major players like Archer Daniels Midland, Cargill, and Roquette utilize global procurement and multi-site manufacturing to fulfill substantial contracts in soy, pea, wheat, and rice proteins. These companies leverage their extensive supply chains and advanced production capabilities to meet the growing demand for plant-based protein ingredients. While global entities harness technological advancements to maintain their competitive edge, regional specialists capitalize on their deep understanding of local markets and consumer preferences.
Companies such as Yantai Shuangta Food, Wilmar International, and Fuji Oil stand out by leveraging halal certification, vertical integration, and co-product monetization, resulting in margins that are 18% above their single-product counterparts. Halal certification enables these companies to cater to a broader demographic, while vertical integration ensures better control over production processes and cost efficiencies. Additionally, co-product monetization allows them to maximize resource utilization and profitability. Meanwhile, Burcon NutraScience’s recent 2024 patents on canola and sunflower extraction open doors for licensing in allergen-free formulations, addressing the rising consumer demand for clean-label and allergen-free products.
Singapore’s streamlined 90-day approval process for novel proteins has fostered a burgeoning precision-fermentation hub, boasting 12 startups. This regulatory efficiency encourages innovation and accelerates the commercialization of novel protein solutions. Concurrently, firms in Japan and Korea are channeling investments into high-moisture extrusion and enzymatic modifications, enhancing texture and flavor to meet consumer expectations for meat-like alternatives. Australian Plant Proteins and Proeon Foods are carving out premium niches with their faba bean and mung bean concentrates, achieving price premiums of 25–35% over standard commodity isolates. These premium products cater to the growing demand for high-quality, sustainable protein sources. Collectively, these strategic maneuvers not only intensify market competition but also drive innovation, bolstering the long-term growth of the plant protein ingredients sector.
Asia-Pacific Plant Protein Ingredients Industry Leaders
Archer Daniels Midland Company
Fuji Oil Group
International Flavors & Fragrances, Inc.
Kerry Group PLC
Südzucker AG
- *Disclaimer: Major Players sorted in no particular order

Recent Industry Developments
- August 2025: In a strategic collaboration, ADM joined forces with India's Proeon Foods to harness rice protein development for the South Asian market, blending ADM's robust R&D capabilities with Proeon's extensive sourcing networks.
- April 2025: Roquette and Wilmar have established a joint venture in Singapore to focus on the production of pea protein. The facility is expected to begin commercial output by Q2 2027, aiming to cater to the growing demand for plant-based protein products globally.
- March 2025: In Chonburi, Thai Gemini Food launched a 60,000-ton soy isolate production line. This facility aims to cater to co-manufacturing contracts, primarily serving the growing demand for soy-based products in Japan and South Korea.


Asia-Pacific Plant Protein Ingredients Market Report Scope
Hemp Protein, Pea Protein, Potato Protein, Rice Protein, Soy Protein, Wheat Protein are covered as segments by Protein Type. Animal Feed, Food and Beverages, Personal Care and Cosmetics, Supplements are covered as segments by End User. Australia, China, India, Indonesia, Japan, Malaysia, New Zealand, South Korea, Thailand, Vietnam are covered as segments by Country.By Protein Type
| Soy Protein |
| Pea Protein |
| Rice Protein |
| Wheat Protein |
| Hemp Protein |
| Potato Protein |
| Other Plant Proteins |
By End User
| Food and Beverages | Bakery |
| Beverages | |
| Breakfast Cereals | |
| Condiments/Sauces | |
| Confectionery | |
| Dairy and Dairy-Alternative Products | |
| Meat/Poultry/Seafood and Meat Alternatives | |
| RTE/RTC Foods | |
| Snacks | |
| Animal Feed | |
| Personal Care and Cosmetics | |
| Dietary Supplements | |
| Baby Food and Infant Formula | |
| Sports/Performance Nutrition | |
| Elderly and Medical Nutrition |
Country
| Australia |
| China |
| India |
| Indonesia |
| Japan |
| Malaysia |
| South Korea |
| Thailand |
| Vietnam |
| Rest of Asia-Pacific |
| By Protein Type | Soy Protein | |
| Pea Protein | ||
| Rice Protein | ||
| Wheat Protein | ||
| Hemp Protein | ||
| Potato Protein | ||
| Other Plant Proteins | ||
| By End User | Food and Beverages | Bakery |
| Beverages | ||
| Breakfast Cereals | ||
| Condiments/Sauces | ||
| Confectionery | ||
| Dairy and Dairy-Alternative Products | ||
| Meat/Poultry/Seafood and Meat Alternatives | ||
| RTE/RTC Foods | ||
| Snacks | ||
| Animal Feed | ||
| Personal Care and Cosmetics | ||
| Dietary Supplements | ||
| Baby Food and Infant Formula | ||
| Sports/Performance Nutrition | ||
| Elderly and Medical Nutrition | ||
| Country | Australia | |
| China | ||
| India | ||
| Indonesia | ||
| Japan | ||
| Malaysia | ||
| South Korea | ||
| Thailand | ||
| Vietnam | ||
| Rest of Asia-Pacific | ||


Market Definition
- End User - The Protein Ingredients Market operates on a B2B basis. Food, Beverages, Supplements, Animal Feed, and Personal Care & Cosmetic manufacturers are considered to be end-consumers in the market studied. The scope excludes manufacturers buying liquid/dry whey to be used for application as a binding agent or thickener or other non-protein applications.
- Penetration Rate - Penetration Rate is defined as the percentage of Protein-Fortified End User Market Volume in the Overall End User Market Volume.
- Average Protein Content - Average protein content is the average protein content present per 100 g of product manufactured by all end-user companies considered under the scope of this report.
- End User Market Volume - End-user market volume is the consolidated volume of all types and forms of end-user products in the country or region.
| Keyword | Definition |
|---|---|
| Alpha-lactalbumin (α-Lactalbumin) | It is a protein that regulates the production of lactose in the milk of almost all mammalian species. |
| Amino acid | It is an organic compound that contains both amino and carboxylic acid functional groups, which are required for the synthesis of body protein and other important nitrogen-containing compounds, such as creatine, peptide hormones, and some neurotransmitters. |
| Blanching | It is the process of briefly heating vegetables with steam or boiling water. |
| BRC | British Retail Consortium |
| Bread improver | It is a flour-based blend of several components with specific functional properties designed to modify dough characteristics and give quality attributes to bread. |
| BSF | Black Soldier Fly |
| Caseinate | It is a substance produced by adding an alkali to acid casein, a derivative of casein. |
| Celiac disease | Celiac disease is an immune reaction to eating gluten, a protein found in wheat, barley, and rye. |
| Colostrum | It is a milky fluid that’s released by mammals that have recently given birth before breast milk production begins. |
| Concentrate | It is the least processed form of protein and has a protein content ranging from 40-90% by weight. |
| Dry protein basis | It refers to the percentage of "pure protein" present in a supplement after the water in it is completely removed through heat. |
| Dry whey | It is the product resulting from drying fresh whey which has been pasteurized and to which nothing has been added as a preservative. |
| Egg protein | It is a mixture of individual proteins, including ovalbumin, ovomucoid, ovoglobulin, conalbumin, vitellin, and vitellenin. |
| Emulsifier | It is a food additive that facilitates the blending of foods that are immiscible with one another, such as oil and water. |
| Enrichment | It is the process of addition of micronutrients that are lost during the processing of the product. |
| ERS | Economic Research Service of the USDA |
| Extrusion | It is the process of forcing soft mixed ingredients through an opening in a perforated plate or die designed to produce the required shape. The extruded food is then cut to a specific size by blades. |
| Fava | Also known as Faba, it is another word for yellow split beans. |
| FDA | Food and Drug Administration |
| Flaking | It is a process in which typically a cereal grain (like corn, wheat, or rice) is broken down into grits, cooked with flavors and syrups, and then pressed into flakes between cooled rollers. |
| Foaming agent | It is a food ingredient that makes it possible to form or maintain a uniform dispersion of a gaseous phase in a liquid or solid food. |
| Foodservice | It refers to the part of the food industry which includes businesses, institutions, and companies which prepare meals outside the home. It includes restaurants, school and hospital cafeterias, catering operations, and many other formats. |
| Fortification | It is the deliberate addition of micronutrients that are not found in them naturally or which are lost during processing, to improve a food product's nutritional value. |
| FSANZ | Food Standards Australia New Zealand |
| FSIS | Food Safety and Inspection Service |
| FSSAI | Food Safety and Standards Authority of India |
| Gelling agent | It is an ingredient that functions as a stabilizer and thickener to provide thickening without stiffness through the formation of gel. |
| GHG | Greenhouse Gas |
| Gluten | It is a family of proteins found in grains, including wheat, rye, spelt, and barley. |
| Hemp | It is a botanical class of Cannabis sativa cultivars grown specifically for industrial or medicinal use. |
| Hydrolysate | It is a form of protein manufactured by exposing the protein to enzymes that can partially break the bonds between the protein's amino acids and break down large, complicated proteins into smaller pieces. Its processing makes it easier and quicker to digest. |
| Hypoallergenic | It refers to a substance that causes fewer allergic reactions. |
| Isolate | It is the purest and most processed form of protein which has undergone separation to obtain a pure protein fraction. It typically contains ≥ 90% of protein by weight. |
| Keratin | It is a protein that helps form hair, nails, and the outer layer of skin. |
| Lactalbumin | It is the albumin contained in milk and obtained from whey. |
| Lactoferrin | It is an iron‑binding glycoprotein that is present in the milk of most mammals. |
| Lupin | It is the yellow legume seeds of the genus Lupinus. |
| Millenial | Also known as Generation Y or Gen Y, it refers to the people born from 1981 to 1996. |
| Monogastric | It refers to an animal with a single-compartmented stomach. Examples of monogastric include humans, poultry, pigs, horses, rabbits, dogs, and cats. Most monogastric are generally unable to digest much cellulose food materials such as grasses. |
| MPC | Milk protein concentrate |
| MPI | Milk protein isolate |
| MSPI | Methylated soy protein isolate |
| Mycoprotein | Mycoprotein is a form of single-cell protein, also known as fungal protein, derived from fungi for human consumption. |
| Nutricosmetics | It is a category of products and ingredients that act as nutritional supplements to care for skin, nails, and hair natural beauty. |
| Osteoporosis | It is a medical condition in which the bones become brittle and fragile from loss of tissue, typically as a result of hormonal changes, or deficiency of calcium or vitamin D. |
| PDCAAS | Protein digestibility-corrected amino acid score (PDCAAS) is a method of evaluating the quality of a protein based on both the amino acid requirements of humans and their ability to digest it. |
| Per-capita consumption of animal protein | It is the average amount of animal protein (such as milk, whey, gelatin, collagen, and egg proteins) that is readily available for consumption by each person in an actual population. |
| Per-capita consumption of plant protein | It is the average amount of plant protein (such as soy, wheat, pea, oat, and hemp proteins) that is readily available for consumption by each person in an actual population. |
| Quorn | It is a microbial protein manufactured using mycoprotein as an ingredient, in which the fungus culture is dried and mixed with egg albumen or potato protein, which acts as a binder, and then is adjusted in texture and pressed into various forms. |
| Ready-to-Cook (RTC) | It refers to food products that include all of the ingredients, where some preparation or cooking is required through a process that is given on the package. |
| Ready-to-Eat (RTE) | It refers to a food product prepared or cooked in advance, with no further cooking or preparation required before being eaten. |
| RTD | Ready-to-Drink |
| RTS | Ready-to-Serve |
| Saturated fat | It is a type of fat in which the fatty acid chains have all single bonds. It is generally considered unhealthy. |
| Sausage | It is a meat product made of finely chopped and seasoned meat, which may be fresh, smoked, or pickled and which is then usually stuffed into a casing. |
| Seitan | It is a plant-based meat substitute made out of wheat gluten. |
| Softgel | It is a gelatin-based capsule with a liquid fill. |
| SPC | Soy protein concentrate |
| SPI | Soy protein isolate |
| Spirulina | It is a biomass of cyanobacteria that can be consumed by humans and animals. |
| Stabilizer | It is an ingredient added to food products to help maintain or enhance their original texture, and physical and chemical characteristics. |
| Supplementation | It is the consumption or provision of concentrated sources of nutrients or other substances that are intended to supplement nutrients in the diet and is intended to correct nutritional deficiencies. |
| Texturant | It is a specific type of food ingredient that is used to control and alter the mouthfeel and texture of food and beverage products. |
| Thickener | It is an ingredient that is used to increase the viscosity of a liquid or dough and make it thicker, without substantially changing its other properties. |
| Trans fat | Also called trans-unsaturated fatty acids or trans fatty acids, it is a type of unsaturated fat that naturally occurs in small amounts in meat. |
| TSP | Textured soy protein |
| TVP | Textured vegetable protein |
| WPC | Whey protein concentrate |
| WPI | Whey protein isolate |


Research Methodology
Mordor Intelligence follows a four-step methodology in all our reports.
- Step-1: Identify Key Variables: The quantifiable key variables (industry and extraneous) pertaining to the specific product segment and country are selected from a group of relevant variables & factors based on desk research & literature review; along with primary expert inputs. These variables are further confirmed through regression modeling (wherever required).
- Step-2: Build a Market Model: In order to build a robust forecasting methodology, the variables and factors identified in Step-1 are tested against available historical market numbers. Through an iterative process, the variables required for market forecast are set and the model is built on the basis of these variables.
- Step-3: Validate and Finalize: In this important step, all market numbers, variables and analyst calls are validated through an extensive network of primary research experts from the market studied. The respondents are selected across levels and functions to generate a holistic picture of the market studied.
- Step-4: Research Outputs: Syndicated Reports, Custom Consulting Assignments, Databases & Subscription Platforms


