Seafood Processing Equipment Market Size and Share
Market Overview
| Study Period | 2021 - 2031 |
|---|---|
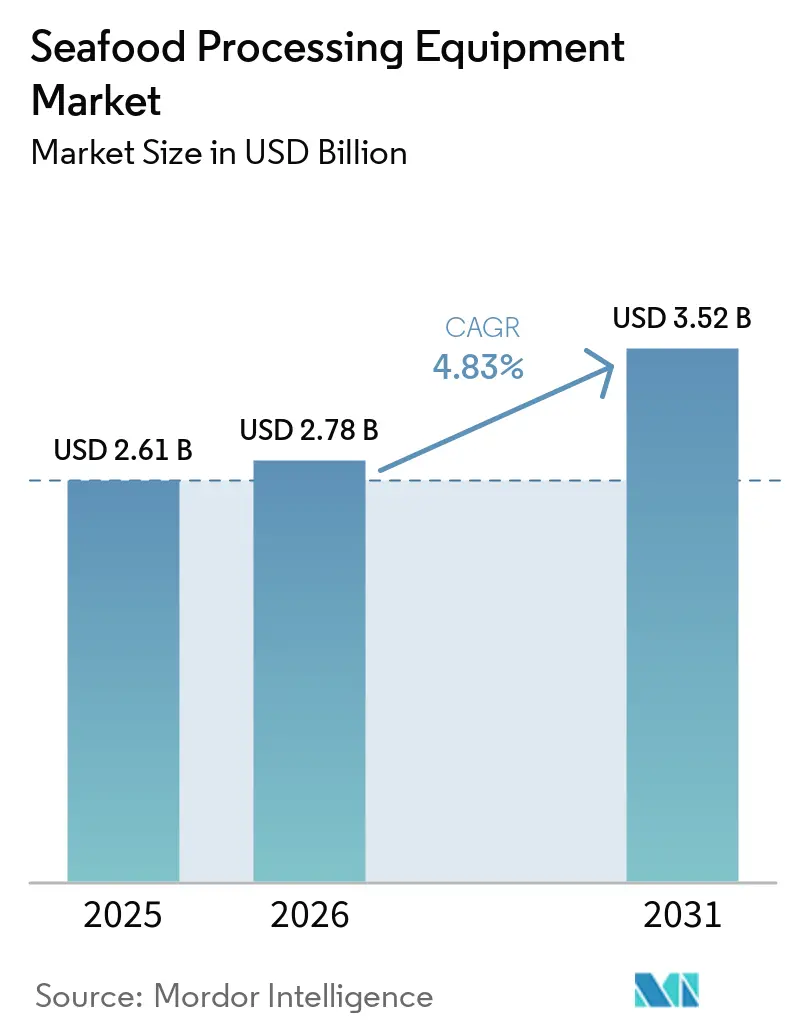
| Market Size (2026) | USD 2.78 Billion |
| Market Size (2031) | USD 3.52 Billion |
| Growth Rate (2026 - 2031) | 4.83% CAGR |
| Fastest Growing Market | Asia-Pacific |
| Largest Market | Asia-Pacific |
| Market Concentration | Medium |
Major Players *Disclaimer: Major Players sorted in no particular order Image © Mordor Intelligence. Reuse requires attribution under CC BY 4.0. | |
Seafood Processing Equipment Market Analysis by Mordor Intelligence
The seafood processing equipment market size was valued at USD 2.6 billion in 2025 and estimated to grow from USD 2.8 billion in 2026 to reach USD 3.5 billion by 2031, at a CAGR of 4.8% during the forecast period 2026-2031. Following the EU's 2026 mandate for digital record transmission, export-facing processors are upgrading their lines. This shift underscores the evolution of digital traceability from a mere documentation task to an essential processing requirement. As buyer expectations tighten, driven by stringent hygienic design standards, processors are gravitating towards equipment that demonstrates cleanability under operational conditions, especially in light of the December 2025 update to EHEDG Guideline 8[1]Source: European Hygienic Engineering and Design Group, “Guideline 8 Fourth Edition,” EHEDG, ehedg.org. The growing demand for processed and ready-to-eat seafood is prompting plant investments to expand beyond basic cutting to include deboning, portioning, packaging, and integrated line design. This trend is particularly pronounced in major aquaculture economies and export hubs. In response, leading suppliers are enhancing their offerings, blending full-line capabilities with modular upgrades, software integration, and aftermarket services. This strategy intensifies competition in the premium segment of the seafood processing equipment market. However, challenges persist: rising stainless steel costs and a dearth of technicians adept at managing automated systems. These issues are particularly pronounced in regions where equipment demand outpaces local operational capabilities.
Key Report Takeaways
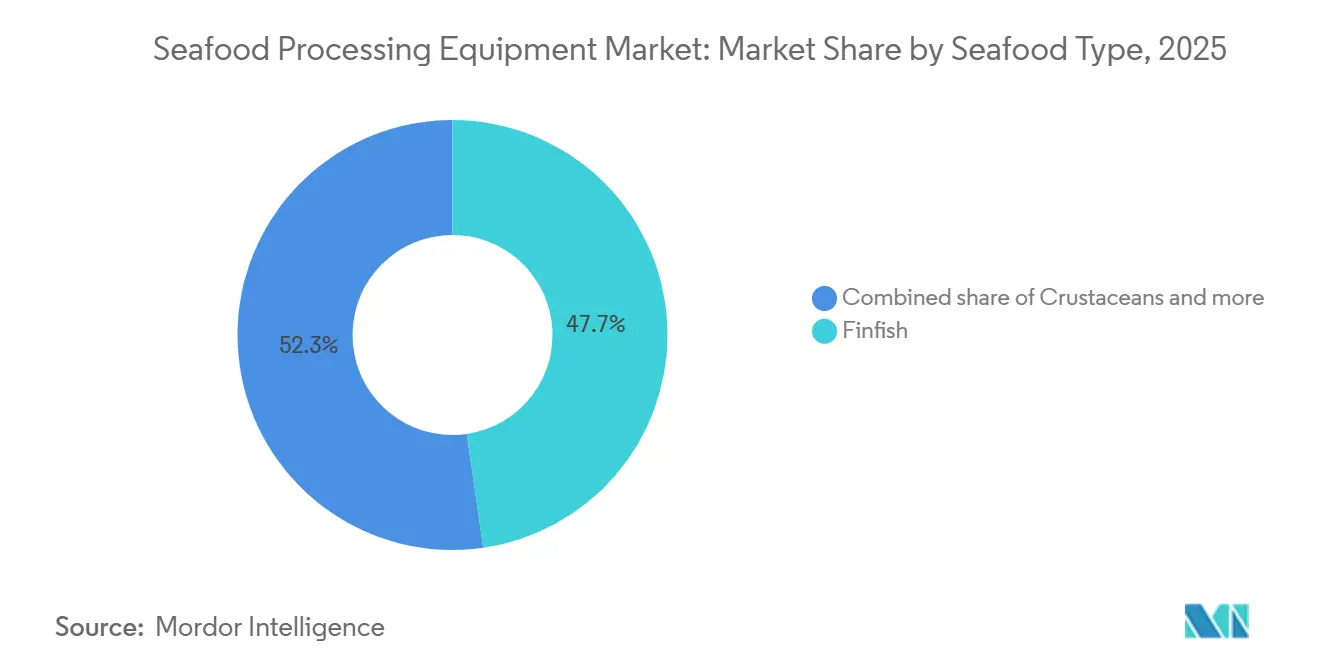
- By seafood type, finfish accounted for the largest share of the seafood processing equipment market, at 47.7% in 2025, while crustaceans are projected to grow at the fastest CAGR of 6.0% during 2026-2031.
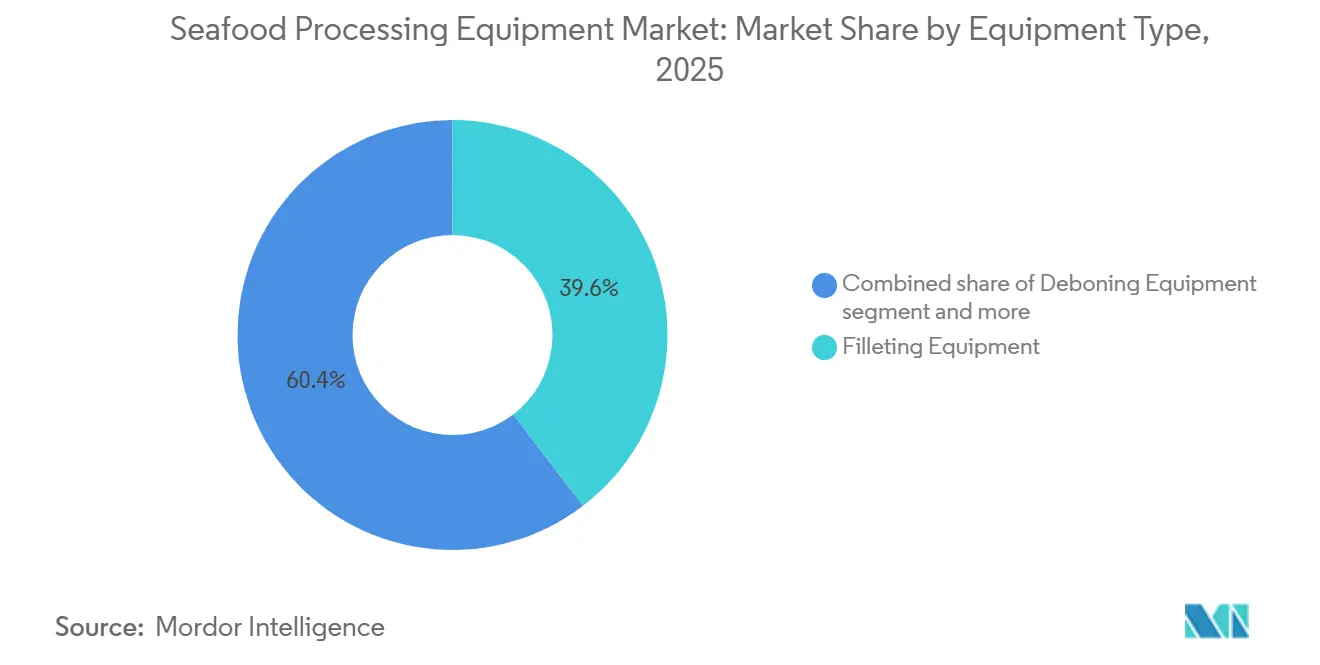
- By equipment type, filleting equipment led the seafood processing equipment market with a share of 39.6% in 2025, while deboning equipment is anticipated to register the fastest CAGR of 6.1% during 2026-2031.
- By automation level, automatic systems accounted for the largest share of the seafood processing equipment market, at 65.1% in 2025, and are projected to grow at the fastest CAGR of 6.4% during 2026-2031.
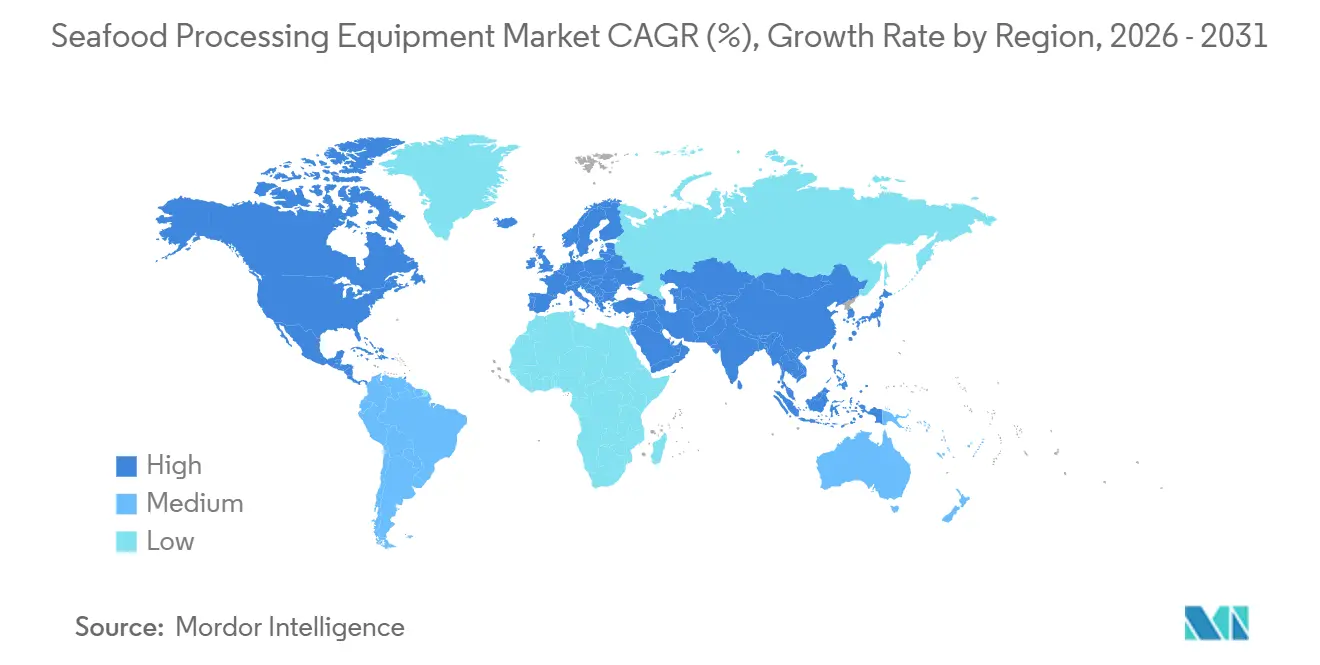
- By geography, Asia-Pacific accounted for the largest share of the seafood processing equipment market, at 34.4% in 2025, and is projected to grow at the fastest CAGR of 6.0% during 2026-2031.
Note: Market size and forecast figures in this report are generated using Mordor Intelligence’s proprietary estimation framework, updated with the latest available data and insights as of January 2026.
Global Seafood Processing Equipment Market Trends and Insights
Drivers Impact Analysis*
| Driver | (~) % Impact on CAGR Forecast | Geographic Relevance | Impact Timeline |
|---|---|---|---|
| Rising Demand for Processed and Ready-to-Eat Seafood | +1.5% | Global: highest demand density in Asia-Pacific and Western Europe | Medium term (2–4 years) |
| Automation to Offset Labor Scarcity and Seasonality | +1.2% | Global: highest labor pressure in North America, Northern Europe, Asia-Pacific export hubs | Short term (≤ 2 years) |
| Traceability-Ready Lines for Export Market Access | +0.6% | Asia-Pacific exporters and Europe-bound suppliers in North America and South America | Short term (≤ 2 years) |
| Tightening Hygienic Design Expectations Across Global Buyers | +0.5% | Europe (EHEDG-certified markets), North America, and Asia-Pacific premium processors | Medium term (2–4 years) |
| Higher Yield Recovery Economics in Premium Species Processing | +0.4% | Europe (salmon, whitefish), Asia-Pacific (shrimp, crab) | Long term (≥ 4 years) |
| Expansion of Low-Waste Secondary By-Product Recovery | +0.3% | Europe, Asia-Pacific; spill-over to North America | Long term (≥ 4 years) |
| Source: Mordor Intelligence | |||
Rising demand for processed and ready-to-eat seafood
Capital allocation in the seafood industry is shifting focus from just primary cutting lines to downstream processing and multi-stage equipment configurations. In 2024, China's aquaculture production hit 58.1 million metric tons, marking a 4.5% increase from the previous year. This uptick comes as domestic demand surges for pre-prepared and value-added seafood, especially in retail and hospitality sectors. A notable ripple effect of this demand is the deepening of processing requirements. What once was limited to heading and gutting has now expanded to include deboning, portioning, marinating, and modified-atmosphere packaging. This evolution necessitates capital investment in multi-equipment cycles rather than a simple single-machine replacement. Norway set a seafood export record in 2025, with aquaculture accounting for a significant 73% of the total export value. This underscores the substantial value premium in processed seafood formats, potent enough to reshape the output composition of a leading exporting nation. Processors keen on this premium are channeling investments into high-throughput lines, emphasizing species flexibility, a clear signal of this trend's growth trajectory.
Automation to offset labor scarcity and seasonality
Seafood processing grapples with a uniquely challenging labor landscape, marked by seasonal demand spikes, demanding working conditions, concentrated production locales, and regulatory hurdles on migrant labor. In July 2024, the U.S. seafood product preparation and packaging sector employed 32,100 individuals, a significant drop from 1990 levels. This decline underscores both structural shifts and intensified competition from overseas processing. The key takeaway? For this market, automation transcends mere cost-cutting; it's a strategy to ensure consistent throughput amidst high employee turnover and seasonal fluctuations. JBT Marel's Protein Solutions division reported a Q1 2026 revenue of USD 460 million, marking a 22% year-on-year surge, signaling a global uptick in capital expenditure on automated fish and seafood lines. In 2025, Canadian processor McGraw Seafood, aiming to diversify production and lessen labor reliance, installed a state-of-the-art, high-capacity packing and freezing line from Carsoe. This multi-species line, boasting automation, underscores the industry's pivot. Equipment performance metrics are evolving; the focus is shifting from merely minimizing labor costs to maximizing yield-per-kilogram. This shift is elevating the value of machines equipped with advanced vision systems and precise portion control, overshadowing those that prioritize raw throughput.
Traceability-ready lines for export market access
Starting January 10, 2026, the EU's Regulation (EU) 2023/2842 mandates digital traceability for exports, shifting compliance from mere documentation to a fundamental processing infrastructure necessity. Exporters to the EU are now required to digitally store and transmit data on fishery and aquaculture products throughout the supply chain. This directly affects the digital integration capabilities of processing lines. For processors in Thailand, Vietnam, India, and Ecuador, all key seafood suppliers to the EU, this regulation acts as a catalyst for capital expenditure, steering them towards modern, digitally integrated lines instead of outdated analog systems. In December 2025, the Philippines' Department of Agriculture rolled out FAO 275, setting new traceability and accreditation standards for foreign fishery establishments. This move not only targets foreign exporters but also exerts similar compliance pressures on Southeast Asia's domestic supply chains. The US Seafood Import Monitoring Program (SIMP) enforces chain-of-custody data mandates, promoting a harvest-to-export traceability framework at processing facilities. By upgrading to traceability-ready lines, processors are not just meeting today's regulatory demands; they're also gearing up for the EU's anticipated 2029 expansion of digital traceability to encompass processed, preserved, and imported products.
Tightening hygienic design expectations across global buyers
Across retail, foodservice, and institutional channels, buyer-mandated hygienic design has transitioned from a luxury to a fundamental procurement standard. The EHEDG Guideline 8 (Fourth Edition, December 2025), serving as the benchmark for EHEDG equipment certification, has raised the stakes. It now mandates cleanability testing under genuine operational scenarios, utilizing riboflavin or soil-retention verification. This shift elevates the engineering standards for food-contact surface designs across all equipment categories. Peer-reviewed studies highlight that the seafood industry's unique challenges, such as frequent wet cleaning, salt exposure, and temperature fluctuations, introduce degradation mechanisms not adequately addressed by standard hygienic design frameworks. This gap underscores a growing demand for stainless-steel designs tailored for marine durability. In response, BAADER rolled out a CiP (Clean in Place) retrofit for its BAADER 144 gutting machine in January 2026[2]Source: BAADER, “BAADER 144 Clean In Place Retrofit,” BAADER, baader.com. This move not only meets the industry's compliance needs but also provides a certification route for existing installations without necessitating a complete line replacement. As a result, compliance with hygienic design is birthing a lucrative retrofit and aftermarket revenue avenue for OEMs. Moreover, processors are increasingly opting for CiP conversions of their current lines over total capital replacements, marking a new procurement category that traditional equipment sales data overlooks.
Restraints Impact Analysis*
| Restraint | (~) % Impact on CAGR Forecast | Geographic Relevance | Impact Timeline |
|---|---|---|---|
| High Upfront Cost of Integrated Processing Lines | -1.0% | South America, MEA, SME processors globally | Medium term (2–4 years) |
| Refrigeration and Utility Compliance Burden | -0.5% | MEA, South America, South Asia | Medium term (2–4 years) |
| Nickel and Stainless Steel Cost Volatility | -0.4% | Global, particularly Europe and the Asia-Pacific | Short term (≤ 2 years) |
| Skills Gap in Programming, Maintenance, and Sanitation | -0.3% | Developing economies, emerging Asia-Pacific, and MEA markets | Long term (≥ 4 years) |
| Source: Mordor Intelligence | |||
High upfront cost of integrated processing lines
Small and medium-scale processors, which dominate the facility count in key producing nations like Ecuador, Peru, and Indonesia, face significant hurdles due to capital barriers in integrated processing lines. In Atlantic Canada, the seafood processing sector showcases this challenge: out of over 700 operating companies, only a quarter boast a workforce exceeding 120. Transitioning to automated lines demands not just financial investment but also skill upgrades and research and development, a leap many find insurmountable. This financial hurdle isn't merely about cost; it underscores a disparity: equipment tailored for large-scale industrial operations doesn't align with the production volumes of smaller processors. For OEMs, this means that while the market for integrated automated lines is predominantly with larger processors, there's a vast, untapped segment among smaller operations. These smaller entities, needing different product positioning and financing, represent both a replacement and an entry-level automation market. In response, manufacturers are rolling out Equipment-as-a-Service (EaaS) models and modular, scalable machine designs, though these innovations are still in their infancy in terms of adoption.
Nickel and stainless steel cost volatility
In 2026, Indonesia tightened its RKAB (Mining Quota) approval process, leading to a direct supply crunch in global nickel production. As a result, primary nickel output is set to dip by 4.2% year-on-year in 2026, marking the first supply deficit since 2021. For manufacturers of seafood processing equipment, 300-series stainless steel reigns supreme for food-contact surfaces. Notably, the surcharge for the 304-grade stainless steel surged by over 17.2% since January 2026. Additionally, between December 2025 and March 2026, prices for stainless steel in Southeast Asia climbed by 7.4%. This isn't just about heightened input costs; it's the uncertainty in procurement that's pivotal. The volatility in surcharges complicates long-term pricing commitments for OEMs. Consequently, dealers and distributors grapple with either absorbing the price risk or transferring it to end-customers, who then postpone capital purchase decisions. The European Carbon Border Adjustment Mechanism (CBAM), which came into full effect on January 1, 2026, imposes a permanent CO2 cost on every tonne of imported stainless steel[3]Source: European Commission, “Carbon Border Adjustment Mechanism,” EUR-Lex, eur-lex.europa.eu. This move structurally inflates material costs for equipment manufacturers sourcing from outside the EU. Smaller OEMs, lacking the scale to hedge against material costs or to maintain strategic stainless inventories, find their margins shrinking. This trend could potentially spur further consolidation within the mid-tier equipment supplier segment.
*Our forecasts treat driver/restraint impacts as directional, not additive. The impact forecasts reflect baseline growth, mix effects, and variable interactions.
Segment Analysis
By Seafood Type: Crustacean Processing Increasingly Defines Growth Trajectories
In 2025, finfish dominated the market, seizing 47.71% share, buoyed by the global processing of salmon, cod, tilapia, and pangasius. European and Asian facilities have widely adopted mature processing infrastructures, featuring established equipment for automated gutting, filleting, pinbone removal, and IQF freezing. Crustaceans, however, are on a growth trajectory, projected to expand at a 5.96% CAGR through 2031. This surge is fueled by the geographic spread of shrimp farming in South and Southeast Asia and the escalating retail value of processed shellfish worldwide. Major seafood-producing regions have witnessed a 25%+ uptick in the adoption of shrimp peeling automation, deveining, grading, and IQF output. While mollusks occupy a niche in the market, their processing demands technical specialization, with bivalve shucking and cleaning equipment needs diverging significantly from those of finfish or crustaceans. The OECD-FAO Agricultural Outlook 2025-2034 forecasts a 12% growth in fishmeal production from residues and by-products, underscoring the link between heightened finfish and crustacean processing volumes and the surge in secondary processing demand.
As vision-system integration advances from salmon filleting to shrimp grading and crab portioning, the gap in processing efficiency between finfish and crustacean equipment is diminishing. JBT Marel's FleXicut Jet, a testament to this trend, melds water-jet cutting robots with X-ray bone detection, pinpointing bones as tiny as 0.2mm. Originally crafted for premium finfish, this technology is now being adopted in crustacean and mixed-species lines. Meanwhile, the regulatory landscape for crustacean processing is tightening. Under EHEDG and ISO 22002-1:2025 mandates, processors must prove cleanability during full operations, not just at the design phase. This stringent compliance is pressuring older crustacean equipment replacements, especially in South and Southeast Asian export facilities, where hygienic design standards have historically trailed European norms.


By Equipment Type: Deboning and Pinbone Removal Attract Disproportionate Research and Development Investment
In 2025, filleting equipment captured a 39.62% share, highlighting its critical role in finfish primary processing. Automating filleting boosts throughput, ensures consistent portion weights, and reduces waste, with decades of installed base accumulation driving its dominance. Deboning equipment is projected to grow at a 6.11% CAGR through 2031, driven by demand for bone-free fillets in retail and foodservice, where convenience and liability are key. BAADER's 221 mackerel processing line, featuring AI-driven camera control for automatic pinbone removal, exemplifies innovation by integrating heading, gutting, and filleting with pinbone removal, improving yield and reducing handling. Gutting, scaling, and skinning equipment remain essential, with modernization focusing on hygienic design and Clean-in-Place (CiP) capabilities over new automation features.
A shift from single-function machines to modular platforms is reshaping equipment segmentation. BAADER's modular processing platform, unveiled at Seafood Processing Global 2026, uses interchangeable modules for configuration, upgrades, or expansions without full replacement, addressing the long capital cycle issue. GEA's PowerPak 5000 thermoforming packaging machine, introduced at Interpack 2026, targets medium-sized processors with a synchronized "One-Line Concept" integrating slicing, loading, packaging, and labeling at outputs up to 600 kg/h. These advancements blur the line between primary processing and downstream finishing as OEMs increasingly offer complete line solutions over standalone machines.
By Automation Level: Manual Lines Are Losing Ground to Economic Logic, Not Just Technology
In 2025, automatic systems commanded a dominant 65.13% market share and are projected to expand at a robust 6.41% CAGR through 2031, outpacing all other segments. This data underscores not just the advancements in automation technology but also highlights a pivotal shift: the economic threshold for automation has dipped, making it attainable for mid-scale processors. While manual lines still play a crucial role in handling diverse species mixes, specialty low-volume processing, and in markets where labor costs don't justify automation, several factors are reshaping this landscape. Rising labor shortages, stringent export compliance mandates pushing for digital traceability, and the heightened hygiene standards more easily met by automated systems are gradually undermining the economic rationale for manual processing, even in regions with lower labor costs. A testament to this shift, in 2025, IDI (Vietnam) broke ground on a USD ~28 million seafood processing facility, outfitted entirely with European automated machinery. This move underscores the newfound cost parity between local labor and automated operations, especially for products destined for export.
The industry's pivot from manual to automated systems is birthing a two-tier aftermarket. Facilities already harnessing automation now seek predictive maintenance, spare parts, and software enhancements. In contrast, those making the leap from manual to automated face a significant capital outlay, often supported by multilateral or government-backed export promotion initiatives. A case in point: Optimar clinched a NOK 70 million deal for a land-based salmon venture, integrating automated washing, ensilage, and slaughter systems, spotlighting the trend of substantial investments in single-facility automation. Furthermore, industry insights reveal a telling pattern: when annual maintenance costs on manual equipment surpass 18% of its original value, the return on investment for switching to automation typically materializes within 11-16 months. This predictable timeline is now on the radar of OEM service teams, who view it as a promising prospecting signal.
Geography Analysis
Asia-Pacific accounted for 34.4% of the seafood processing equipment market size in 2025 and is also projected to record the fastest regional growth at 6.0% CAGR through 2031. The region combines the largest seafood production base with the strongest mix of export processing and rising domestic demand for prepared seafood. China remained the world’s largest seafood producer in 2024, with a total output of 74.1 million metric tons and aquaculture output of 58.1 million metric tons. That production scale gives equipment suppliers a broad base across farmed species, primary processing, and value-added formats. Thailand, Indonesia, India, and Vietnam add further strength because export-oriented plants must meet traceability and hygiene requirements set by Europe, the United States, and Japan. With more than 91% of global aquaculture output linked to the region, Asia-Pacific remains central to the long-run expansion of the seafood processing equipment market.
Europe does not lead the seafood processing equipment market share by volume, but it remains the highest-specification regional cluster for premium processing lines. Norway’s seafood export value reached a record in 2025, with aquaculture contributing 73% of that total, which sustained investment in high-performance salmon and whitefish processing. The EU’s digital traceability rules from January 2026 are reinforcing demand for equipment with embedded data capture, lot tracking, and electronic documentation. European processors are also under stronger hygienic design scrutiny, which supports retrofit and replacement activity across established plants. At the same time, steel cost exposure is higher because imported material now carries an additional carbon cost layer, which raises the delivered cost of machinery and components in parts of the region.
North America is driven more by modernization than by new production scale in the seafood processing equipment market. Processors are replacing older lines with automated, hygiene-compliant systems that can reduce labor dependence and support species flexibility. South America offers a different profile because export volumes are large in shrimp, salmon, and tuna, but many facilities still operate below the automation and sanitation standards seen in Europe and North America. The Middle East and Africa remain smaller in current demand, but the region is gaining visibility as food security strategies begin to include domestic seafood processing capacity, which is already attracting interest from leading European suppliers.

Competitive Landscape
The seafood processing equipment market exhibits a dual nature: while it's moderately concentrated at the top tier, a broader supplier base remains fragmented. Premium processing prominently features names like BAADER, JBT Marel, and GEA Group. Yet, a host of mid-sized and specialist OEMs actively cater to species-specific and regional applications. The January 2025 merger between JBT and Marel birthed a more expansive integrated platform, boasting a vast geographic footprint. The newly formed entity projected a revenue range of USD 3,990 million to USD 4,065 million for the full year of 2026. This scale not only amplifies the company's market presence but also enhances its ability to cross-sell equipment, software, services, and spare parts across a footprint spanning over 50 countries. Such a strategy holds significant weight in the seafood processing equipment market, where buyers increasingly favor a singular supplier capable of supporting multiple stages of the processing line throughout its asset life.
BAADER is carving its niche with a focus on modular line architecture, adaptability to various species, and a pronounced emphasis on by-product valorization and hygienic design. Indicators of its strategic direction are evident in its 2026 platform presentation and the "Clean in Place" retrofit, both underscoring a pivot towards upgradeability over mere one-time machine sales. GEA, leveraging its broader food processing expertise, is making inroads into the seafood processing equipment market. By capitalizing on its strengths in packaging and adjacent process equipment, GEA aims to harness downstream value. This approach is timely, given the blurring lines between core seafood processing and final packaging. As plants increasingly opt for synchronized lines over isolated units, the competitive focus is shifting. It's no longer just about machine performance; the emphasis is now on line integration, software capabilities, sanitation assurance, and generating recurring service income.
Mid-tier players like Optimar, Cabinplant, Carsoe, Cretel, and SEAC are carving out their space. They leverage regional service depth, niche species expertise, and full-line integration in select applications. Opportunities abound, especially in financing models tailored for smaller processors, retrofit-ready vision software, and by-product recovery systems that enhance raw material utilization. Patent activities, notably BAADER's filings emphasizing improved traceability and trimming control in processing workflows, further underscore this trend. While the seafood processing equipment market remains accessible for specialists, the top tier is consolidating its dominance through scale, modularity, and a commitment to long-term service models.
Seafood Processing Equipment Industry Leaders
Cabinplant A/S
BAADER
JBT Corporation
Marel
GEA Group Aktiengesellschaft
- *Disclaimer: Major Players sorted in no particular order

Recent Industry Developments
- May 2026: GEA Group launched the PowerPak 5000 thermoforming packaging machine at Interpack 2026 in Düsseldorf, specifically targeting mid-sized seafood, meat, and ready-meal processors. The system operates as a synchronized "One-Line Concept" integrating slicing, loading, packaging, and labeling at outputs of up to 600 kg/h.
- April 2026: GEA Group introduced the MultiJector 500 brine injector at Seafood Processing Global 2026 in Barcelona, expanding its injection portfolio for small- to mid-capacity fish and protein processing lines, with a modular filtration system designed for improved hygiene compliance and brine retention.
- January 2026: JBT Marel and Almarai signed a multimillion-euro contract for 3 advanced fish processing lines at Almarai's facility in King Abdullah Economic City, Saudi Arabia, scheduled for installation in late 2026. The partnership marks JBT Marel's first large-scale seafood collaboration in the Middle East, supporting Saudi Vision 2030 food security objectives and targeting salmon, whitefish, and regional species.


Global Seafood Processing Equipment Market Report Scope
Seafood processing equipment refers to the specialized industrial machinery, automated systems, and mechanical tools used to transform raw seafood (including finfish, crustaceans, mollusks, and cephalopods) into safe, value-added, and market-ready food products. The seafood processing equipment market is segmented by seafood type, equipment type, automation level, and geography. By seafood type, the market is segmented into finfish, crustaceans, mollusks, and other seafood types. By equipment type, the market is segmented into filleting, gutting, scaling, skinning, deboning, and other equipment types. By automation level, the market is segmented into manual and automatic. By geography, the market is segmented into North America, Europe, Asia-Pacific, South America, and the Middle East and Africa. The Market Forecasts are Provided in Terms of Value (USD).
| Finfish |
| Crustaceans |
| Mollusks |
| Other Seafood Types |
| Filleting Equipment |
| Gutting Equipment |
| Scaling Equipment |
| Skinning Equipment |
| Deboning Equipment |
| Other Equipment Types |
| Manual |
| Automatic |
| North America | United States |
| Canada | |
| Mexico | |
| Rest of North America | |
| Europe | United Kingdom |
| Germany | |
| France | |
| Denmark | |
| Spain | |
| Iceland | |
| Norway | |
| Poland | |
| Netherlands | |
| Rest of Europe | |
| Asia-Pacific | China |
| Japan | |
| India | |
| Thailand | |
| Indonesia | |
| South Korea | |
| Australia | |
| Rest of Asia-Pacific | |
| South America | Brazil |
| Argentina | |
| Ecuador | |
| Peru | |
| Chile | |
| Rest of South America | |
| Middle East and Africa | United Arab Emirates |
| South Africa | |
| Saudi Arabia | |
| Egypt | |
| Morocco | |
| Turkey | |
| Rest of Middle East and Africa |
| Seafood Type | Finfish | |
| Crustaceans | ||
| Mollusks | ||
| Other Seafood Types | ||
| Equipment Type | Filleting Equipment | |
| Gutting Equipment | ||
| Scaling Equipment | ||
| Skinning Equipment | ||
| Deboning Equipment | ||
| Other Equipment Types | ||
| Automation Level | Manual | |
| Automatic | ||
| Geography | North America | United States |
| Canada | ||
| Mexico | ||
| Rest of North America | ||
| Europe | United Kingdom | |
| Germany | ||
| France | ||
| Denmark | ||
| Spain | ||
| Iceland | ||
| Norway | ||
| Poland | ||
| Netherlands | ||
| Rest of Europe | ||
| Asia-Pacific | China | |
| Japan | ||
| India | ||
| Thailand | ||
| Indonesia | ||
| South Korea | ||
| Australia | ||
| Rest of Asia-Pacific | ||
| South America | Brazil | |
| Argentina | ||
| Ecuador | ||
| Peru | ||
| Chile | ||
| Rest of South America | ||
| Middle East and Africa | United Arab Emirates | |
| South Africa | ||
| Saudi Arabia | ||
| Egypt | ||
| Morocco | ||
| Turkey | ||
| Rest of Middle East and Africa | ||


Key Questions Answered in the Report
What is the current size of the seafood processing equipment sector?
The seafood processing equipment market size stood at USD 2.6 billion in 2025 and is estimated at USD 2.8 billion in 2026, with a projected value of USD 3.5 billion by 2031.
What is driving growth in seafood processing equipment demand?
The main growth drivers are demand for ready-to-eat seafood, labor scarcity, digital traceability rules, and tighter hygienic design requirements across export and premium processing lines.
Which segment leads by seafood type?
Finfish led with 47.7% revenue share in 2025 because salmon, cod, tilapia, and similar high-volume species already support large installed processing bases.
Which equipment category is growing the fastest?
Deboning equipment is the fastest-growing category with a projected 6.1% CAGR through 2031, supported by demand for bone-free and convenience-oriented seafood products.
Page last updated on:


