Pharmacy Automation Market Size and Share
Market Overview
| Study Period | 2020 - 2031 |
|---|---|
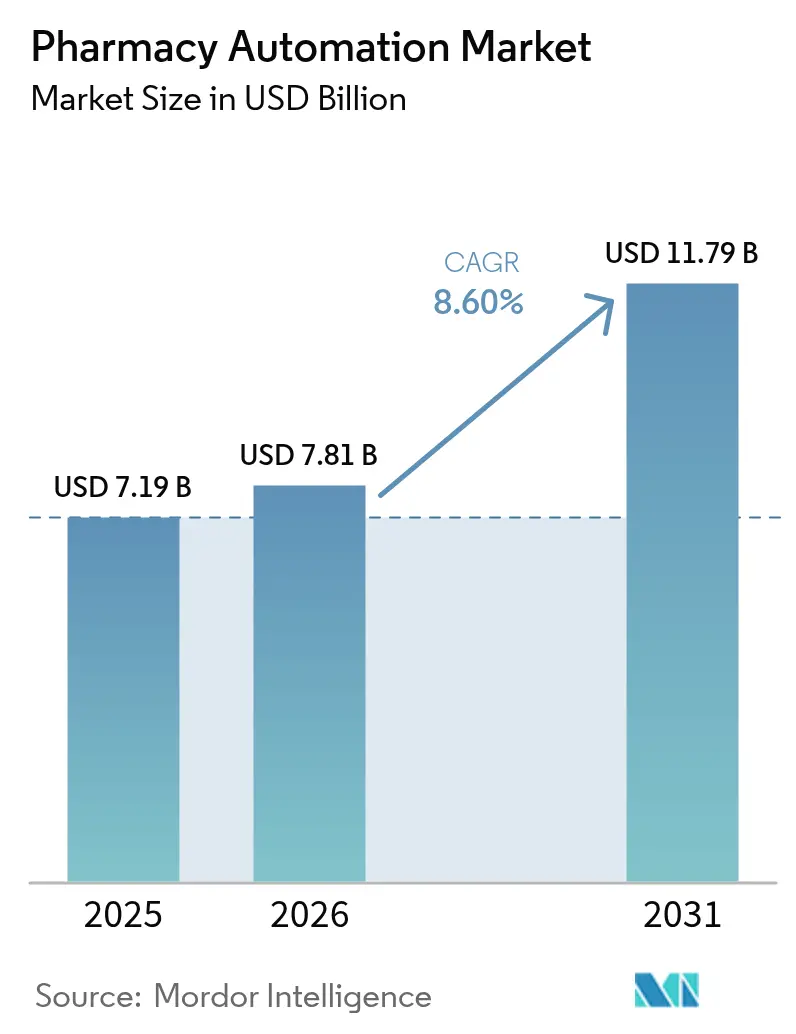
| Market Size (2026) | USD 7.81 Billion |
| Market Size (2031) | USD 11.79 Billion |
| Growth Rate (2026 - 2031) | 8.60% CAGR |
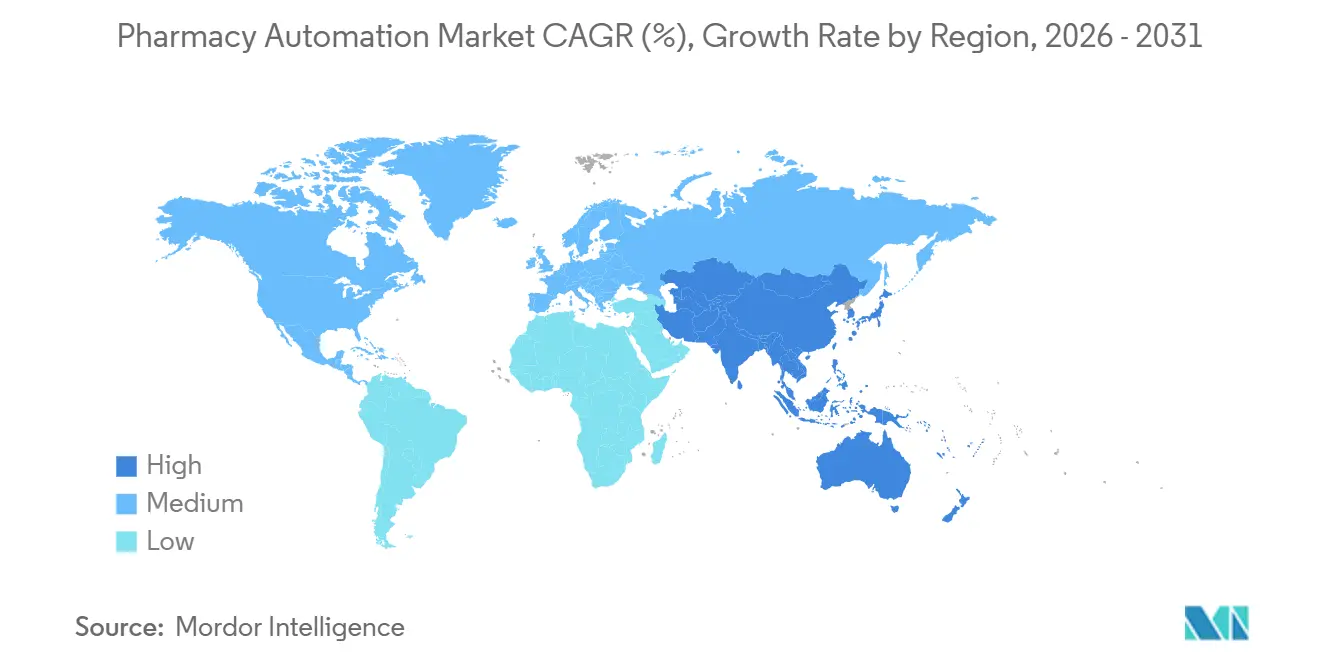
| Fastest Growing Market | Asia Pacific |
| Largest Market | North America |
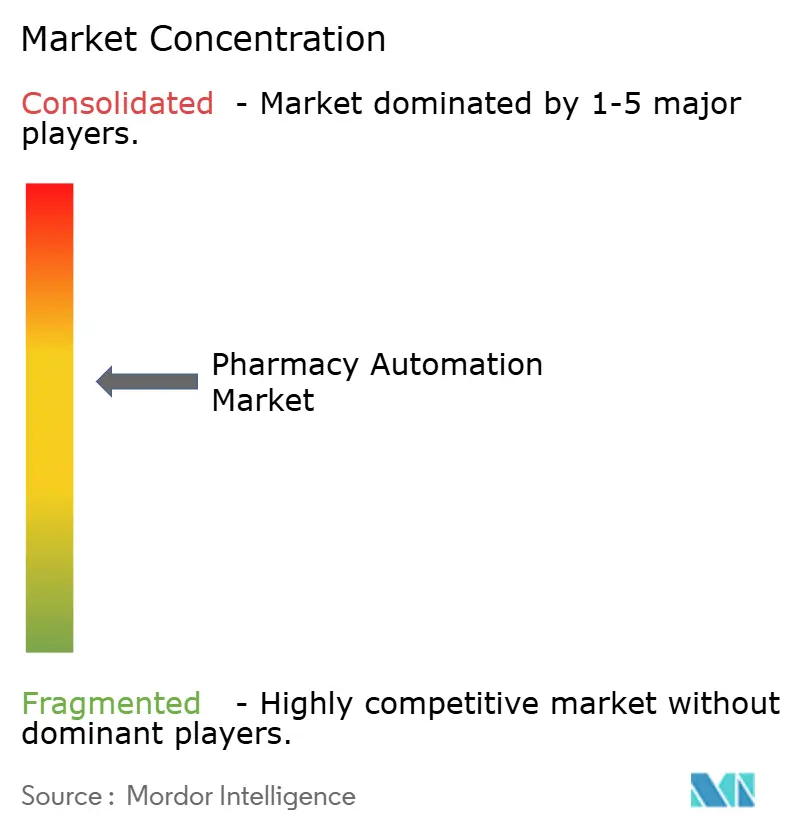
| Market Concentration | Medium |
Major Players *Disclaimer: Major Players sorted in no particular order Image © Mordor Intelligence. Reuse requires attribution under CC BY 4.0. | |
Pharmacy Automation Market Analysis by Mordor Intelligence
The Pharmacy Automation Market size is projected to expand from USD 7.19 billion in 2025 and USD 7.81 billion in 2026 to USD 11.79 billion by 2031, registering a CAGR of 8.60% between 2026 to 2031.
Workforce shortages are compelling hospital systems to redirect capital toward robotics that can absorb routine dispensing, compounding, and inventory‐reconciliation tasks, an investment dynamic reinforced by the FDA’s 2024 liability guidance for machine-dispensed doses. Medicare’s quality-reporting incentives and barcode-driven traceability rules in Europe are turning automation from an efficiency upgrade into a compliance requirement. Cloud-hosted pharmacy platforms are enabling real-time inventory visibility across multi-site health systems, cutting stock-outs by up to 40% and trimming expired-drug write-offs that once averaged USD 250,000 per year for a 300-bed hospital. Competitive pressure is also accelerating adoption: Amazon Pharmacy and Mark Cuban Cost Plus Drug Company now run fulfillment hubs that fill more than 10,000 prescriptions per hour with near-zero human intervention, a throughput benchmark traditional mail-order operators cannot match without scaling robotics.
Key Report Takeaways
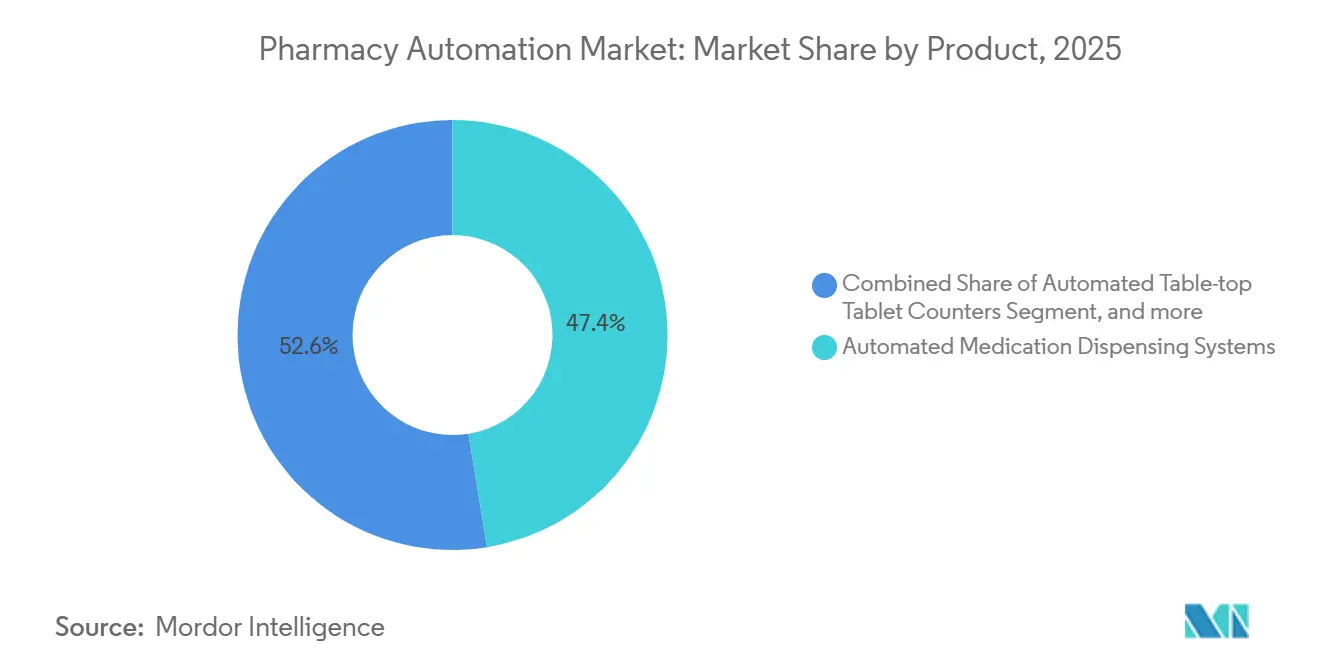
- By product category, automated medication dispensing systems led with 47.43% revenue share in 2025, while robotic sterile compounding systems are projected to expand at a 10.43% CAGR through 2031.
- By end user, hospital pharmacies accounted for 62.54% of spending in 2025; mail-order and ePharmacies are forecast to grow at a 11.43% CAGR through 2031.
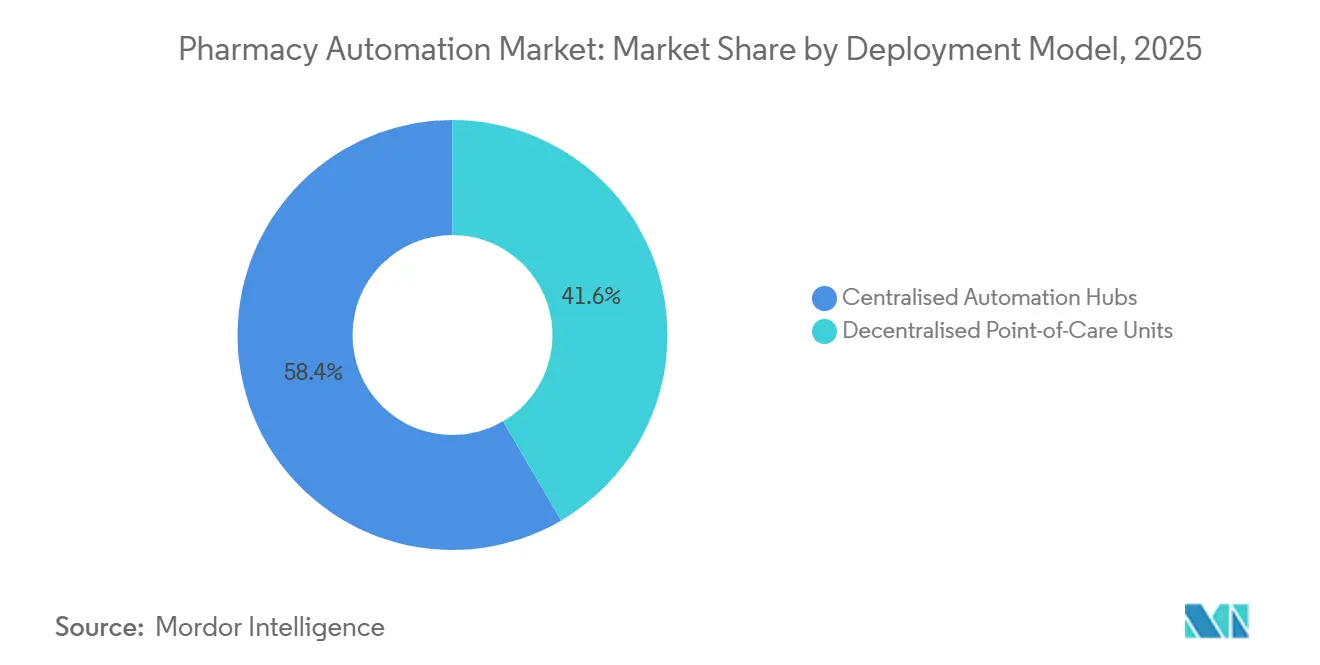
- By deployment model, centralized automation hubs accounted for 58.43% of installations in 2025, yet decentralized point-of-care units will advance at a 10.56% CAGR during 2026-2031.
- By facility size, institutions with more than 500 beds or 250-plus retail outlets controlled 55.32% of installations in 2025, while independent operators and small hospitals are set to rise at a 10.76% CAGR over the same horizon.
- Regionally, North America captured 41.56% of 2025 revenue; Asia-Pacific is on track for the fastest regional expansion at a 9.54% CAGR to 2031.
Note: Market size and forecast figures in this report are generated using Mordor Intelligence’s proprietary estimation framework, updated with the latest available data and insights as of 2026.
Global Pharmacy Automation Market Trends and Insights
Driver Impact Analysis*
| Driver | (~) % Impact on CAGR Forecast | Geographic Relevance | Impact Timeline |
|---|---|---|---|
| Rising Healthcare Expenditure and Digital Transformation Initiatives | +1.8% | Global, with concentration in North America and Western Europe | Medium term (2-4 years) |
| Growing Focus on Medication Safety and Regulatory Compliance | +1.5% | Global, particularly North America and EU under FDA and EMA oversight | Short term (≤ 2 years) |
| Increasing Labor Shortages in Pharmacy Workforce | +2.1% | North America, Western Europe, Japan | Short term (≤ 2 years) |
| Expansion of Telehealth and E-Pharmacy Channels | +1.4% | North America, Asia-Pacific urban centers, select EU markets | Medium term (2-4 years) |
| Accelerating Adoption of Artificial Intelligence and Robotics | +1.2% | North America, China, Japan, South Korea | Long term (≥ 4 years) |
| Integration of Cloud-Based Platforms and Software-as-a-Service Models | +0.9% | Global, early traction in North America and Nordics | Medium term (2-4 years) |
| Source: Mordor Intelligence | |||
Rising Healthcare Expenditure and Digital Transformation Initiatives
Escalating national health budgets are putting pressure on providers to unlock operational savings, and automated pharmacy systems are proving to be one of the few levers that simultaneously cut labor costs, reduce errors, and satisfy information-sharing mandates. A 400-bed academic hospital demonstrated that centralized robotics eliminated 12-18 full-time equivalent roles, resulting in annual savings of USD 1.2-1.8 million. The 21st Century Cures Act obliges hospitals to expose medication data via FHIR interfaces; platforms with native FHIR integration avoid middleware fees and accelerate time-to-value. Cloud hosting further improves visibility across enterprise drug stores, reducing back-order frequency by 30-40% and mitigating expiry losses[1]American Society of Health-System Pharmacists, “National Survey of Pharmacy Practice 2025,” ashp.org. Quality-reporting programs now reimburse facilities that submit machine-logged reconciliation metrics, pushing automation beyond the finance department into regulatory strategy.
Growing Focus on Medication Safety and Regulatory Compliance
Medication-error deaths exceed 7,000 annually in the United States, and dispensing mistakes cause roughly one-fifth of incidents. Barcode-verified cabinets and gravimetric compounders eliminate more than 85% of wrong-drug events, a performance now embedded in Joint Commission surveys. In 2024, FDA guidance clarified that hospitals using recognized electronic distribution systems can satisfy the Drug Supply Chain Security Act traceability rules without manual scanning. Europe’s Falsified Medicines Directive enforces unique identifiers on every pack, a workload only high-speed automated lines can shoulder. Medical-malpractice insurers in four U.S. states are rewarding robotic installations with 5-10% premium cuts, turning compliance capability into a revenue-protecting asset.
Increasing Labor Shortages in the Pharmacy Workforce
HRSA forecasts a 30,400-pharmacist deficit by 2038; hospitals already report 15-20% pharmacist vacancies, forcing reliance on traveling staff earning wage premiums of more than 40%. Robots now cover routine dispensing overnight, freeing credentialed clinicians for stewardship and counseling that attract billable revenue. A 2025 ASHP survey ranked workforce pressure above cost savings as the top automation driver for the first time in 15 years. Retail chains have shuttered more than 1,500 stores since 2020, channeling prescriptions into fewer, highly automated outlets. Japan’s Ministry of Health subsidizes up to 50% of robotic compounders for rural hospitals, demonstrating how automation doubles as workforce policy.
Expansion of Telehealth and E-Pharmacy Channels
Virtual visits still represent about 38% of U.S. outpatient encounters and each teleconsult frequently generates an e-prescription destined for mail order. Amazon Pharmacy’s fulfillment hubs process more than 10,000 scripts per hour with robotic picking and algorithmic replenishment, a throughput bar that is reset industrywide. Serialization rules effective in 2023 obliged e-pharmacies to add track-and-trace automation, cementing a capability gap with smaller rivals. States such as North Carolina and Texas now authorize a single centralized-fill site to serve up to 25 stores, enabling regional chains to amortize robotics across broader volumes. Medicare Part D plans are steering beneficiaries into preferred mail-order networks that rely on automation to honor 48-hour turnaround guarantees.
Restraints Impact Analysis*
| Restraint | (~) % Impact on CAGR Forecast | Geographic Relevance | Impact Timeline |
|---|---|---|---|
| High Upfront Capital and Maintenance Burden | -1.3% | Global, acute impact in rural and small-format pharmacies | Short term (≤ 2 years) |
| Interoperability Challenges with Legacy IT Systems | -0.8% | North America, Europe, select Asia-Pacific markets with fragmented EHR adoption | Medium term (2-4 years) |
| Data Privacy, Cybersecurity, and Compliance Risks | -0.6% | Global, heightened scrutiny in North America and EU under HIPAA and GDPR | Short term (≤ 2 years) |
| Uncertain Return on Investment for Small and Rural Pharmacies | -0.9% | Rural North America, emerging Asia-Pacific, Latin America | Medium term (2-4 years) |
| Source: Mordor Intelligence | |||
High Upfront Capital and Maintenance Burden
A centralized robotic platform for a 300-bed hospital costs USD 1.5-2.5 million and requires service contracts priced at 12-15% of capital each year, extending the payback to as long as 6 years. Independent pharmacies running under 150 daily scripts struggle because their labor savings seldom equal even one full-time salary. Subscription bundles from vendors such as Parata convert capital into monthly operating fees of USD 3,500-5,000 but still require minimum-volume clauses that expose operators to penalties in low-season months. Component wear adds roughly USD 30,000 in annual upkeep. Rural hospitals outside 150-mile service radii face 48-hour wait times for engineers unless they purchase premium support.
Interoperability Challenges with Legacy IT Systems
Over half of U.S. hospital pharmacies still rely on software built before 2015, many lacking modern APIs. Bridging a siloed cabinet and a 1990s-era pharmacy system often necessitates USD 100,000-300,000 in middleware and up to a year of validation work. Germany exemplifies fragmentation: its hospital market uses more than 400 pharmacy information systems, few of which interoperate without proprietary adapters[2]German Hospital Federation, “Hospital Pharmacy IT Landscape 2025,” dkgev.de. Hospitals with tight IT budgets postpone automation until broader electronic-record upgrades become unavoidable. Cybersecurity adds another hurdle, as adding networked cabinets increases the attack surface that legacy applications were never designed to defend against.
*Our forecasts treat driver/restraint impacts as directional, not additive. The impact forecasts reflect baseline growth, mix effects, and variable interactions.
Segment Analysis
By Product: Precision Compounding Outpaces Dispensing
Robotic sterile compounding systems will grow at a 10.43% CAGR through 2031, faster than any other product category in the pharmacy automation market, driven by oncology regimens that require sub-microgram accuracy. Automated medication dispensing commanded 47.43% revenue share in 2025, illustrating scale penetration but also signaling a maturing installed base. ICU Medical’s FDA-cleared IntelliMix supports neonatal parenteral nutrition, opening high-liability use cases where automation is rapidly becoming non-negotiable. The pharmacy automation market size allocated to automated tablet counters remains modest, yet their entry price of USD 15,000-25,000 keeps independents engaged.
Analytics-driven software layers are turning hardware into data platforms that predict stock-order spikes and pre-stage inventory, cutting emergency restock trips by 40%. Automated storage and retrieval systems reduce pick times from eight minutes to under 60 seconds, increasing throughput without proportional staffing. Given that oncology and gene-therapy protocols incur six-figure per-dose costs, closed-system compounders are now bundled into payer risk-management strategies, reinforcing premium-tier growth inside the pharmacy automation market.


By End User: E-Pharmacy Volumes Tilt the Mix
Hospital pharmacies absorbed 62.54% of 2025 expenditure, cementing their centrality in the pharmacy automation market, yet their growth is slowing as cabinet refresh cycles taper. In contrast, mail-order and ePharmacies will post an 11.43% CAGR to 2031 as central-fill megahubs replicate Amazon-style throughput. Retail chains are consolidating operations; Walgreens closed 150 U.S. locations in 2024 and channeled volume to automated regional centers.
Long-term-care facilities value dose-packaging robots that cut medication-pass time 30-40%, a labor offset that enables cost recapture despite low reimbursement. The pharmacy automation market share accruing to specialty pharmacies handling biologics is climbing because robotic cold-chain systems assure ±0.5 °C compliance that manual fridges struggle to guarantee.
By Deployment Model: Cabinets Move Closer to the Bedside
Centralized automation hubs accounted for 58.43% of deployments in 2025, reflecting legacy investments in hospital basements and mail-order facilities. Nonetheless, decentralized point-of-care units will advance at a 10.56% CAGR, spurred by evidence that bedside cabinets cut sepsis time-to-first-dose by 38%. BD’s biometric-enabled MedStation now validates controlled-substance withdrawals in real time, easing Drug Enforcement Administration audit risk.
Many networks now pursue hybrid architectures in which centralized robots batch routine oral-solids while decentralized units stock high-acuity injectables. State boards are updating statutes to legitimize this split deployment, allowing a single pharmacy license to cover up to 25 dispensing satellites.
By Pharmacy Size: Modular Designs Democratize Robotics
Operators with more than 500 beds or 250 retail outlets captured 55.32% of 2025 installations, but independents and small hospitals will grow the fastest at 10.76% CAGR through 2031. Leasing and SaaS models align costs with prescription volume, easing entry barriers to the pharmacy automation market. RxSafe’s RapidPakRx occupies only 12 square feet yet stores 300 SKUs and dispenses 60 prescriptions an hour, a throughput level that makes automation viable for a 150-script-per-day store. Japanese subsidies covering up to half of robotic-compounding equipment for rural sites illustrate how public policy can close affordability gaps.
Geography Analysis
North America contributed 41.56% of 2025 global revenue, anchored by Medicare quality-reporting bonuses that acknowledge automated reconciliation logs as evidence of safe practice. Hospital groups are pushing decentralized cabinets into emergency departments, cutting stat-order cycle times from 45 minutes to under 8. Canada’s provinces pilot regional compounding centers supervised remotely, a model that leverages robotics to pool scarce pharmacist labor. Mexico’s private hospitals deploy dispensing cabinets to meet Joint Commission International standards, a prerequisite for lucrative medical-tourism contracts. The latest FDA guidance clarified liability boundaries for machine-dispensed doses, unfreezing procurement across U.S. ambulatory surgery centers.
Asia-Pacific will record the fastest growth, with a 9.54% CAGR through 2031. China mandates e-prescription routing for all tertiary hospitals by 2027, an edict that effectively pre-installs demand for central hubs and AI-assisted routing engines[3]China National Healthcare Security Administration, “Electronic Prescription Routing Mandate,” nhsa.gov.cn. Japan subsidizes up to 50% of robotic compounders serving aging populations, normalizing automation in community hospitals. India’s major private chains are differentiating oncology services with robotic sterile compounders, while South Korea pilots reimbursements for pharmacist-led therapy management that presuppose robots handle repetitive dispensing. Australia’s reimbursement formula will soon reward operators who keep dispensing error rates below 1%, a threshold nearly impossible to achieve without robotics.
Europe’s progress pivots on traceability rules under the Falsified Medicines Directive, which require unit-dose barcoding that manual lines cannot execute economically. Germany’s patchwork of more than 400 pharmacy IT systems inflates integration costs and slows uptake. The United Kingdom focuses on regional hubs to address pharmacist shortages, while France is piloting a national track-and-trace database that will be mandatory by 2028. Southern Europe lags due to budget and organizational fragmentation, yet private groups in Spain and Italy are racing to adopt robotic packaging to secure international patient revenue. Early deployments in Gulf Cooperation Council megahospitals hint at future acceleration in the Middle East, whereas high import tariffs and thin reimbursement continue to cap Latin American expansion.

Competitive Landscape
Five suppliers—Omnicell, BD, Baxter, McKesson, and Swisslog Healthcare—control about 60% of the pharmacy automation market revenue, conveying moderate concentration. Omnicell and BD dominate hospital cabinets through tight EHR integrations but face margin squeeze from SaaS competitors offering modular subscriptions. RxSafe targets floor-space-constrained independents, while NewIcon secures Nordic tenders by proving interoperability with national electronic records. Vendors now differentiate on predictive analytics rather than raw hardware speed; BD algorithms surface drug-interaction alerts within two minutes, framing medication safety as a software service.
Horizontal expansion is giving way to vertical plays. Omnicell absorbed Aesynt’s IV business in 2024, and Baxter bundles its IntelliMix robot into nutrition protocols via outcome-based contracts. Amazon Pharmacy resets fulfillment benchmarks with 10,000-script-per-hour hubs, forcing distributors like McKesson to invest USD 200 million in similar robotics. Patent filings show Omnicell prioritizes AI-based inventory optimization, while BD focuses on biometric security and blockchain traceability. Regulatory credentials are proving decisive; vendors able to show HITRUST certification and native FHIR compatibility often trim six months from hospital purchasing cycles. Capital intensity and uncertain ROI in rural sites remain adoption brakes, opening whitespace for leasing and usage-based pricing.
Pharmacy Automation Industry Leaders
Capsa Healthcare
Omnicell Inc.
Parata Systems LLC
Scriptpro LLC
Arxium Inc.
- *Disclaimer: Major Players sorted in no particular order

Recent Industry Developments
- February 2026: Swisslog Healthcare, one of the leading suppliers of pharmacy and transport automation solutions, launched Motif, a compact tabletop strip packager designed to deliver accuracy, adaptability, and performance in a streamlined solution for pharmacies of all sizes.
- September 2025: BD (Becton, Dickinson and Company), one of the leading global medical technology company, announced a pharmacy automation partnership with Henry Ford Health to develop the health system pharmacy of the future, with an initial focus on a robotic solution that will enable patients to pick up select prescriptions at their convenience — 24 hours a day, seven days a week.
- July 2025: Merck KGaA, one of the leading science and technology companies, has launched the AAW™ Automated Assay Workstation, a solution powered by Opentrons, a leader in lab automation and accessible robotics.


Global Pharmacy Automation Market Report Scope
As per the scope of this report, pharmacy automation encompasses centralized or decentralized automated dispensing, packing, labeling, and other systems, which help reduce dispensing errors while improving the workflow efficiency of hospital nursing staff and pharmacies.
The pharmacy automation market is segmented by product, end user, and geography. By product, the market is segmented into automated medication dispensing systems, automated packaging and labeling systems, automated table-top counters, automated storage and retrieval systems, and other products. By end user, the market is segmented into hospital pharmacies and retail pharmacies. By geography, the market is segmented into North America, Europe, Asia-Pacific, the Middle East and Africa, and South America. The report also covers the estimated market sizes and trends for 17 countries across major regions globally. The report offers the value (USD) for the above segments.
| Automated Medication Dispensing Systems |
| Automated Packaging & Labeling Systems |
| Automated Table-top Tablet Counters |
| Automated Storage & Retrieval Systems |
| Robotic Sterile Compounding Systems |
| Pharmacist Workflow & Analytics Software |
| Hospital Pharmacies (In-patient, Out-patient) |
| Retail & Chain Pharmacies |
| Mail-order / ePharmacies |
| Long-term-care & Specialty Pharmacies |
| Centralised Automation Hubs |
| Decentralised Point-of-Care Units |
| >500 beds / >250 stores |
| 100-499 beds / 50-249 stores |
| <100 beds / Independent stores |
| North America | United States |
| Canada | |
| Mexico | |
| Europe | Germany |
| United Kingdom | |
| France | |
| Italy | |
| Spain | |
| Rest of Europe | |
| Asia-Pacific | China |
| Japan | |
| India | |
| Australia | |
| South Korea | |
| Rest of Asia-Pacific | |
| Middle East & Africa | GCC |
| South Africa | |
| Rest of Middle East & Africa | |
| South America | Brazil |
| Argentina | |
| Rest of South America |
| By Product | Automated Medication Dispensing Systems | |
| Automated Packaging & Labeling Systems | ||
| Automated Table-top Tablet Counters | ||
| Automated Storage & Retrieval Systems | ||
| Robotic Sterile Compounding Systems | ||
| Pharmacist Workflow & Analytics Software | ||
| By End User | Hospital Pharmacies (In-patient, Out-patient) | |
| Retail & Chain Pharmacies | ||
| Mail-order / ePharmacies | ||
| Long-term-care & Specialty Pharmacies | ||
| By Deployment Model | Centralised Automation Hubs | |
| Decentralised Point-of-Care Units | ||
| By Pharmacy Size | >500 beds / >250 stores | |
| 100-499 beds / 50-249 stores | ||
| <100 beds / Independent stores | ||
| Geography | North America | United States |
| Canada | ||
| Mexico | ||
| Europe | Germany | |
| United Kingdom | ||
| France | ||
| Italy | ||
| Spain | ||
| Rest of Europe | ||
| Asia-Pacific | China | |
| Japan | ||
| India | ||
| Australia | ||
| South Korea | ||
| Rest of Asia-Pacific | ||
| Middle East & Africa | GCC | |
| South Africa | ||
| Rest of Middle East & Africa | ||
| South America | Brazil | |
| Argentina | ||
| Rest of South America | ||


Key Questions Answered in the Report
What was the global pharmacy automation market size in 2026?
It was USD 7.81 billion.
How fast is the pharmacy automation market expected to grow?
The market is projected to advance at an 8.60% CAGR between 2026 and 2031.
Which product segment will expand the quickest?
Robotic sterile compounding systems are forecast to grow at a 10.43% CAGR through 2031.
Why are decentralized point-of-care cabinets gaining popularity?
They cut stat-order turnaround times from 45 minutes to under eight, improving clinical response in high-acuity settings.
Which region is poised for the fastest growth?
Asia-Pacific is expected to register a 9.54% CAGR between 2026 and 2031, led by China and Japan.
What is the biggest barrier for small pharmacies?
High upfront capital and ongoing maintenance costs lengthen payback periods beyond typical planning horizons.
Page last updated on:


