Market Overview
| Study Period | 2020 - 2031 |
|---|---|
| Market Size (2026) | USD 70 Billion |
| Market Size (2031) | USD 192.78 Billion |
| Growth Rate (2026 - 2031) | 22.46% CAGR |
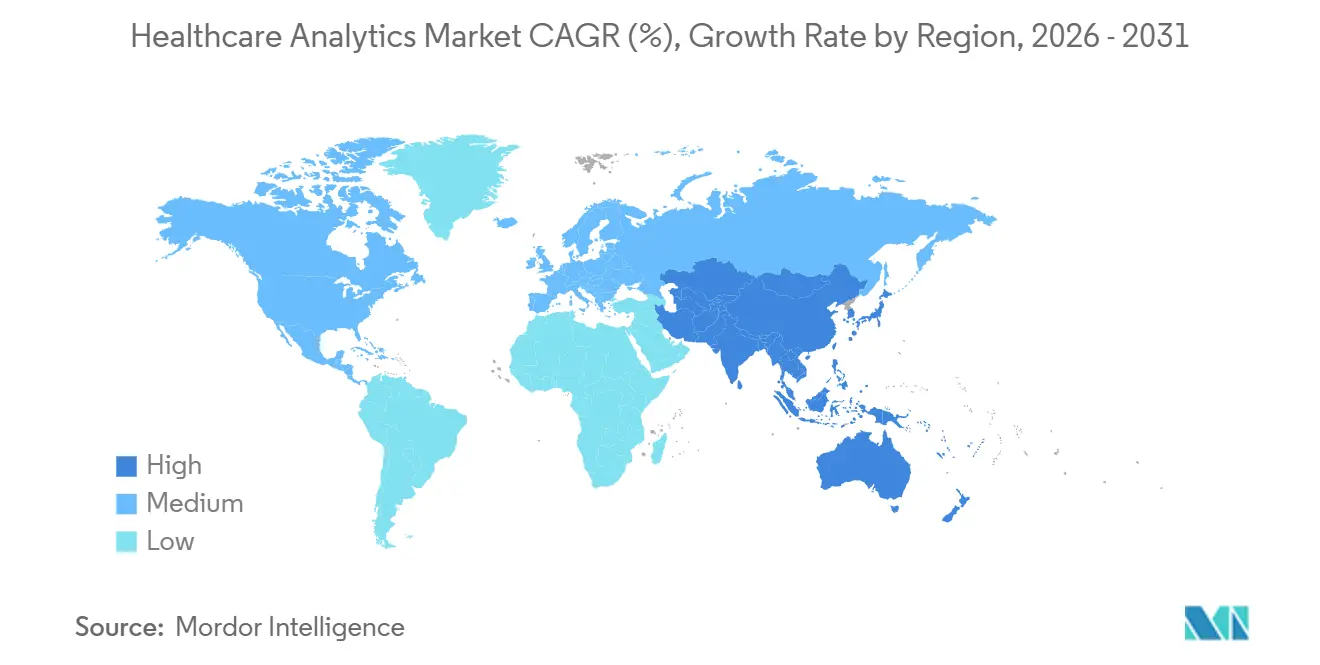
| Fastest Growing Market | Asia Pacific |
| Largest Market | North America |
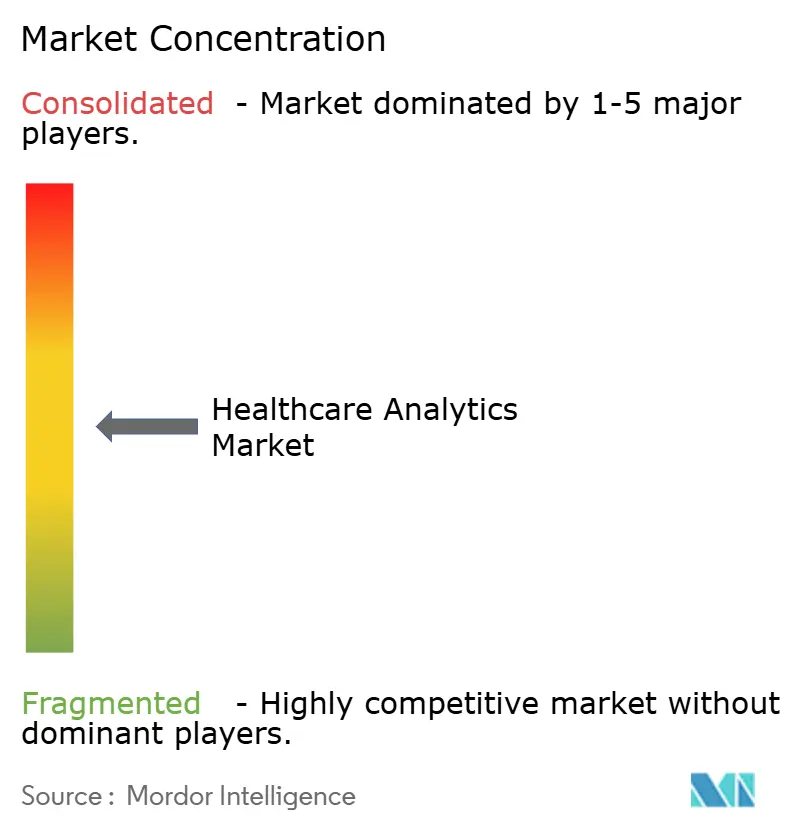
| Market Concentration | Medium |
Major Players *Disclaimer: Major Players sorted in no particular order Image © Mordor Intelligence. Reuse requires attribution under CC BY 4.0. | |
Healthcare Analytics Market Analysis by Mordor Intelligence
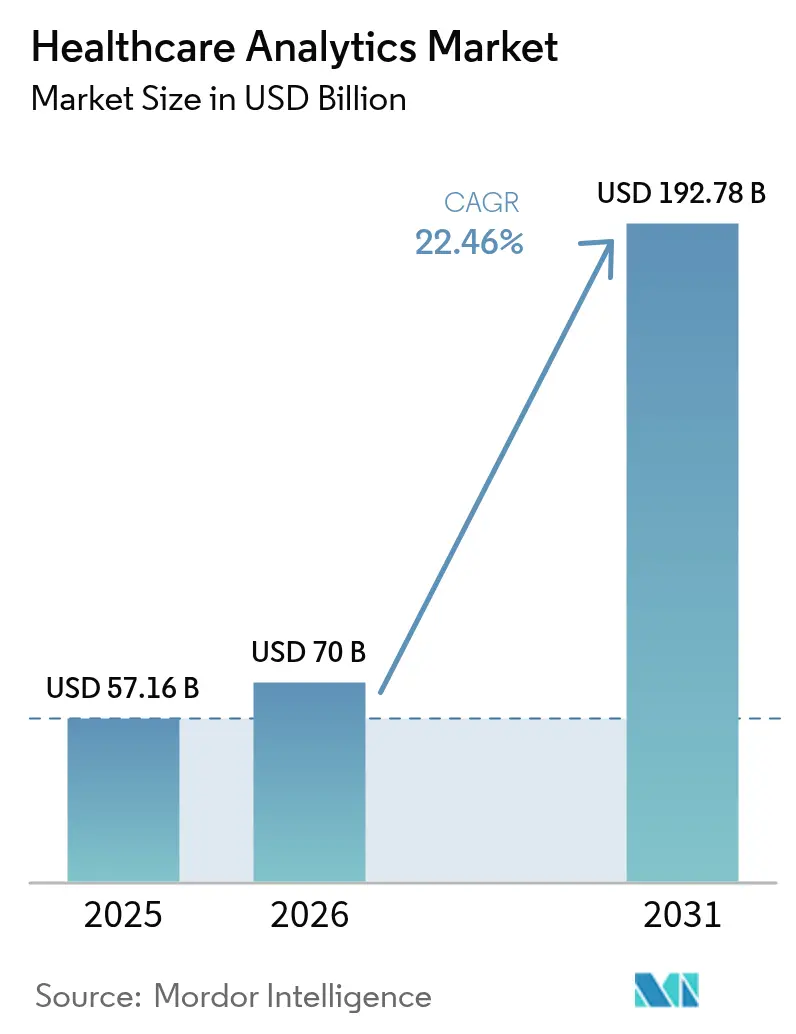
The Healthcare Analytics Market size is expected to increase from USD 57.16 billion in 2025 to USD 70 billion in 2026 and reach USD 192.78 billion by 2031, growing at a CAGR of 22.46% over 2026-2031.
Driven by the increasing adoption of outcome-based contracts, hospitals and insurers are integrating near-real-time dashboards across care pathways. The scalability of cloud solutions and advancements in artificial intelligence are significantly reducing the time required to transform raw data into actionable insights. In North America, reimbursement reforms, declining genomic sequencing costs, and rising imaging volumes are driving the growth of data sets. This trend is prompting Chief Information Officers (CIOs) to shift from legacy data warehouses to scalable architectures and implement privacy-preserving analytics. Vendors are differentiating themselves by offering specialized solutions, such as oncology real-world evidence and fraud detection, alongside tools that optimize clinical documentation and minimize physician charting time. However, the increasing frequency of ransomware attacks and the high cost of recruiting skilled data-engineering talent are slowing deployment rates. As a result, there is growing demand for managed services and automated machine-learning pipelines.
Key Report Takeaways
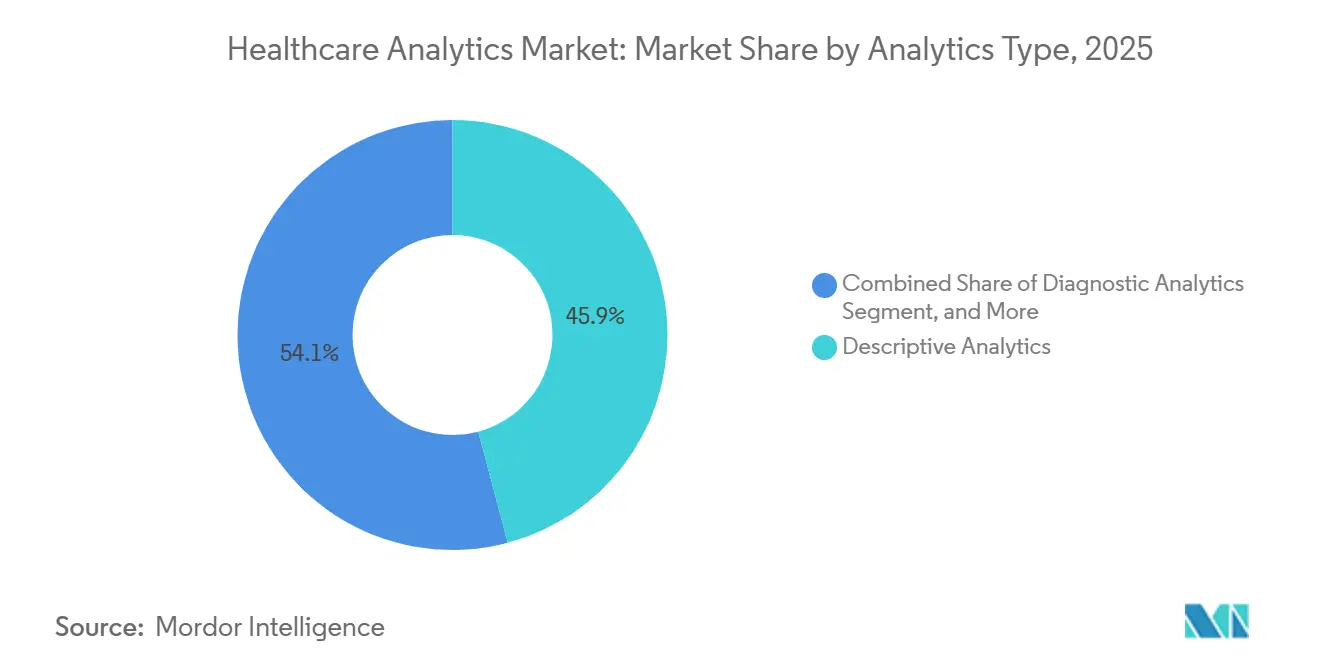
- By analytics type, descriptive analytics led with 45.87% of healthcare analytics market share in 2025, whereas predictive analytics is on track to register a 24.65% CAGR through 2031.
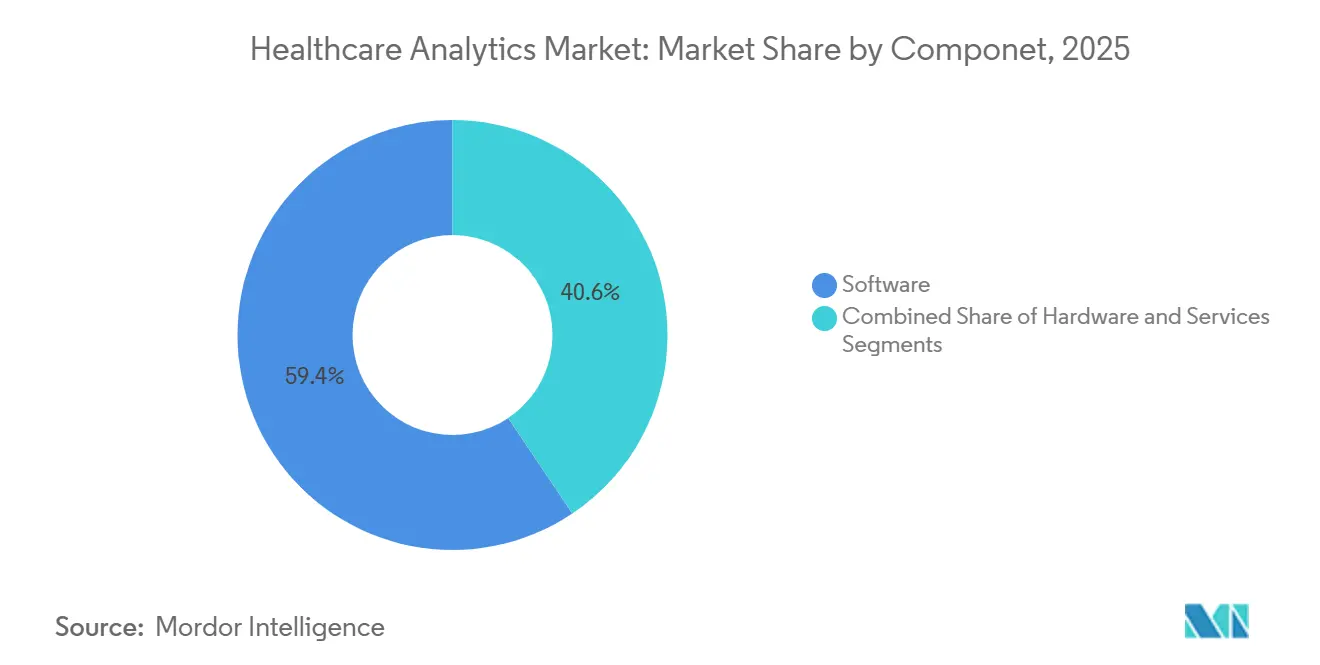
- By component, software captured 59.40% of the healthcare analytics market size in 2025, while services are the fastest-growing piece at a 24.89%.
- By delivery mode, on-premises deployments accounted for 47.54% of revenue in 2025, yet cloud-based models are expanding at a 24.32% CAGR.
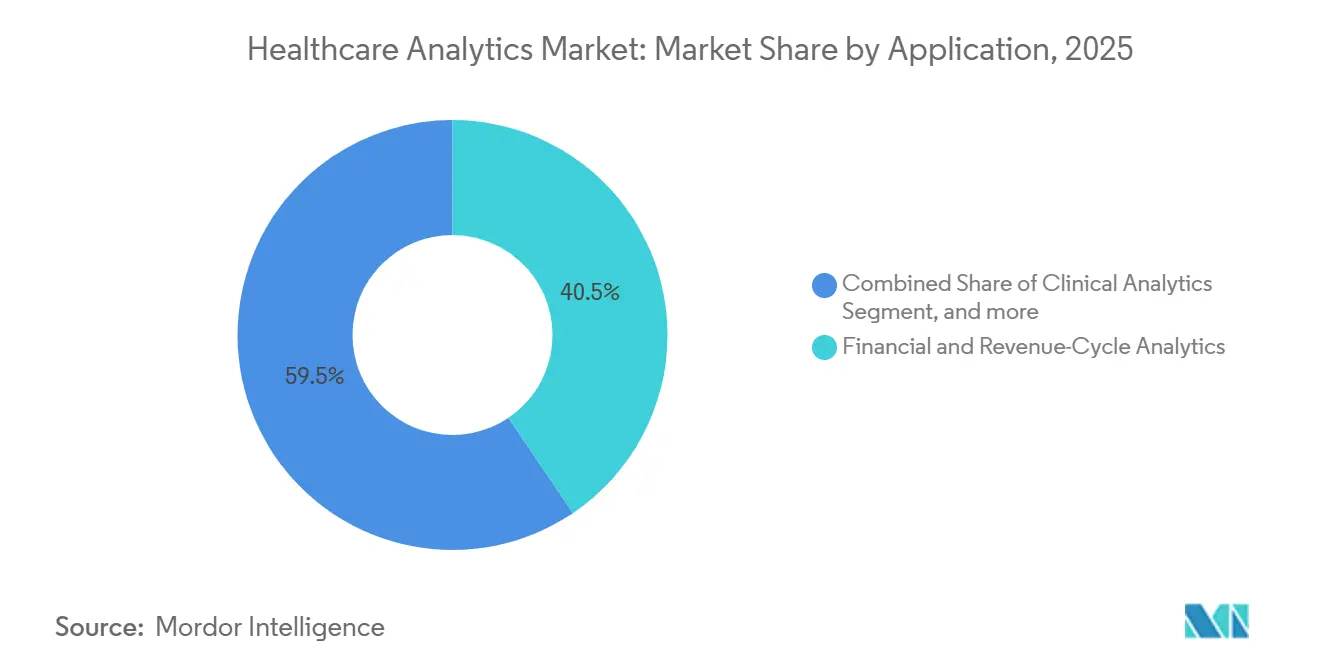
- By application, financial and revenue-cycle analytics accounted for 40.54% share of the healthcare analytics market size in 2025, but population-health management is advancing at a 25.64% CAGR.
- By end user, life-science companies accounted for 44.65% of the market in 2025, whereas healthcare providers are forecast to grow the fastest at a 25.76% CAGR.
- By geography, North America dominated with 43.76% regional share in 2025, and Asia-Pacific is projected to record a 23.65% CAGR through 2031.
Note: Market size and forecast figures in this report are generated using Mordor Intelligence’s proprietary estimation framework, updated with the latest available data and insights as of 2026.
Global Healthcare Analytics Market Trends and Insights
Drivers Impact Analysis*
| Driver | (~) % Impact on CAGR Forecast | Geographic Relevance | Impact Timeline |
|---|---|---|---|
| Regulatory Shift Toward Value-Based Care | +5.2% | North America, Europe | Medium term (2-4 years) |
| Explosive Growth of Health Data Volume | +4.8% | Global | Long term (≥4 years) |
| Cost Containment and Revenue-Cycle Optimization Pressures | +3.5% | Global | Short term (≤2 years) |
| Cloud and Artificial Intelligence Maturity in Healthcare | +4.3% | North America, Europe, APAC | Short term (≤2 years) |
| Hyper-Personalization Through Real-World Evidence & Genomic Data | +3.7% | North America, Europe, APAC | Medium term (2-4 years) |
| Venture Capital Influx into Healthcare Data Platforms | +2.9% | North America, Europe | Short term (≤2 years) |
| Source: Mordor Intelligence | |||
Regulatory Shift Toward Value-Based Care
The Centers for Medicare & Medicaid Services expanded its Merit-based Incentive Payment System in 2025, imposing up to 9% revenue penalties on poor performers, which accelerates the adoption of analytics platforms that auto-populate registries and surface gaps before reconciliation. Commercial insurers such as UnitedHealthcare added bundled-payment models for joint replacement, intensifying demand for pre-operative risk scores that guide interventions. Hospitals responding to revenue volatility have instrumented surgical pathways with dashboards that display length-of-stay and readmission variances relative to peers. Accountable-care organizations achieving shared savings in 2025 reinvested in population-health analytics to classify beneficiaries by chronic-disease burden and deploy nurse navigators to top-spend cohorts. However, rural hospitals lag because tight margins limit data-warehouse investments, widening the performance gap with academic centers.
Explosive Growth of Health Data Volume
Electronic health record systems produced 2,314 exabytes of clinical data in 2025, a 34% jump driven by remote-monitoring wearables that stream vitals every 15 minutes[1]Institute of Electrical and Electronics Engineers, “Wearable Sensor Data Growth 2025,” ieee.org. U.S. radiology departments generated 1.2 billion imaging studies, each CT scan holding up to 500 slices that require petabyte-scale archives. Rapidly falling sequencing costs, now below USD 600 per whole genome, brought comprehensive tumor profiling into routine oncology workflows. Natural-language-processing pipelines convert free-text notes into structured phenotypes, feeding sepsis and infection-risk models that outperform earlier rule-based alerts. These trends overwhelm traditional relational databases and drive migration to columnar stores and cloud data lakes that decouple compute from storage.
Cloud and Artificial Intelligence Maturity in Healthcare
The U.S. Food and Drug Administration cleared 171 AI-enabled medical devices in 2025, validating software-as-a-medical-device pathways. Hospital cloud adoption rose to 68% in 2025 as CIOs offloaded backup and testing environments to hyperscalers, promising 99.99% uptime. Vendors such as Microsoft and Google now offer FHIR-native APIs with built-in de-identification, trimming integration from months to weeks. Large language models trained on clinical corpora achieve 92% coding accuracy, reducing billing lags from days to hours. Hybrid architectures that keep identifiers on premises while pushing de-identified data to the cloud satisfy privacy officers while providing elastic GPU clusters for deep learning workloads.
Hyper-Personalization Through Real-World Evidence & Genomic Data
The FDA approved 14 oncology indications in 2025 based on real-world evidence from electronic health records, bypassing full randomized trials for rare tumors. Pharmaceutical sponsors partner with Flatiron Health and Datavant to observe longitudinal treatment sequences and demonstrate comparative effectiveness in metastatic cancers. National sequencing drives in the United Kingdom and Singapore each banked 100,000 genomes, cataloging variants tied to drug response. Decision-support systems now embed polygenic risk into cardiovascular screenings, tailoring statin thresholds for high-risk profiles. Platforms combining clinical, genomic, and social-determinant data identify patients at risk of medication non-adherence, enabling proactive wraparound services that curb costly emergency care.
Restraints Impact Analysis*
| Restraint | (~) % Impact on CAGR Forecast | Geographic Relevance | Impact Timeline |
|---|---|---|---|
| Data Privacy and Cybersecurity Concerns | −2.8% | Global, acute in North America & Europe | Short term (≤2 years) |
| Interoperability and Legacy System Constraints | −2.1% | Global, pronounced in emerging markets | Medium term (2-4 years) |
| High Total Cost of Ownership for Enterprise Analytics | −1.7% | Global | Medium term (2-4 years) |
| Talent Gap in Advanced Analytics and Data Engineering | −1.4% | Global | Short term (≤2 years) |
| Source: Mordor Intelligence | |||
Data Privacy and Cybersecurity Concerns
Healthcare entities reported 725 large breaches to the U.S. Office for Civil Rights in 2025, up 19% from 2024, with ransomware responsible for two-thirds of incidents[2]U.S. Department of Health and Human Services, “Breach Portal Annual Report 2025,” hhs.gov. The average remediation cost hit USD 10.9 million, deterring small systems from centralizing data in public clouds. European regulators issued EUR 1.2 billion in GDPR fines to healthcare operators during 2025, elevating compliance overhead[3]. Although zero-trust frameworks gain mindshare, retrofitting legacy EHRs takes 18-24 months and strains IT budgets. Federated-learning prototypes offer privacy-preserving alternatives, but uneven model convergence and sparse vendor tooling keep adoption experimental.
Interoperability and Legacy System Constraints
Despite the U.S. Cures Act deadline, only 42% of hospitals exposed FHIR endpoints by end-2025, forcing manual data reconciliation at transitions of care. Seventy-three percent of hospital interfaces still run on 1990s HL7 v2 messages that break during vendor updates and lack semantic alignment with SNOMED CT or LOINC. Overnight ETL jobs on monolithic databases inject 12- to 24-hour latency, undermining real-time sepsis surveillance. For a 500-bed facility, total data-warehouse ownership exceeded USD 5 million a year in 2025, covering licenses and staffing. Open-source engines like Mirth reduced pilot integration costs by up to 40%, but widespread rollout awaits payer incentives that penalize information blocking.
*Our forecasts treat driver/restraint impacts as directional, not additive. The impact forecasts reflect baseline growth, mix effects, and variable interactions.
Segment Analysis
By Analytics Type: Predictive Models, Eclipse Retrospective Dashboards
Predictive analytics is projected to advance at a 24.65% CAGR from 2026 to 2031, outstripping descriptive analytics, which held 45.87% of the healthcare analytics market share in 2025. Hospitals increasingly favor forward-looking risk scores that anticipate sepsis or falls within 48 hours, allowing proactive rounding and timely intervention. Diagnostic analytics, which traces root causes behind infection clusters, bridges retrospective reporting to predictive workflows and guides quality-improvement teams in hypothesis testing. Prescriptive algorithms, although still single-digit today, optimize multi-modal oncology regimens and insulin titration schedules, reducing adverse events and length of stay.
The pivot toward predictive aligns with payer demands for prospective risk adjustment, shifting capitation to reflect true patient acuity. Machine-learning models trained on five-year claims archives now score above 0.85 AUC for 30-day readmission, surpassing crude LACE indices. Early prescriptive pilots cut inpatient hypoglycemia by 22% in randomized trials, highlighting how algorithms can prescribe dosing regimens in near real time. Cognitive platforms that use large-language models to draft discharge letters reclaim hours of clinician time and fuel broader adoption of analytics across non-technical user bases.


By Component: Services Surge as Implementation Complexity Mounts
Services revenue is forecast to grow at a 24.89% CAGR, shrinking the gap with software’s 59.40% segment share in 2025. Consulting projects that map workflows and configure role-based dashboards absorbed 35% of 2025 services spending, underscoring bespoke needs where a sepsis model validated in one ICU requires tuning for another with a different acuity mix. Managed offerings that oversee data-pipeline uptime, model drift, and regulatory reporting rose 28% year over year, appealing to community hospitals short on data engineers. Meanwhile, hardware outlays declined as cloud migration displaced on-premise refresh cycles.
Software-as-a-service bundles pack licenses, hosting, and upgrades into predictable per-provider fees, lowering entry barriers for small practices. Implementation of FHIR APIs commands premium bill rates, with integrators charging USD 200-300 an hour for certified specialists. Training that helps nurses interpret risk scores boosted adoption 40% compared with technology-only rollouts, illustrating the value of change-management investments. Continuous optimization keeps algorithms relevant as patient mix shifts, protecting healthcare analytics market share from model drift.
By Delivery Mode: Hybrid Architectures Balance Control and Elasticity
Cloud-based deployments are set to expand at a 24.32% CAGR, eating into the 47.54% on-premise revenue share logged in 2025. CIOs favor operating expense models that flex capacity during influenza peaks or pandemic surges, freeing budgets that were once tied up in hardware. Hybrid setups—identifiers stay on-site while de-identified cohorts train models in the cloud—became mainstream in 2025 because they square privacy concerns with the speed of hyperscale GPUs. Data-residency laws in Germany and Switzerland continue to anchor some archives inside national borders.
Cloud providers deepened healthcare compliance in 2025 by adding HITRUST CSF and explicit HIPAA mappings, reducing due diligence workloads for covered entities. Multi-cloud designs mitigate vendor lock-in but add complexity in identity federation and cost management. Edge gateways that pre-aggregate wearable streams trimmed network bandwidth by 60% in rural tele-monitoring pilots, highlighting the usefulness of localized compute. Stepwise modernization that runs latency-sensitive bedside alerts on-premises and pushes batch-quality reporting to the cloud lets health systems migrate without disruptive forklift upgrades.
By Application: Population Health Gains as Payment Models Reward Prevention
Population-health management is pacing a 25.64% CAGR, challenging financial and revenue-cycle analytics’ 40.54% segment share from 2025. Accountable-care organizations rely on these platforms to segment members by chronic burden, predict “rising-risk” status, and intervene before costly admissions. Operational analytics that streamline emergency-department throughput and inventory levels showed median 18% ROI in 2025, helping administrators cope with staffing shortages. Fraud analytics saved commercial payers USD 12 billion in improper claims by flagging outliers against peer patterns.
Population-health engines pull social-determinant indicators such as housing or food access from community-worker apps, feeding predictive models that flag non-adherence risk before clinical decline. Financial analytics that pre-score denial likelihood shaved 8-12% off accounts-receivable days, accelerating cash flow. Point-of-care order-set suggestions boosted adherence to pneumonia protocols by 15 percentage points versus passive education. Government payers recaptured USD 3.2 billion through claims-integrity analytics, underscoring regulatory appetite for advanced detection.
By End User: Providers Accelerate as Integrated Networks Consolidate
Healthcare providers are projected to post a 25.76% CAGR, steadily narrowing the gap with life-science players’ 44.65% share in 2025. System mergers create scale economies that justify enterprise data-warehouse investments stitching together disparate EHRs, claims, and patient-reported outcomes across regions. Payers focus analytics on fraud detection and member retention, but growth moderates as core adjudication engines mature. Public-health agencies leverage open-source dashboards for outbreak surveillance, though budgets keep their slice in low single digits.
Ambulatory groups joining clinically integrated networks gained shared analytics access in 2025, enabling smaller practices to participate in value-based arrangements. Payers using churn-prediction models cut voluntary disenrollment 12-15% during open enrollment, preserving premium income. Life-science sponsors embedded trial-matching alerts inside EHRs, speeding recruitment and improving cohort diversity. Integrated delivery networks benchmark sites against system averages to spotlight best practices and negotiate better vendor discounts, reinforcing analytics adoption loops.
Geography Analysis
North America commanded 43.76% of healthcare analytics market share in 2025, propelled by the Quality Payment Program that ties reimbursement to electronic quality reporting and by FDA clearance of 171 AI-enabled devices that validated clinical utility. Canada’s CAD 400 million pan-Canadian data-trust strategy federated provincial EHRs for privacy-preserving research, while Mexico rolled out dashboards across 1,500 primary-care clinics to rank diabetic and hypertensive patients by complication risk. Rising ransomware exposure in U.S. hospitals also catalyzed investments in zero-trust analytics infrastructure.
Asia-Pacific is projected to deliver a 23.65% CAGR through 2031 as China’s Healthy China 2030 program mandates interoperable records and decision support for antibiotic stewardship. India issued 450 million digital health IDs that knit vaccination, lab, and prescription histories into longitudinal registries, enabling cross-facility analytics. Japan earmarked JPY 120 billion to subsidize EHR upgrades in small clinics, aiming to curb polypharmacy through automated drug-interaction alerts. Australia’s national record accrued 24 million users despite ongoing privacy debates, while South Korea anonymized claims for large-scale epidemiology studies.
Europe’s strict GDPR regime levied EUR 1.2 billion in fines on healthcare entities during 2025, fueling demand for homomorphic encryption and secure multi-party computation. Germany’s Digital Healthcare Act compels insurers to reimburse listed digital therapeutics, sparking mobile chronic-disease apps that pipe patient-reported outcomes into analytics engines. The United Kingdom placed GBP 600 million behind federated data platforms across integrated-care systems, offsetting centralization concerns by keeping identifiers local. Gulf Cooperation Council states invested USD 2.3 billion in health information exchanges, yet rural connectivity gaps slow full deployment. Brazil’s national data network stalled amid fiscal headwinds, underlining funding’s role in analytics roll-out.

Competitive Landscape
The healthcare analytics market remains moderately fragmented, with established EHR giants leveraging embedded modules and pure-play vendors carving niches in oncology evidence or fraud detection. Epic’s Cogito suite, bundled with its core EHR, captured 18% of hospital accounts in 2025 by offering turnkey sepsis and readmission dashboards that require little configuration. Optum wields combined claims and clinical data from 150 million lives, enabling longitudinal insights rival vendors struggle to copy. Oracle Health’s absorption of Cerner added a large inpatient footprint to its cloud portfolio, positioning the firm as a full-stack alternative to Epic.
White-space opportunities center on social-determinant analytics that incorporate eviction filings, utility shut-off notices, and unemployment claims to flag destabilizing life events before they spiral into costly clinical episodes. Agile contenders such as Health Catalyst and Arcadia offer cloud-native modules compatible with multiple EHRs, attracting systems wary of vendor lock-in. FHIR mandates under the Cures Act lower switching costs by letting third-party apps retrieve patient data without bespoke interfaces, intensifying rivalry. Meanwhile, surging cyberattacks underscore demand for immutable audit logs and zero-trust architectures, areas where security-first analytics vendors differentiate.
Incumbents expand through acquisitions and AI partnerships. Microsoft’s tie-up with Epic embeds large-language models into documentation workflows, reclaiming clinician time and producing structured data that loops back into analytics. UnitedHealth’s Change Healthcare arm piloted blockchain-based adjudication, cutting payment cycles from 14 to 3 days, highlighting the convergence of fintech and health data. IBM’s divestiture of Watson Health into Merative injects private equity capital into imaging and drug-reference analytics, suggesting renewed focus on domain-specific AI.
Healthcare Analytics Industry Leaders
Optum Inc.
Oracle Health
IBM Corporation
McKesson Corporation
IQVIA Holdings Inc.
- *Disclaimer: Major Players sorted in no particular order

Recent Industry Developments
- January 2026: OpenAI announced the launch of OpenAI for Healthcare, a dedicated initiative aimed at supporting clinicians, healthcare organisations, and MedTech companies with HIPAA-compliant artificial intelligence tools.
- July 2025: Nordic Capital acquired healthcare analytics company Arcadia Solutions to leverage the potential of artificial intelligence to improve healthcare and save money.
- June 2025: Oliver Wyman, a management consulting firm and part of Marsh McLennan acquired Validate Health, a healthcare analytics company that supports healthcare providers and Accountable Care Organisations (ACOs) in improving cost management, risk assessment, and operational performance.


Research Methodology Framework and Report Scope
Market Definitions and Key Coverage
Mordor Intelligence defines the healthcare analytics market as every software, service, and enabling hardware platform that collects, integrates, and applies descriptive, diagnostic, predictive, prescriptive, or cognitive techniques to clinical, financial, operational, population health, and life science data generated by providers, payers, and public agencies worldwide.
Scope Exclusions: Stand-alone electronic health record systems, revenue cycle outsourcing contracts, non-analytics business intelligence tools, and AI point solutions limited to radiology are not counted.
Segmentation Overview
- By Analytics Type
- Descriptive Analytics
- Diagnostic Analytics
- Predictive Analytics
- Prescriptive Analytics
- Cognitive / Augmented Analytics
- By Component
- Hardware
- Software
- Services
- By Delivery Mode
- On-Premise
- Cloud-Based
- Hybrid
- By Application
- Clinical Analytics
- Financial & Revenue-Cycle Analytics
- Operational & Administrative Analytics
- Population-Health Management
- Fraud Detection & Risk Analytics
- Life-Sciences / R&D Analytics
- By End User
- Healthcare Providers
- Healthcare Payers
- Life-Science Companies
- Public Health Agencies
- Geography
- North America
- United States
- Canada
- Mexico
- Europe
- Germany
- United Kingdom
- France
- Italy
- Spain
- Rest of Europe
- Asia-Pacific
- China
- Japan
- India
- Australia
- South Korea
- Rest of Asia-Pacific
- Middle East & Africa
- GCC
- South Africa
- Rest of Middle East & Africa
- South America
- Brazil
- Argentina
- Rest of South America
- North America
Detailed Research Methodology and Data Validation
Primary Research
Mordor analysts interview health system CIOs, payer informatics heads, analytics vendors, and regional policy advisers across North America, Europe, Asia Pacific, and the Gulf. These calls and structured surveys validate pricing corridors, refresh rate assumptions, and penetration benchmarks that desktop sources leave unclear.
Desk Research
Our junior team compiles foundational inputs from tier 1, open sources such as the US CMS National Health Expenditure tables, Eurostat health accounts, WHO Global Health Observatory, and OECD Health Statistics. Trade bodies like AHIP, Advanced Medical Technology Association, and the Healthcare Information and Management Systems Society help us profile installed IT bases and adoption ratios. Company 10-Ks, FDA device approvals, venture funding trackers, and patent datasets from Questel enrich technology diffusion estimates. We supplement gaps with shipment intelligence from Volza and news archives accessed through Dow Jones Factiva. These references illustrate but do not exhaust the wide array of secondary materials reviewed.
Market-Sizing & Forecasting
A blended top down view of healthcare spending pools and data generation volumes is rebuilt, which is then calibrated with sampled bottom up checks on provider deployments, license ASP × active seats, and managed service revenues. Key variables include inpatient discharge counts, average claim records per insured life, migration rates from on premise to cloud, AI enabled workload share, and regulatory incentive milestones such as Meaningful Use and GDPR. Multivariate regression, guided by expert consensus, forecasts each driver through 2030, while scenario analysis quantifies upside from additional value based care mandates. Where bottom up audits reveal material divergence, estimates are adjusted to the mid range of verified ranges.
Data Validation & Update Cycle
Model outputs pass three rounds of analyst peer review, variance checks against external health IT indices, and reconciliation with latest currency fixes. We refresh every twelve months, and interim updates trigger after major policy shifts, mega acquisitions, or reimbursement code changes.
Why Mordor's Healthcare Analytics Baseline Commands Reliability
Published figures differ because firms choose unique scopes, cost buckets, and refresh cadences.
Pricing of bundled services, inclusion of life science analytics, and assumed cloud ramp rates are frequent gap drivers.
Benchmark comparison
| Market Size | Anonymized source | Primary gap driver |
|---|---|---|
| USD 57.16 B (2025) | Mordor Intelligence | - |
| USD 65.64 B (2025) | Global Consultancy A | Excludes enabling hardware yet counts EMR data warehousing spend, lifting totals |
| USD 44.83 B (2024) | Industry Association B | Uses payer centric scope, omits life science and public health agency demand |
Differences arise mainly from service bundle treatment, base year currency choices, and shorter historical baselines.
Mordor's balanced top down and selective bottom up approach, allied to annual refreshes and transparent variable lists, offers decision makers a dependable, traceable benchmark.


Key Questions Answered in the Report
What is the current healthcare analytics market size and growth outlook?
The market stood at USD 70.00 billion in 2026 and is projected to reach USD 192.78 billion by 2031, reflecting a 22.46% CAGR.
Which analytics type is expanding the fastest?
Predictive analytics is growing at 24.65% CAGR, gaining on descriptive dashboards that still lead share.
Why are services growing faster than software licenses?
Hospitals realize that successful deployments need integration, training, and model-maintenance services, fueling a 24.89% CAGR for the services segment.
How quickly are cloud deployments displacing on-premise models?
Cloud-based architectures are advancing at 24.32% CAGR as health systems seek elastic scaling and lower capital outlays.
Which region will add the most new revenue?
Asia-Pacific is forecast to post a 23.65% CAGR through 2031 thanks to nationwide EHR mandates and large-scale health-ID programs in China and India.
Who are the leading vendors in hospital analytics?
Epic, Optum, and Oracle Health hold the largest footprints, with Epic's Cogito suite alone in 18% of U.S. hospitals.
Page last updated on:


