
Extended Reality (XR) Market Size and Share
Market Overview
| Study Period | 2020 - 2031 |
|---|---|
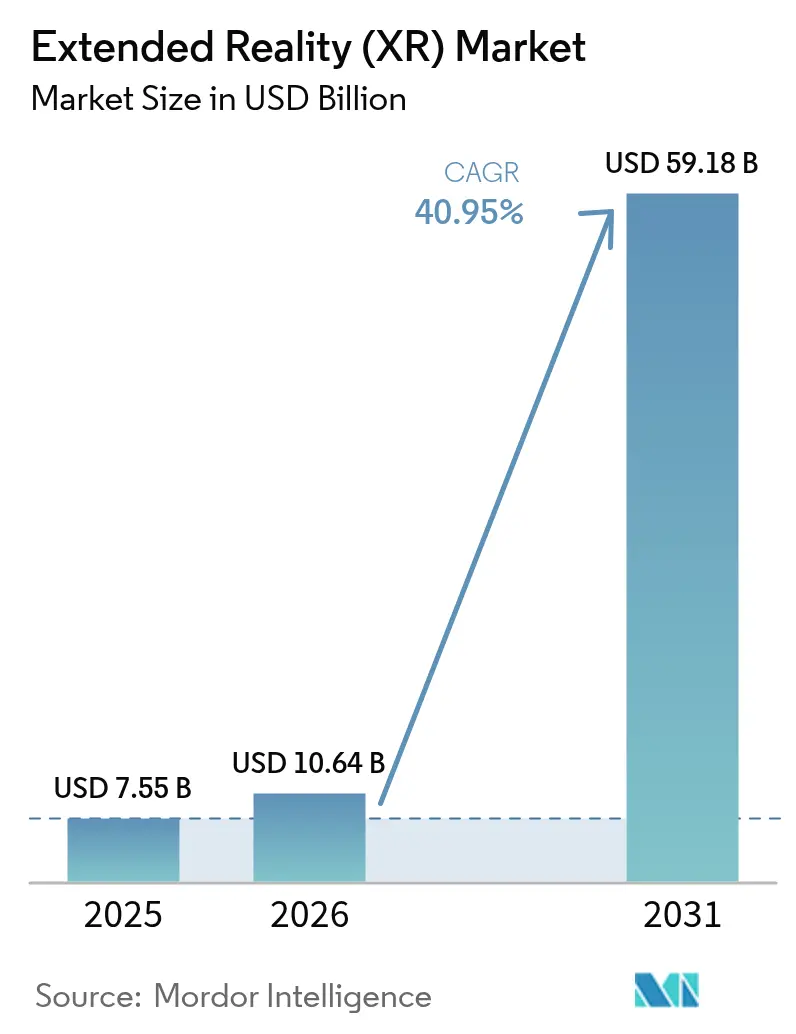
| Market Size (2026) | USD 10.64 Billion |
| Market Size (2031) | USD 59.18 Billion |
| Growth Rate (2026 - 2031) | 40.95 % |
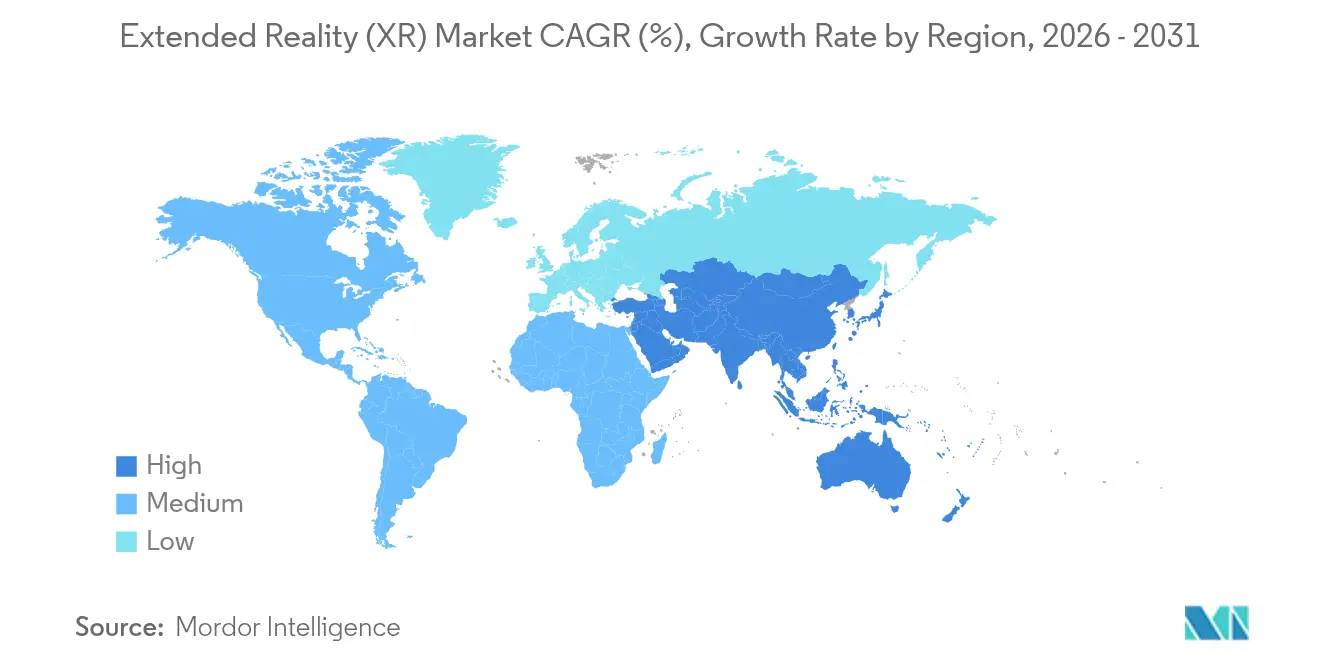
| Fastest Growing Market | Asia Pacific |
| Largest Market | North America |
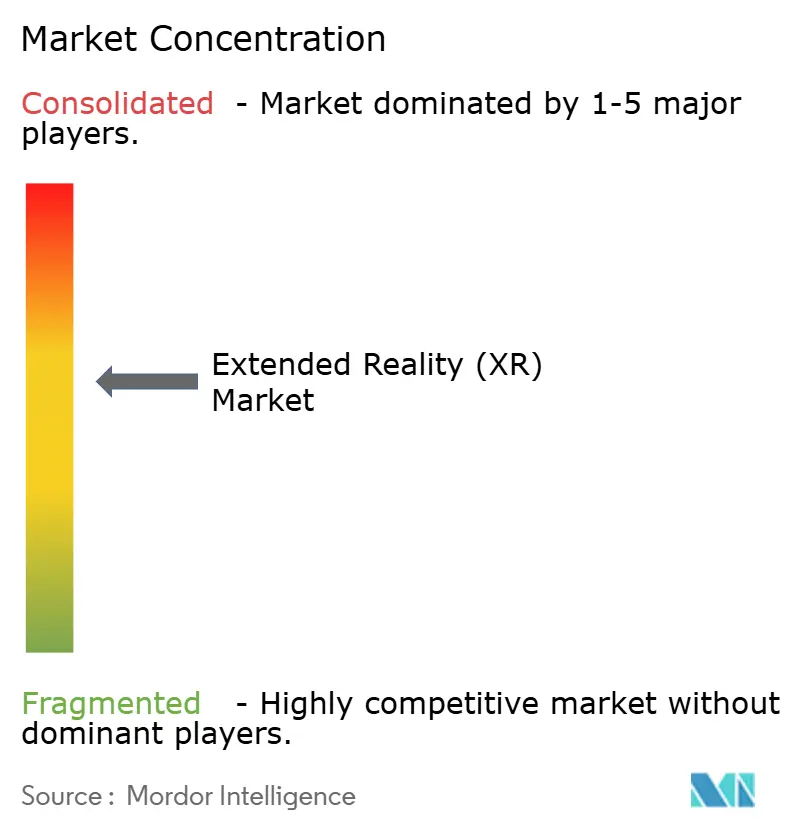
| Market Concentration | Medium |
Major Players *Disclaimer: Major Players sorted in no particular order Image © Mordor Intelligence. Reuse requires attribution under CC BY 4.0. | |
Extended Reality (XR) Market Analysis by Mordor Intelligence
Extended Reality market size in 2026 is estimated at USD 10.64 billion, growing from 2025 value of USD 7.55 billion with 2031 projections showing USD 59.18 billion, growing at 40.95% CAGR over 2026-2031. Rapid enterprise adoption across manufacturing, healthcare, and defense now outpaces consumer entertainment, turning XR from a gaming novelty into a mission-critical productivity tool. Five-generation mobile networks paired with edge computing have erased latency barriers, making millisecond-accurate visualization practical on factory floors and in surgical suites. Artificial intelligence embedded in spatial computing personalizes training content while real-time analytics close feedback loops, further raising measurable returns. Government funding in the United States and China, coupled with open standards such as OpenXR, is accelerating ecosystem maturity and reducing vendor lock-in worries. Supply chain constraints and component price inflation remain headwinds but continue to ease as new semiconductor capacity and alternative material sourcing enter production.
Key Report Takeaways
- By offering, Hardware led with 52.38% revenue share in 2025; Services is forecast to advance at a 41.35% CAGR through 2031.
- By device type, Head-Mounted Displays held 41.95% of Extended Reality market share in 2025 while Spatial and Holographic Displays are set to grow at 42.20% CAGR to 2031.
- By technology, Augmented Reality commanded 42.55% share of the Extended Reality market size in 2025 and is expanding at 41.65% CAGR to 2031.
- By end user, Gaming and Entertainment retained 38.30% share in 2025; Healthcare and Life Sciences is progressing at a 41.10% CAGR through 2031.
- By geography, North America held 36.45% revenue share in 2025, whereas Asia-Pacific posts the fastest regional CAGR at 41.20% through 2031.
Note: Market size and forecast figures in this report are generated using Mordor Intelligence’s proprietary estimation framework, updated with the latest available data and insights as of 2026.
Market Trends and Insights
Drivers Impact Analysis of Extended Reality (XR) Market*
| Driver | (~) % Impact on CAGR Forecast | Geographic Relevance | Impact Timeline |
|---|---|---|---|
| Expanding 5G coverage and edge computing synergy | +8.2% | Global, with early gains in South Korea, China, US urban centers | Medium term (2-4 years) |
| Increased integration of XR into digital twin and Industry 4.0 frameworks | +6.8% | North America and EU, expanding to Asia-Pacific manufacturing hubs | Long term (≥ 4 years) |
| Rising enterprise demand for immersive remote-training | +7.1% | Global, particularly strong in healthcare and aerospace sectors | Short term (≤ 2 years) |
| Mass-market smartphone integration of spatial sensors | +5.4% | Asia-Pacific core, spill-over to North America and Europe | Medium term (2-4 years) |
| Government funding for metaverse-related RandD | +4.9% | China, US, Germany with targeted industry initiatives | Long term (≥ 4 years) |
| Adoption of open XR standards lowering vendor lock-in | +3.8% | Global, with faster adoption in enterprise segments | Short term (≤ 2 years) |
| Source: Mordor Intelligence | |||
Expanding 5G Coverage and Edge Computing Synergy
Sub-20 ms latency now enables multi-user VR collaboration without tethered backpack PCs, as trials by Ericsson, AT&T, Dreamscape, and Qualcomm have shown. China Steel Corporation’s 5G-enabled virtual factory tours integrate live data from 85 production nodes, proving value for heavy industry. [1]China Steel Corporation, “5G Immersive Factory Tour,” csc.com.tw DHL smart-glasses pilots illustrate logistics gains from real-time pick guidance. Device weight drops as compute moves to the network edge, boosting shift-length comfort. Telcos therefore place micro-data-centers within 50 km of users to sustain immersive throughput.
Increased Integration of XR into Digital Twin and Industry 4.0 Frameworks
Pegatron’s PEGAVERSE builds five virtual factories on NVIDIA Omniverse for remote diagnostics and scenario testing, lowering downtime and travel.[2]NVIDIA, “Pegatron Deploys Omniverse for Virtual Factories,” nvidia.com BASF’s AR-enabled plant planning links sensor data with immersive visualization to streamline hazard identification. Siemens and Sony priced the SRH-S1 engineering headset at USD 4,750 to deliver pixel-accurate design collaboration. OpenUSD alignment lets disparate CAD, PLM, and IoT feeds merge into a single spatial layer. Platform vendors thus monetize subscription-based visualization rather than one-off license fees.
Rising Enterprise Demand for Immersive Remote Training
The U.S. Marine Corps installed 81 driver-training simulators that replace live vehicle use, trimming both risk and cost. Endovascular neurosurgery programs employ patient-specific 3D models to enhance procedural outcomes. Howden combines Microsoft HoloLens with PTC Vuforia to upskill field technicians, saving on travel and downtime. Adaptive AI now calibrates lesson complexity in real time, delivering 90% knowledge retention. The main bottleneck is bespoke content creation, spurring demand for service providers fluent in regulatory standards.
Mass-Market Smartphone Integration of Spatial Sensors
Apple’s WebXR support and Google’s Android XR toolkit embed spatial computing directly into mobile operating systems. XREAL’s USD 199 Beam Pro couples AR glasses with Google Play apps, with 400,000 units sold since 2017. IKEA’s smartphone AR furniture placement reduces returns and lifts purchase confidence. Cloud AI delivers instant object recognition, enabling location-based marketing while heightening GDPR scrutiny over biometric capture.
Restraints Impact Analysis of Extended Reality (XR) Market*
| Restraint | (~) % Impact on CAGR Forecast | Geographic Relevance | Impact Timeline |
|---|---|---|---|
| High upfront costs of high-fidelity optics and processors | -4.2% | Global, particularly affecting SME adoption rates | Medium term (2-4 years) |
| User motion-sickness and ergonomic limitations | -3.1% | Global, with higher impact in consumer applications | Short term (≤ 2 years) |
| Data-privacy gaps in eye- and hand-tracking analytics | -2.8% | EU and California leading regulatory scrutiny | Long term (≥ 4 years) |
| Fragmented content-authoring tool ecosystem | -2.4% | Global, affecting enterprise deployment scalability | Medium term (2-4 years) |
| Source: Mordor Intelligence | |||
High Upfront Costs of High-Fidelity Optics and Processors
Gallium and germanium shortages have inflated optics prices by up to 25%. Meta’s Reality Labs has accumulated USD 60 billion losses since 2020 while selling USD 1.1 billion in Q4 2024 XR hardware, underscoring profitability challenges. Smaller firms hesitate without capital or clear ROI. Cloud-rendered XR lightens devices yet introduces latency trade-offs that limit usage to well-served 5G zones.
User Motion-Sickness and Ergonomic Limitations
Up to 40% of users still report discomfort in full-immersion VR sessions. RayNeo’s Air 3s micro-OLED headset cuts weight and attains TÜV-certified eye comfort for all-day wear. [3]ETX View, “RayNeo Air 3s Launch Details,” etxview.com Predictive algorithms fed by biometric signals promise further relief, as Wearable Devices’ neural wristband demonstrates. Mixed-reality pass-through optics meet workplace safety requirements by preserving situational awareness.
*Our forecasts treat driver/restraint impacts as directional, not additive. The impact forecasts reflect baseline growth, mix effects, and variable interactions.
Extended Reality (XR) Market Segment Analysis
By Offering:
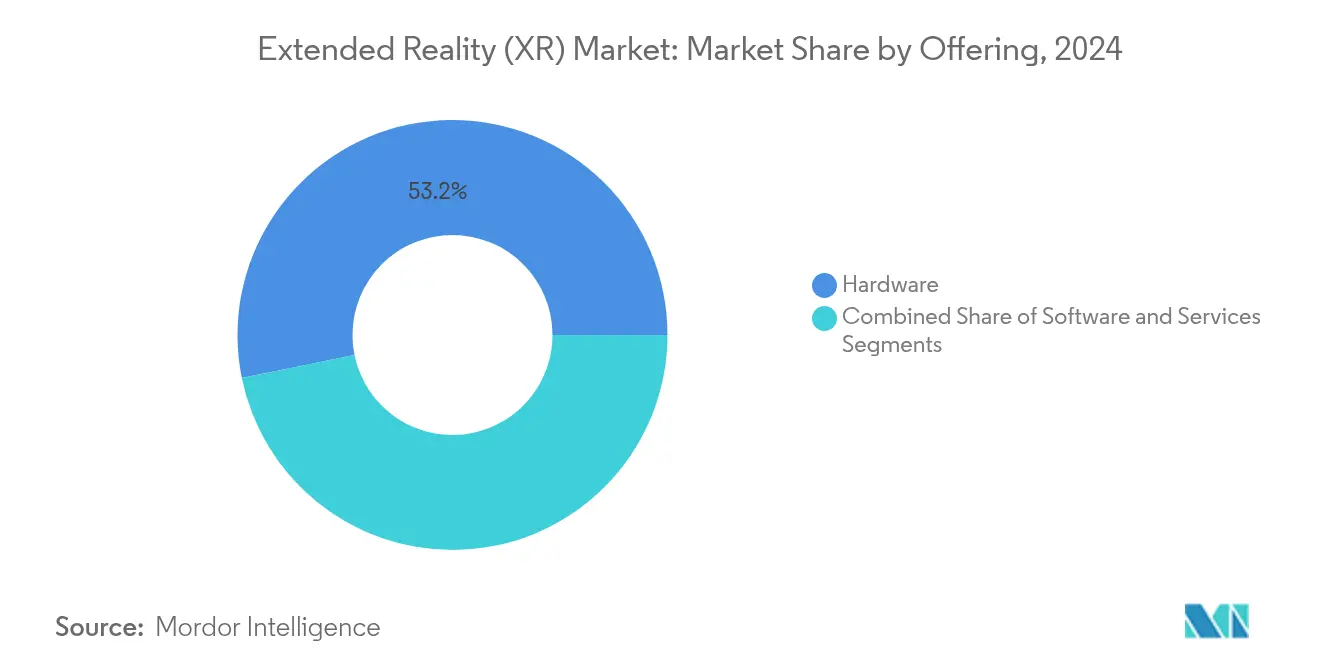
Services Revenue Models Accelerate Enterprise AdoptionHardware controlled 53.2% of revenue in 2024, yet Services is set to grow fastest at 42.5% CAGR. Subscription bundles that combine devices, software, and managed support convert capex into opex, a structure favored by finance departments. The shift drives predictable recurring income for suppliers and lowers barrier-to-entry for customers. Meta’s platform pivot illustrates this movement, exploring enterprise-grade subscriptions alongside hardware refreshes.
Managed training and simulation services command premium rates thanks to specialized content needs. Vertex Solutions alone shipped more than 500 military-grade simulators worldwide, highlighting vertical expertise. As these contracts often span multi-year periods, vendors capture higher lifetime value. Hardware makers therefore partner with integrators rather than compete head-on, reflecting a maturing services-led Extended Reality market.



By Device Type:
Spatial Displays Challenge HMD DominanceHead-Mounted Displays captured 42.7% revenue in 2024 but growth now shifts to Spatial and Holographic Displays, which head toward a 43.1% CAGR. Shared viewing walls overcome hygiene and comfort limits found in personal headsets, supporting collaborative engineering reviews and customer demonstrations. Samsung’s Project Moohan exemplifies next-generation standalone units optimized for industrial deployment.
Glasses-free solutions also emerge, with Distance Technologies raising EUR 10 million (USD 11.73 million) to transform vehicle windows into dynamic mixed-reality canvases. Smartphone-tethered handheld devices remain common in field maintenance, while head-up displays secure niche positions in aviation and automotive cockpits. Longer term, smart contact lenses such as XPANCEO’s prototype could push the Extended Reality market into invisible wearables.
By Technology:
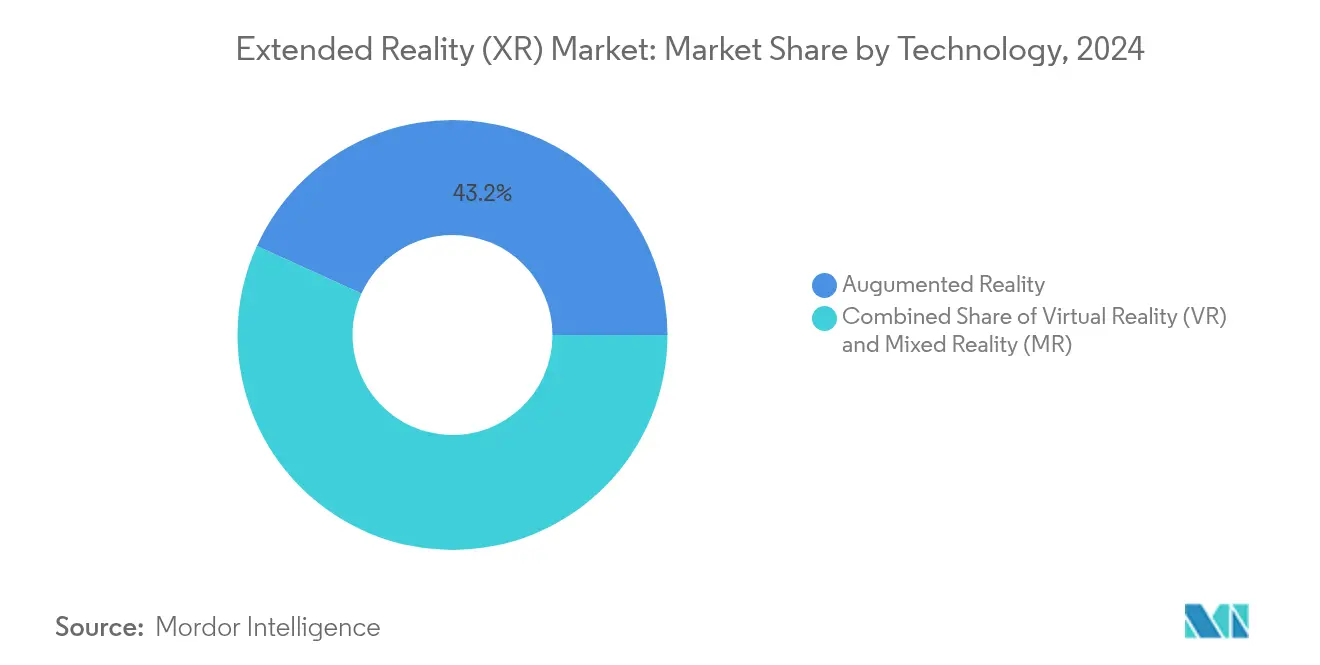
AR Convergence Drives Cross-Platform IntegrationAugmented Reality led with 43.2% share in 2024 and is forecast for 42.7% CAGR, reflecting its blend of digital overlays with uninterrupted real-world visibility. Virtual Reality now concentrates on high-fidelity training and design reviews, illustrated by Alaska Airlines adopting full-motion 737 simulators. Mixed Reality occupies the middle ground, dynamically switching between immersive and see-through modes.
OpenXR standardization, now supported by 13 major vendors, allows one code base to target multiple devices, slimming development costs. New Spatial Entities Extensions further streamline plane detection and anchors for enterprise apps. Qualcomm’s on-glass generative AI showcases context-aware overlays that anticipate user needs, positioning silicon roadmaps around XR-optimized neural processing.
By End User:
Healthcare Acceleration Surpasses Gaming GrowthGaming and Entertainment retained 38.3% share in 2024; however, Healthcare and Life Sciences is growing at 42.9% CAGR as hospitals quantify shorter procedure times and higher retention in surgeon training. Apple Vision Pro hosts Medical Veyond Metaverse scenarios for patient education and operating-room rehearsal.
Industrial firms deploy digital twins for remote troubleshooting, with Howden reducing engineer travel through mixed-reality guides. Retail innovations such as virtual showrooms quadruple consumer confidence and cut return rates. Defense agencies use immersive simulators to lower live-fire costs while expanding scenario diversity, reinforcing steady demand in the Extended Reality market.
Geography Analysis
North America Extended Reality (XR) Market
North America’s installed base expands through steady healthcare, aerospace, and defense procurement. Infinite Reality closed USD 350 million in new capital and bought Landvault for USD 450 million, underscoring investor optimism in spatial computing platforms. The US Defense Innovation Unit fielded 225 immersive trainers across Air Force sites, further entrenching enterprise XR usage. Regulatory support for alternative certification in aviation spurs equipment orders as simulator fidelity approaches physical cockpit standards.
APAC and Europe Extended Reality (XR) Market
Asia-Pacific scales fastest. China alone launched more than 100 VR projects in 2024. South Korea readies Samsung’s Project Moohan release, leveraging the country’s near-universal 5G coverage. India’s public-private incubator with Meta and HCLTech cultivates grassroots application developers. Wide manufacturing bases feed continuous proof-of-value pilots, making APAC pivotal to hardware volume economics. Europe positions itself as the responsible innovation hub. Distance Technologies’ EUR 10 million (USD 11.73 million) seed illustrates appetite for automotive-grade mixed-reality surfaces. BASF, Siemens, and Sony collaborate on engineering headsets that comply with strict CE safety norms. The EU’s privacy regime shapes data-handling architectures, influencing global vendors to build GDPR-ready analytics modules.
Regulatory Landscape
XR deployments are increasingly shaped by safety, privacy, and interoperability requirements that vary by region and by end-use. On the standards side, ISO/IEC 5927:2024 (published February 2024) provides safety guidance for AR/VR equipment setup and usage, including considerations around visual stimulus and vection, which affects enterprise rollouts where ergonomics and worker safety programs govern device acceptance.
Policy activity is also rising around virtual worlds governance and cross-border standardization. In the European Union, the European Commission has an ICT standardisation Rolling Plan for 2026 spanning broad digital domains, and Horizon Europe is funding work such as the VICTOR-XR project (registered May 2026) to establish a reference framework for Virtual-Physical Consistency in virtual worlds, supporting interoperability objectives aligned with the EU Web 4.0 and virtual worlds strategy. In the United States, proposed legislation under the Leadership in Immersive Technology Act of 2025 (H.R. 2321/S. 1106) targets creation of an Immersive Technology Advisory Panel under the Department of Commerce to coordinate technical standards, cybersecurity, and ethical deployment, while sector-specific oversight such as the FDA framework for certain VR behavioral therapy devices adds compliance requirements in healthcare.
Competitive Landscape
Competition is moderate. Meta, Apple, Microsoft, Google-Samsung, and Sony supply platform-level ecosystems, while Varjo and Magic Leap specialize in high-fidelity or industrial niches. OpenXR compliance expanded from 7 to 13 large vendors in 2024, lowering switching costs for enterprises. Proprietary hardware alone no longer guarantees lock-in; integrated service portfolios and vertical content libraries now differentiate suppliers.
Meta recorded 40% sales growth in 2024 yet posted a USD 4.97 billion Q4 loss, reflecting scale-heavy R&D commitments. Apple priced Vision Pro at USD 3,500, betting on premium elasticity among professional buyers. Microsoft bundles HoloLens with Dynamics 365 Guides, leveraging SaaS incumbency. Varjo’s photorealistic optics serve aviation and automotive design centers that pay for sub-arcminute resolution. Start-ups such as Wearable Devices and XPANCEO pursue neural-input and smart-lens breakthroughs that could reset form-factor expectations.
Hardware commoditization shifts value toward cloud orchestration, digital-twin integration, and AI-augmented analytics. Vendors that fuse these layers will secure recurring revenue and fend off margin erosion in the Extended Reality market.
Extended Reality (XR) Industry Leaders
Qualcomm Technologies Inc.
Accenture PLC
SoftServe Inc.
SphereGen Technologies LLC
Northern Digital Inc. (Roper Technologies Inc.)
- *Disclaimer: Major Players sorted in no particular order
Extended Reality (XR) Market Companies Covered in this Report
- Meta Platforms Inc. (Reality Labs)
- Sony Group Corp.
- Microsoft Corp.
- Apple Inc.
- HTC Corp. (Vive)
- Qualcomm Technologies Inc.
- Samsung Electronics Co. Ltd.
- Alphabet Inc. (Google XR)
- Pico Interactive Inc. (ByteDance)
- Varjo Technologies Oy
- Magic Leap Inc.
- Nvidia Corp.
- Unity Technologies Inc.
- Vuzix Corp.
- Lenovo Group Ltd.
- Snap Inc.
- Niantic Inc.
- Ultraleap Ltd.
- HP Inc.
- Immersion Corp.

Market Opportunities and Future Outlook
A near-term opportunity is reducing enterprise lock-in and lowering content porting costs through standards-driven interoperability across devices, browsers, and runtimes. Progress at the W3C on the WebXR Device API, including an Interop 2026 push across major browser engines, alongside ongoing OpenXR work at the Khronos Group (including 2026 draft refinement efforts), supports toolchains, testing, and managed services that help enterprises deploy once and operate across mixed fleets spanning Android XR, Apple visionOS, and Meta ecosystems. This targets a key deployment bottleneck around fragmented content-authoring and integration into enterprise systems such as LMS, MES, and safety management.
Another opportunity is the shift toward AI-assisted spatial computing workflows that compress development cycles and enable more context-aware XR experiences at the edge. In June 2026, Qualcomm introduced the Snapdragon Reality Elite platform and the Scalable Turnkey AI-Ready Toolkit (START) aimed at accelerating AR hardware development, while NVIDIA put NVIDIA XR AI into public beta to help developers build multimodal AI agents for AR/XR devices. With on-device inference options such as Unity Sentis, these moves expand the build-and-run stack (silicon, SDKs, and agent frameworks), creating room for integrators and ISVs to package vertical solutions for training, remote assistance, manufacturing digital twins, and healthcare scenarios where privacy and latency constraints limit cloud dependence.
Recent Industry Developments in Extended Reality (XR) Market
- July 2026: Accenture signed a major contract with NATO to help advance a more agile and resilient digital infrastructure. The work supports Accenture’s role as an implementation partner for secure, enterprise-scale digital platforms that can also underpin XR training, visualization, and collaboration deployments across defense and allied organizations.
- June 2026: Qualcomm unveiled the Snapdragon Reality Elite platform for mixed-reality and launched its Scalable Turnkey AI-Ready Toolkit (START) to speed AR hardware development. These releases move more of the XR value chain toward standardized, referenceable hardware-and-software building blocks, shortening time-to-market for OEMs and expanding the pool of devices capable of running AI-enhanced spatial workloads.
- January 2024: SoftServe joined an international team developing NASA-funded lunar landing and launch pad technologies, including simulation-related work. The program reinforces XR and simulation’s role in high-stakes engineering and training environments where digital twins and immersive visualization are used to reduce risk and improve operational readiness.


Extended Reality (XR) Market Report Scope and Research Methodology
Market Definition and Coverage
For this study, the extended reality (XR) market covers the revenue generated from XR offerings that enable augmented, virtual, and mixed reality experiences, across consumer and enterprise use. The value includes spending tied to the XR experience stack, where hardware, software, and related services are purchased for deployment and use.
Scope exclusions: Standalone content that is not designed for AR, VR, or MR usage, and non-XR 2D display-only solutions are excluded from the market totals.
Segments Covered in This Report
- By Offering
- Hardware
- Software
- Services
- By Device Type
- Head-Mounted Displays (Tethered, Stand-alone)
- Head-Up Displays
- Handheld and Mobile Devices
- Others
- By Technology
- Virtual Reality (VR)
- Augmented Reality (AR)
- Mixed Reality (MR)
- By End-user Industry
- Gaming and Entertainment
- Healthcare and Life Sciences
- Industrial and Manufacturing
- Retail and E-commerce
- Education and Training
- Aerospace and Defense
- Architecture, Engineering and Construction
- Others
- By Geography
- North America
- United States
- Canada
- Mexico
- South America
- Brazil
- Argentina
- Rest of South America
- Europe
- United Kingdom
- Germany
- France
- Italy
- Spain
- Rest of Europe
- Asia-Pacific
- China
- Japan
- South Korea
- India
- Australia
- Rest of Asia-Pacific
- Middle East and Africa
- Middle East
- Saudi Arabia
- United Arab Emirates
- Turkey
- Rest of Middle East
- Africa
- South Africa
- Nigeria
- Egypt
- Rest of Africa
- Middle East
- North America
Data Sources, Market Sizing, and Validation
Desk Research
Desk work starts with building a clean fact base on device shipments, trade flows, and the pace of adoption in major end-use industries. We use public and official sources, including US International Trade Commission data, US Bureau of Labor Statistics series for relevant industries, OECD digital economy indicators, World Bank macro and ICT indicators, and filings and announcements published on regulator and exchange websites.
Once the baseline is in place, product and use-case signals are cross-checked using company annual reports, investor presentations, import and export shipment-level data subscriptions, patent database subscriptions, and trusted press coverage of product launches and enterprise pilots. The sources listed here are illustrative only, and we reviewed additional public documents and datasets to collect data, validate assumptions, and clarify open questions.
Primary Interviews and Surveys
Primary discussions were used to pressure-test adoption timing, average selling price movement, and which spending lines buyers treat as XR versus adjacent digital tools. We spoke with a mix of device ecosystem participants, software and platform specialists, system integrators, and enterprise buyers across APAC, EMEA, and the Americas, then re-checked key assumptions when responses diverged.
Distribution of primary research fieldwork respondents
| Company type | Respondent position | Region |
|---|---|---|
| Top tier: 30% | CXOs: 19% | APAC: 37% |
| Mid tier: 49% | Functional/Unit leaders: 38% | EMEA: 37% |
| Smaller Players: 21% | Managers: 43% | Americas: 26% |
Market-Sizing & Forecasting
Sizing begins with a top-down build where device install base and shipment trends are reconstructed and mapped by AR, VR, and MR usage using public indicators and industry checkpoints. Those totals are then translated into revenue using practical inputs such as headset and smart-glasses average selling prices, software attach rates, enterprise versus consumer mix, and refresh cycles that differ by device type.
To keep the totals realistic, the outputs are corroborated with selective bottom-up approximations, including sampled ASP times volume checks for key device categories, channel feedback on order momentum, and supplier and integrator revenue patterns where disclosures exist. Forecasts are produced using scenario analysis supported by a regression layer on drivers like enterprise deployment intensity, broader consumer spending conditions, and hardware price erosion, and then adjusted based on expert consensus on adoption bottlenecks. When coverage gaps appear in smaller geographies or early-stage use cases, assumptions are filled using proxy indicators such as smartphone penetration, 5G coverage direction, and enterprise IT spending growth, and then validated again through follow-up calls.
Data Validation & Update Cycle
Validation is done through multi-step checks so the final numbers match real-world signals, rather than only fitting a single dataset. Model outputs are compared against independent metrics such as shipment direction, announced enterprise rollouts, and import and export patterns, and unusual jumps are reviewed until the driver is clearly explained.
Before sign-off, at least two analysts review the assumptions, math links, and year-over-year movement to reduce the risk of hidden errors. The work is refreshed annually, and interim updates are triggered when material events occur, such as major device releases, policy changes affecting adoption, or step changes in pricing. Right before delivery, a fresh pass is completed so clients receive the most up-to-date view available at that time.
Mordor Intelligence's Extended Reality Xr Market Size Measured Against Other Published Estimates
Published XR market values can look far apart because the included product set, the year used as the base, and the way pricing is projected are not the same across sources. Differences also show up when some figures blend adjacent categories like smart glasses or spatial computing into XR, even when buyer budgets treat them as separate lines.
The main gap comes from scope expansion into adjacent device and computing categories, where Mordor Intelligence counts XR only when AR, VR, or MR use is the clear primary purpose and revenue is tied to those experiences. This keeps the model aligned to XR-specific shipment and adoption signals.
Benchmark comparison
| Source | Market Size | Gaps in Research Methodology |
|---|---|---|
| Mordor Intelligence | USD 10.64 B (2026) | |
| Global Consultancy A | USD 346.09 B (2026) | Uses a much broader umbrella that can fold in adjacent computing and smart device categories, which inflates the counted revenue beyond AR, VR, and MR specific spending. |
| Industry Publisher B | USD 23.31 B (2024) | Uses an earlier base year and a broader component and application capture, and the pricing and attach-rate progression assumptions can differ by device class and end-use mix. |
The comparison shows that the spread is mostly explained by what gets counted as XR and how revenue is mapped to device and software spending lines. When the scope is kept consistent and the key variables are tied back to adoption, shipments, and realistic ASP paths, the resulting market size becomes easier to trace and repeat year after year.


Key Questions Answered in the Report
What is the current value of the Extended Reality market?
The market reached USD 10.64 billion in 2026 and is forecast to grow to USD 59.18 billion by 2031 at a 40.95% CAGR.
Which factors are driving rapid enterprise adoption of XR?
Sub-20 ms latency from 5G plus edge computing, AI-powered adaptive training, and growing government funding together create strong, measurable returns for manufacturers, healthcare systems, and defense organizations.
Which region will expand the fastest through 2031?
Asia-Pacific is projected to post a 41.20% CAGR thanks to large-scale 5G rollouts, China’s Three-Year Metaverse Action Plan, and aggressive manufacturing digitization programs.
What is the biggest hurdle to wider XR deployment?
High upfront costs for premium optics and processors, amplified by ongoing semiconductor supply constraints, remain the primary barrier—especially for small and mid-size enterprises.
How does 5G improve XR performance?
5G networks shift heavy processing to the network edge, delivering real-time visuals with millisecond precision while allowing lighter, more comfortable devices suitable for full-shift use.
Page last updated on:


 Your data is secure and never sold or shared.


