
Osteoporosis Drugs Market Size and Share
Market Overview
| Study Period | 2020 - 2031 |
|---|---|
| Market Size (2026) | USD 17.67 Billion |
| Market Size (2031) | USD 22.22 Billion |
| Growth Rate (2026 - 2031) | 4.68 % |
| Fastest Growing Market | Asia Pacific |
| Largest Market | North America |
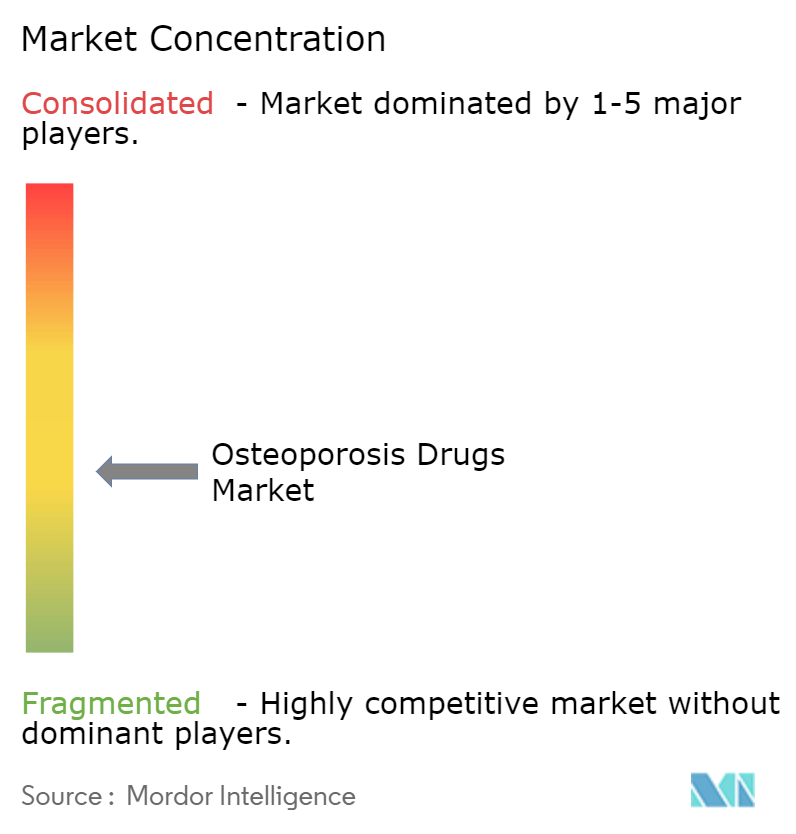
| Market Concentration | Medium |
Major Players *Disclaimer: Major Players sorted in no particular order Image © Mordor Intelligence. Reuse requires attribution under CC BY 4.0. | |
Osteoporosis Drugs Market Analysis by Mordor Intelligence
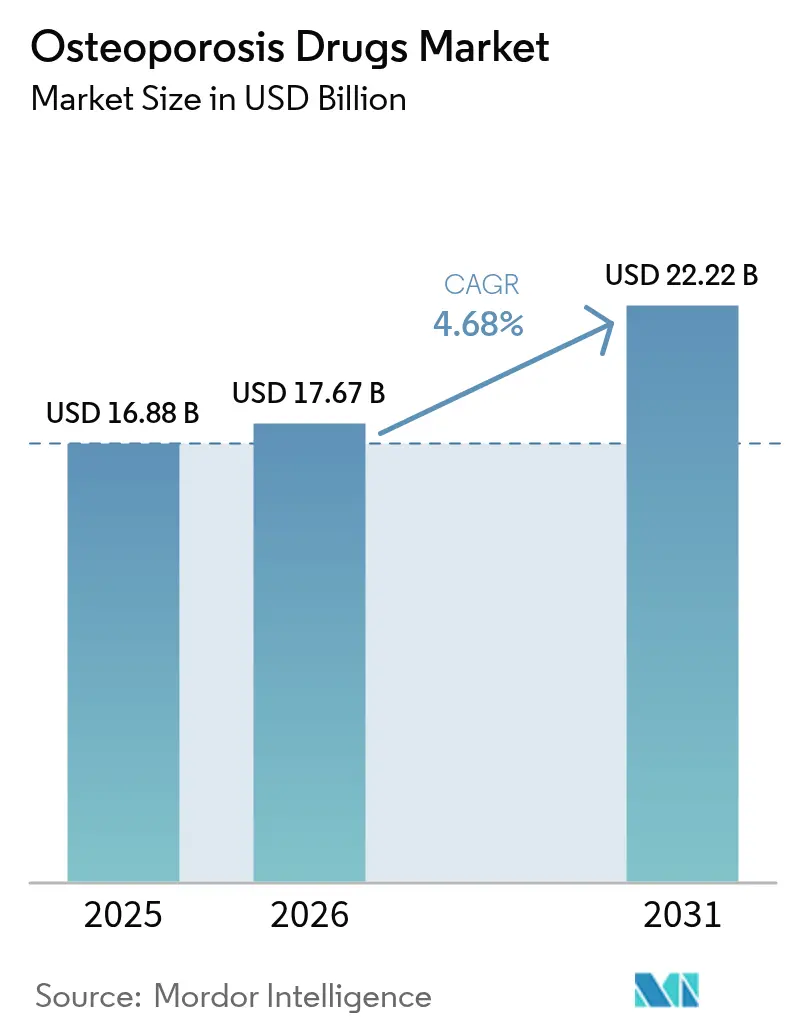
The osteoporosis drugs market size is expected to grow from USD 16.88 billion in 2025 to USD 17.67 billion in 2026 and is forecast to reach USD 22.22 billion by 2031 at 4.68% CAGR over 2026-2031. The trajectory shows a disciplined shift from low-priced bisphosphonates toward premium biologics and bone-building anabolic agents that promise faster fracture-risk reduction. Population aging, rising life expectancy, and earlier diagnosis—bolstered by opportunistic AI screening—continue to expand the treated patient pool. Reimbursement reforms that tie therapy to national fracture registries are speeding time-to-treatment, while real-world evidence pathways shorten product-approval cycles. Biosimilar launches following the denosumab patent cliff will add price competition yet simultaneously enlarge the osteoporosis drugs market by improving affordability.
Key Report Takeaways
- By drug class, bisphosphonates led with 36.95% osteoporosis drugs market share in 2025; sclerostin inhibitors are projected to grow the fastest at a 5.06% CAGR to 2031.
- By route of administration, oral formulations held 65.05% of the osteoporosis drugs market size in 2025, whereas injectables are set to expand at a 5.62% CAGR through 2031.
- By distribution channel, retail pharmacies captured 46.88% revenue share in 2025; online pharmacies are forecast to record the highest 5.74% CAGR to 2031.
- By end user, hospitals accounted for 57.05% of the osteoporosis drugs market size in 2025, while home-care settings will advance most quickly at a 6.02% CAGR.
- By geography, North America accounted for 39.40% of the osteoporosis drugs market size in 2025, while Asia-Pacific will advance most quickly at a 6.74% CAGR.
Note: Market size and forecast figures in this report are generated using Mordor Intelligence’s proprietary estimation framework, updated with the latest available data and insights as of 2026.
Market Trends and Insights
Drivers Impact Analysis of Osteoporosis Drugs Market*
| Driver | (~) % Impact on CAGR Forecast | Geographic Relevance | Impact Timeline |
|---|---|---|---|
| Ageing population & fracture-risk burden | +1.80% | Global; highest in Japan, Germany, Italy | Long term (≥ 4 years) |
| Rising adoption of anabolic agents | +1.20% | North America & EU, expanding to APAC | Medium term (2-4 years) |
| Surge in monoclonal antibody use | +0.90% | Global, led by developed markets | Medium term (2-4 years) |
| AI-enabled primary-care fracture-risk screening | +0.60% | North America & EU, pilot programs in APAC | Short term (≤ 2 years) |
| National osteoporosis registries | +0.40% | EU, Canada, spreading to Asia-Pacific | Medium term (2-4 years) |
| microRNA-based pipelines | +0.30% | R&D hubs in United States & EU | Long term (≥ 4 years) |
| Source: Mordor Intelligence | |||
Ageing Population & Fracture-Risk Burden
Individuals aged 50 and above constitute the dominant risk group, and annual osteoporotic fractures are expected to reach 6.3 million by 2050, with Asia-Pacific carrying most of the future caseload. Hip-fracture mortality runs at 20% within 12 months, spurring demand for therapies that act quickly to rebuild bone and avert secondary fractures. In Japan, bone-density testing rates remain only 14% in rural hospitals despite 41% osteoporosis diagnoses, underscoring the diagnostic gap. Medicare spent USD 5.7 billion on fracture care for 1.8 million beneficiaries in 2016, and 80% of post-fracture patients still went untreated, highlighting cost pressures to expand access. These demographic forces cement a multi-year demand floor for every drugs class within the osteoporosis drugs market.
Rising Adoption of Anabolic Agents
Anabolic drugs such as teriparatide and abaloparatide achieve vertebral-fracture reductions of 65% and 86%, respectively, outperforming antiresorptives and attracting premium reimbursement medpagetoday.com. The FDA’s 2024 expansion of abaloparatide to treat male patients increased the addressable pool by 12% in the United States managedhealthcareexecutive.com. Sequential regimens that start with romosozumab then transition to denosumab preserve fracture-risk reductions over five years ucb.com. Japanese real-world evidence confirms that high-risk cohorts receive romosozumab with cardiovascular monitoring, signifying clinical trust despite label warnings springer.com. Stronger insurance coverage and updated guidelines legitimize the anabolic first-line approach, enriching the osteoporosis drugs market.
Surge in Monoclonal Antibody Use
Denosumab’s RANKL blockade produces fracture-risk reductions of 68% (vertebral) and 40% (hip) over three years, and 10-year data show lasting bone-density gains without new safety issues. Romosozumab complements this efficacy by stimulating formation while restricting resorption; 73% fewer new vertebral fractures emerged within 12 months of treatment start. With denosumab’s main US patent expiring in February 2025, Sandoz, Samsung Bioepis, and Celltrion have introduced interchangeable biosimilars priced 20-30% lower, broadening patient access. Although price pressure may slow revenue per script, the lower cost base can enlarge treated volumes, reinforcing overall growth for the osteoporosis drugs market.
AI-Enabled Primary-Care Fracture-Risk Screening
Deep-learning software now detects low bone mineral density on incidental foot radiographs with 89.89% accuracy and an AUC of 0.94, removing the bottleneck of scarce DXA scanners. Machine-learning algorithms that ingest demographic and lifestyle data reach AUCs of 0.848, outperforming legacy risk calculators frontiersin.org. Automated CT-based quantification captures osteoporotic cases missed by DXA, especially in patients with spinal degeneration nature.com. The XGB algorithm surpasses the Osteoporosis Self-Assessment Tool in Tibetan cohorts, indicating the need for ethnicity-specific screening models. Earlier detection shifts many patients into therapy sooner, feeding incremental demand across every segment of the osteoporosis drugs market.
Restraints Impact Analysis of Osteoporosis Drugs Market*
| Restraint | (~) % Impact on CAGR Forecast | Geographic Relevance | Impact Timeline |
|---|---|---|---|
| Adverse effects & poor long-term compliance | -1.10% | Global; highest in elderly populations | Medium term (2-4 years) |
| Patent expiries triggering generic erosion | -0.80% | North America & EU, spreading globally | Short term (≤ 2 years) |
| Cold-chain dependency for biologics | -0.50% | Emerging markets in APAC, MEA, Latin America | Medium term (2-4 years) |
| Stringent post-marketing safety for sclerostin inhibitors | -0.40% | Global, with toughest rules in United States & EU | Long term (≥ 4 years) |
| Source: Mordor Intelligence | |||
Adverse Effects & Poor Long-Term Compliance
Average medication-possession ratios sit at only 61.9% after two years, and abrupt denosumab discontinuation triggers rebound bone resorption with a 20% higher fracture risk. Denosumab also shows hypocalcemia and dermatologic safety signals clustering in the first 30 days of use. Romosozumab carries boxed warnings for myocardial infarction and stroke; 0.8% of treated subjects experienced MI versus 0.3% on alendronate drugs.com. Bisphosphonate non-adherence still averages 23.3% in Japan despite monthly or quarterly dosing options. These compliance gaps shave growth from the osteoporosis drugs market, particularly in oral segments.
Patent Expiries Triggering Generic Erosion
The denosumab cliff in 2025 opened a USD 3.8 billion revenue pool to biosimilars, with Sandoz’s Jubbonti and Samsung Bioepis’ Ospomyv reaching U.S. shelves on May 31, 2025 under settlement terms. Romosozumab patents lapse in 2026, though method claims last to 2033, delaying full erosion. Generic alendronate already undercuts branded pricing by up to 80% while demonstrating comparable fracture-prevention efficacy. Lower prices can lift volumes but temper overall revenue expansion, especially in the osteoporosis drugs market’s mature regions.
*Our forecasts treat driver/restraint impacts as directional, not additive. The impact forecasts reflect baseline growth, mix effects, and variable interactions.
Osteoporosis Drugs Market Segment Analysis
By Drug Class:
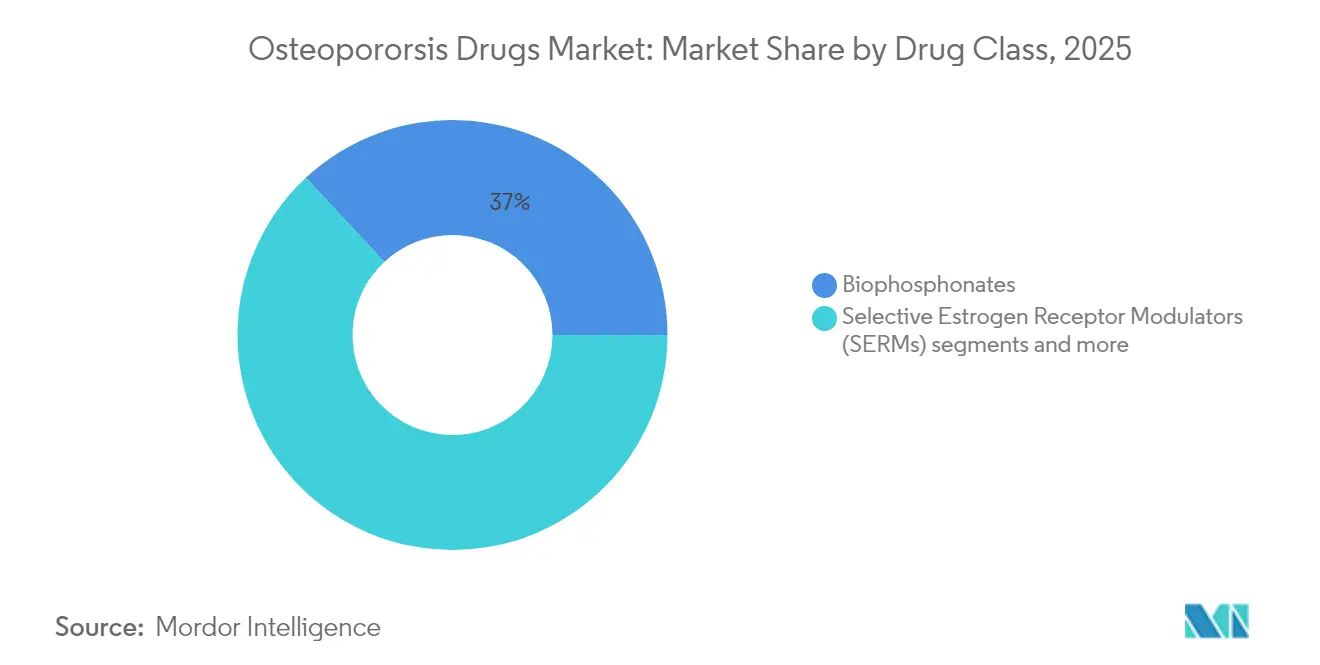
Biologics Reshape Traditional HierarchiesBisphosphonates retained a 36.95% osteoporosis drugs market share in 2025, yet growth slowed to less than 1% annually as payers and physicians pivoted toward higher-value options. Sclerostin inhibitors, chiefly romosozumab, exhibited the fastest 5.06% CAGR as clinicians prioritized rapid bone-formation gains for severe-risk patients. RANKL inhibitors, anchored by denosumab, remained the top-selling biologic because six-month dosing supports adherence.
Selective estrogen receptor modulators held niche roles for women unable to tolerate bisphosphonates, while parathyroid hormone analogues served as bridge therapy before antiresorptive maintenance. Pipeline attention shifted to microRNA modulators and Wnt-signaling activators that promise dual bone-building and resorption-control profiles. Declining calcitonin use, owing to questionable efficacy, shortened product life-cycles and redirected R&D budgets toward next-generation biologics that can lengthen treatment duration and sustain the osteoporosis drugs market’s value proposition.

By Route of Administration:
Injectable Growth AcceleratesOral drugs still composed 65.05% of 2025 revenue because of generic alendronate’s ubiquity, but injectables expanded at a 5.62% CAGR, reflecting biologic uptake. Denosumab’s twice-yearly subcutaneous dosing and romosozumab’s monthly regimen improved adherence relative to daily pills, particularly among elderly patients managing polypharmacy.
Home-health nurses and self-injection pens reduced hospital visits, while Medicare coverage for in-home injections lowered out-of-pocket costs. Intravenous zoledronic acid maintained relevance for patients seeking once-yearly dosing, yet its usage faced stiff rivalry from subcutaneous biologics. Research into hydrogel micro-depots that release anabolic peptides over 12 weeks could further tilt preferences toward minimally invasive delivery. Cold-chain logistics remained a bottleneck in emerging markets, but investment in passive shipping containers and pharmacy-grade refrigerators is narrowing the gap, unlocking new provincial sales for the osteoporosis drugs market.
By Distribution Channel:
Digital Transformation AcceleratesRetail pharmacies commanded 46.88% revenue in 2025 as the primary refill point for oral bisphosphonates. Yet online and specialty pharmacies, aided by telemedicine, clocked 5.74% CAGR by automating refills, counseling, and reimbursement paperwork for high-priced biologics. Hospital pharmacies retained control over initial injectable dosing and medication teaching.
Specialty pharmacies embedded AI adherence dashboards that flag missed doses and trigger pharmacist outreach, lifting refill compliance by 11 percentage points year on year. Drug-store chains in rural locations filled a critical access niche, often partnering with tele-endocrinology hubs that prescribe anabolic starters before routing follow-up doses locally. This hybrid model smooths patient journeys and funnels incremental scripts into the osteoporosis drugs market.
By End User:
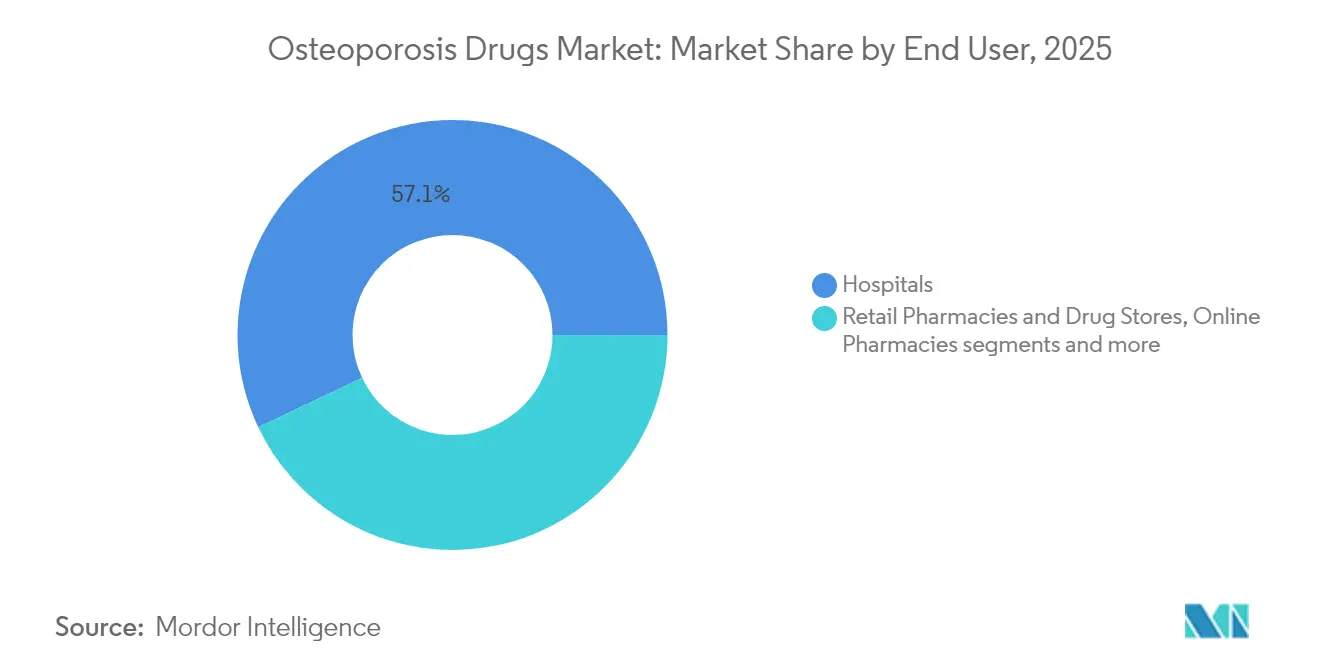
Home-Care Expansion Reshapes DeliveryHospitals contributed 57.05% of 2025 revenues owing to acute fracture management and initiation of complex regimens, while home care marked the swiftest 6.02% CAGR. Clinics offered ongoing monitoring, yet remote-monitoring wearables such as Osteoboost redirected selected osteopenia cases entirely out of bricks-and-mortar settings.
By 2025, the osteoporosis drugs market size attached to home-care patients stood at USD 3.21 billion and is set to reach USD 4.55 billion by 2031 thanks to expanded reimbursement for nurse-administered injections and digital follow-ups. Research institutes sustained their role in phase 2/3 trials, granting early access to pipeline agents under expanded-access protocols. The home-care trend promises durable volume growth as patient lifestyle preferences mesh with payer incentives to curtail hospital readmissions, reshaping end-user economics across the osteoporosis drugs market.
Geography Analysis
North America Osteoporosis Drugs Market
North America preserved its 39.40% revenue share in 2025, anchored by broad insurance coverage, specialty pharmacist networks, and quick uptake of newly approved agents. The Centers for Medicare & Medicaid Services added osteoporosis to its 2025 Medication Therapy Management core list, which is expected to raise adherence and push additional refills into the osteoporosis drugs market. Canada’s mandatory fracture registries began linking treatment reimbursement to guideline adherence, improving first-dose capture within 90 days of index fracture.
APAC Osteoporosis Drugs Market
Asia-Pacific recorded the fastest 6.74% CAGR and is projected to overtake Europe in annual treatment volumes by 2029. Japan’s universal coverage reimburses every approved osteoporosis regimen, yet under-diagnosis in rural prefectures leaves a latent cohort untapped. China’s tertiary-hospital data show denosumab usage rising 78% year on year, supported by inclusion in the 2024 National Reimbursement Drug List. India’s private-sector hospitals introduced bundled fracture-prevention packages that incorporate romosozumab starter doses, suggesting future tailwinds for the osteoporosis drugs market.
EMEA and South America Osteoporosis Drugs Market
Europe remains a stable yet price-sensitive region. The European Medicines Agency now accepts real-world evidence for line-extensions, as seen in abaloparatide’s 2024 authorization based on post-marketing data. National health technology assessment bodies negotiate steep discounts—up to 25%—for biologics entering regional formularies, restraining revenue growth but widening patient access. South America and the Middle East & Africa still account for single-digit shares yet post healthy mid-single-digit CAGRs as public-sector screening programs ramp and global NGOs subsidize bisphosphonate supplies. Improved cold-chain corridors are beginning to unlock biologic penetration, seeding long-term expansion for the osteoporosis drugs market.
Regulatory Landscape
Regulation of osteoporosis drugs remains anchored in robust safety monitoring for higher-risk therapies and explicit post-marketing commitments by regulators such as the FDA and EMA. In June 2025, the EMA granted EU-wide marketing authorizations for denosumab biosimilars Junod and Zadenvi, reinforcing the biosimilar framework and improving patient access to biologic antiresorptives. National formulary dynamics and clinical practice guidance continue to shape uptake in routine care, with ongoing influence from guidelines issued by bodies such as the UK National Osteoporosis Guideline Group (NOGG) in December 2024 and related regional updates through 2026.
At the standards level, ISO/TS 21405:2026 advanced IDMP ontology alignment is advancing cross-jurisdictional product identification, strengthening compliance for manufacturers operating globally and enhancing traceability across the supply chain.
Competitive Landscape
The market shows moderate concentration: the top five manufacturers controlled 53% of 2024 sales. Amgen leverages 20 years of denosumab data and recently launched a digital companion app that schedules home-injection reminders. Eli Lilly capitalizes on abaloparatide’s expanded male indication and co-promotes teriparatide with generic partners to defend share ahead of next-gen anabolic entrants. UCB positions romosozumab as a first-year induction therapy before transitioning patients to antiresorptives, creating a lifecycle management moat. Novartis maintains a legacy bisphosphonate line and incubates early-stage Wnt modulators acquired via its 2024 PeakRadius acquisition.
Biosimilar makers Sandoz, Samsung Bioepis, Celltrion, and Organon orchestrated synchronized denosumab launches in mid-2025, pricing 22% below the originator yet offering white-glove specialty-pharmacy support to capture switchers quickly. Alvotech and Dr. Reddy’s plan a 2026 follow-on entrant, aiming at 15% U.S. share within three years through hospital discount contracts. Technology partnerships add competitive complexity: Henlius supplies drug substance for Organon’s global filings, and Bone Health Technologies collaborates with Kaiser Permanente to integrate Osteoboost adherence data into electronic medical records.
Differentiation increasingly hinges on care-ecosystem build-out rather than molecule alone. Players are investing in AI fracture-risk algorithms, remote densitometry devices, and real-world-evidence dashboards that satisfy regulators while reinforcing brand loyalty. Start-ups exploring microRNA anabolic therapies may offer in-licensing targets by 2028, suggesting a continual refresh cycle that keeps the osteoporosis drugs market dynamic.
Osteoporosis Drugs Industry Leaders
-
Amgen Inc.
-
Eli Lily and Company
-
F. Hoffmann La Roche
-
Merck & Co. Inc.
-
Pfizer Inc
- *Disclaimer: Major Players sorted in no particular order
Osteoporosis Drugs Market Companies Covered in this Report
- Amgen
- Apotex
- Dr. Reddy’s Laboratories
- Eli Lilly and Company
- Roche
- GlaxoSmithKline
- Jiangsu Hengrui Medicine Co. Ltd.
- Kyowa Kirin
- Merck
- Novartis
- Pfizer
- Radius Health
- Sanofi
- Servier Laboratories
- Sun Pharma Industries Ltd.
- Takeda Pharmaceuticals
- Teijin Pharma Ltd.
- Teva Pharmaceutical Industries
- UCB
- Zhejiang Hisun Pharmaceutical Co. Ltd.
Market Opportunities and Future Outlook
A concrete development enabling faster program progression is the FDA's December 2025 qualification of total hip bone mineral density (BMD) measured by DXA as a validated surrogate endpoint for osteoporosis drug development, creating a more direct development route for certain agents and reformulations based on measurable BMD changes.
Another anchor is the ongoing evolution of convenience-led therapies and biosimilar competition. Entera Bio has advanced EB613, with Phase 3 protocol submissions to the FDA in March 2026 and favorable FDA feedback in June 2026 accepting a 12-month total hip BMD primary endpoint for its registrational study. Meanwhile, in April 2026 the FDA approved Teva's denosumab biosimilar PONLIMSI for all Prolia indications, expanding lower-priced options and strengthening payer negotiating leverage across formulary contracts.
Recent Industry Developments in Osteoporosis Drugs Market
- July 2026: The European Commission granted marketing authorization for a teriparatide biosimilar in Europe. The decision expands competition in bone-building therapies and increases payer leverage in tenders and hospital formularies, particularly where injectable anabolic use is budget constrained.
- April 2026: The FDA approved Teva Pharmaceutical Industries' denosumab biosimilar PONLIMSI for all indications of the reference product Prolia. The approval adds another interchangeable-like option for contracting and can accelerate switching from originator denosumab through lower net pricing and broader formulary access.
- May 2025: Sandoz launched Jubbonti (denosumab) in the United States, with market availability beginning May 31, 2025 under settlement terms tied to the Prolia patent cliff. This launch intensified biosimilar competition in the RANKL inhibitor segment and raised price pressure while expanding access for biologic antiresorptive therapy.
Osteoporosis Drugs Market Report Scope and Research Methodology
Market Definition and Coverage
For this study, the osteoporosis drugs market covers prescription medicines used to prevent and treat osteoporosis by slowing bone loss or supporting bone formation across outpatient and inpatient use, measured in value terms.
Scope exclusions: OTC calcium and vitamin supplements, nutraceuticals, and surgical bone graft and orthobiologic products are excluded.
Segments Covered in This Report
- By Drug Class
- Bisphosphonates
- Selective Estrogen Receptor Modulators (SERMs)
- Parathyroid Hormone Analogues
- RANK Ligand Inhibitors
- Calcitonin
- Sclerostin Inhibitors
- Others
- By Route of Administration
- Oral
- Intravenous
- Subcutaneous
- By Distribution Channel
- Hospital Pharmacies
- Retail Pharmacies & Drug Stores
- Online Pharmacies
- By Geography
- North America
- United States
- Canada
- Mexico
- Europe
- Germany
- United Kingdom
- France
- Italy
- Spain
- Rest of Europe
- Asia-Pacific
- China
- Japan
- India
- South Korea
- Australia
- Rest of Asia-Pacific
- South America
- Brazil
- Argentina
- Rest of South America
- Middle East and Africa
- GCC
- South africa
- Rest of Middle East and Africa
- North America
Data Sources, Market Sizing, and Validation
Desk Research
Desk work starts with building a clear demand and treatment context, so we can anchor prescriptions and therapy choices to real patient pools. We refer to public sources such as the US CDC, the US NIH and NLM resources, the World Health Organization, the US FDA drug labels and approval databases, and the OECD health statistics to understand prevalence, diagnosis patterns, and therapy standards.
Once the care pathway is clear, the model is filled with pricing and utilization signals that can be checked across multiple angles. We review annual reports and investor presentations of relevant drug manufacturers, reimbursement and formulary notes published by health systems, and reputed medical journals that discuss persistence and switching in osteoporosis therapy. Select paid subscriptions for company financials and intelligence, patent databases, and shipment level import and export data were also used to validate timelines, product footprints, and supply signals. The sources listed here are illustrative and not exhaustive, and additional public references were also consulted for data collection, validation, and clarification.
Primary Interviews and Surveys
Primary discussions were used to confirm how often each therapy class is used in practice, how persistence and discontinuation shape annual demand, and how pricing varies by channel and reimbursement. Interviews covered prescribing behavior, hospital and retail pharmacy workflows, distribution flows, and market access inputs across key regions, and then assumptions were tightened where desk sources had gaps or mixed signals.
Distribution of primary research fieldwork respondents
| Company type | Respondent position | Region |
|---|---|---|
| Top tier: 38% | CXOs: 17% | APAC: 40% |
| Mid tier: 43% | Functional/Unit leaders: 25% | EMEA: 33% |
| Smaller Players: 19% | Managers: 58% | Americas: 27% |
Market-Sizing & Forecasting
Sizing is built using a top-down approach where the diagnosed osteoporosis population is converted into a treated pool, and then therapy mix and annual cost are applied to reach a value estimate. The key inputs include age and gender skew of osteoporosis prevalence, diagnosis and treatment rates, share of antiresorptive versus anabolic therapy, average duration and persistence by route of administration, and typical price levels across hospital, retail, and online channels.
To keep the totals realistic, results are cross-checked with selective bottom-up approximations such as sampled price points by molecule and route, channel checks on typical patient volumes, and supplier and distribution feedback on demand direction. When a country has limited public detail, the gap is handled through proxying from similar reimbursement and care settings, followed by expert confirmation and conservative adjustments.
Forecasts use scenario analysis supported by multivariate regression cues, where drivers like aging population, fracture awareness, biosimilar uptake timing, and expected formulary changes are tested in combination. Assumptions are then finalized after we align the direction and magnitude with what primary respondents see in real prescribing and access behavior.
Data Validation & Update Cycle
Outputs are validated through triangulation across patient pool math, therapy mix logic, and pricing checks, and then variances are investigated before figures are finalized. If a class level share, country total, or price trend looks inconsistent with independent signals, we re-check the input series and, when needed, re-contact expert sources to confirm the reason.
Each report goes through multi-step analyst review so arithmetic, definitions, and assumptions stay consistent across regions and years. The study is refreshed annually, and interim updates are done when material events occur, such as major label changes, reimbursement shifts, or meaningful biosimilar entries. Before delivery, a fresh pass is completed so the numbers reflect the latest available public and primary signals.
Mordor Intelligence's Osteoporosis Drugs Market Size Compared With Other Published Estimates
Published market values for osteoporosis drugs can look different across sources, even when they are all talking about the same disease area. The gaps usually come from what gets counted as a drug sale, the year used as the base, the way pricing is averaged across channels, and how quickly assumptions are updated after policy and patent events.
Some external estimates use earlier base years or extend the scope into adjacent categories like broader bone health products, which changes the starting value and the growth path. For Mordor Intelligence, only prescription pharmacologic osteoporosis therapies are counted, and OTC supplements and surgical orthobiologic products are kept out, with persistence and therapy-mix inputs refreshed using recent expert feedback.
Benchmark comparison
| Source | Market Size | Gaps in Research Methodology |
|---|---|---|
| Mordor Intelligence | USD 17.67 B (2026) | |
| Global Consultancy A | USD 15.28 B (2024) | Uses an earlier base year and a shorter forward curve, and the pricing and mix reflect a different point in the biosimilar and post-patent cycle, which can pull down the stated current value. |
| Industry Publisher B | USD 15.60 B (2025) | Base year sits closer to pre-refresh formulary and utilization shifts, and the class mix and route weighting can differ, especially if persistence and discontinuation are treated more simply. |
Across the three figures, most of the spread can be traced to base-year choice, how therapy duration and persistence are modeled, and whether channel pricing is averaged in a consistent way. By keeping the scope limited to prescription osteoporosis treatments and tying uptake to patient and therapy-mix signals that can be rechecked, the final number stays transparent and repeatable for decision-making.
Key Questions Answered in the Report
What is the current size of the osteoporosis drugs market?
The osteoporosis drugs market generated USD 17.67 billion in 2026 and is projected to reach USD 22.22 billion by 2031.
Which drug class holds the largest share?
Bisphosphonates remained the biggest category with a 36.95% osteoporosis drugs market share in 2025.
Why are anabolic agents gaining popularity?
They deliver vertebral-fracture reductions up to 86% and now receive broader reimbursement, making them attractive for high-risk patients.
How will biosimilars influence market growth?
Denosumab biosimilars priced 20-30% below the originator will expand patient access, increasing treated volumes but trimming per-patient revenue.
Which region is growing the fastest?
Asia-Pacific is advancing at a 6.74% CAGR because of rapid population aging, broader insurance coverage, and rising biologic uptake.
What role does AI play in osteoporosis care?
AI models embedded in primary care imaging detect low bone density with nearly 90% accuracy, enabling earlier intervention and reducing downstream fracture costs.