Generic Drugs Market Size and Share
Market Overview
| Study Period | 2020 - 2031 |
|---|---|
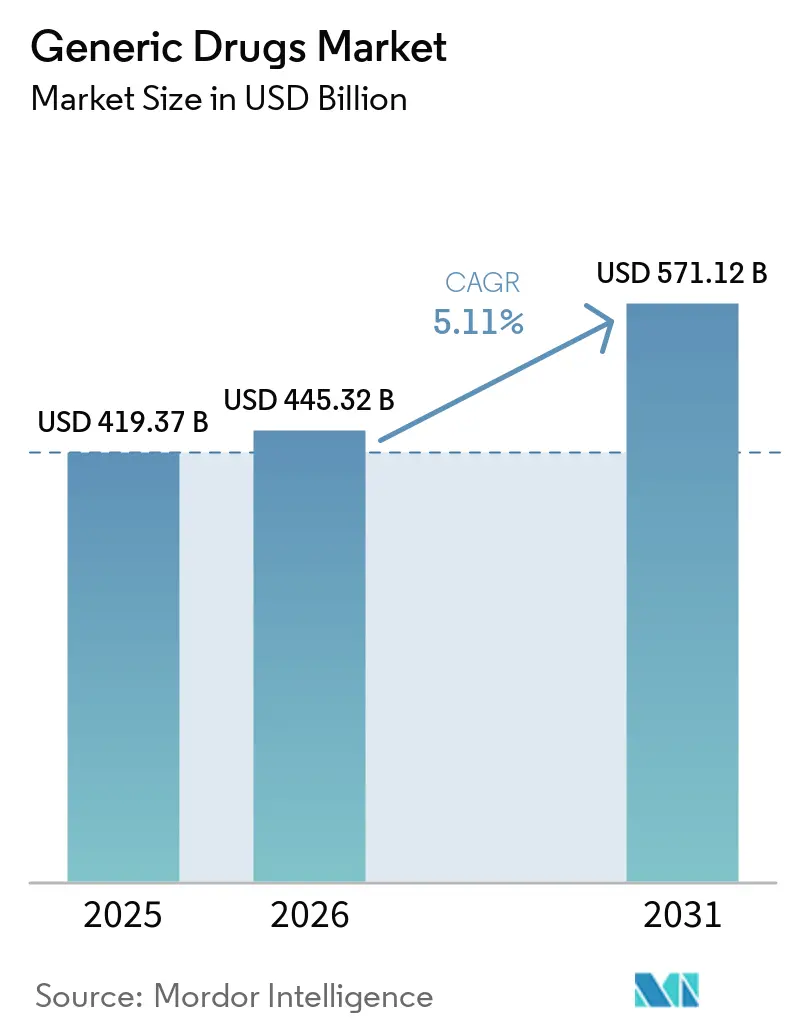
| Market Size (2026) | USD 445.32 Billion |
| Market Size (2031) | USD 571.12 Billion |
| Growth Rate (2026 - 2031) | 5.11% CAGR |
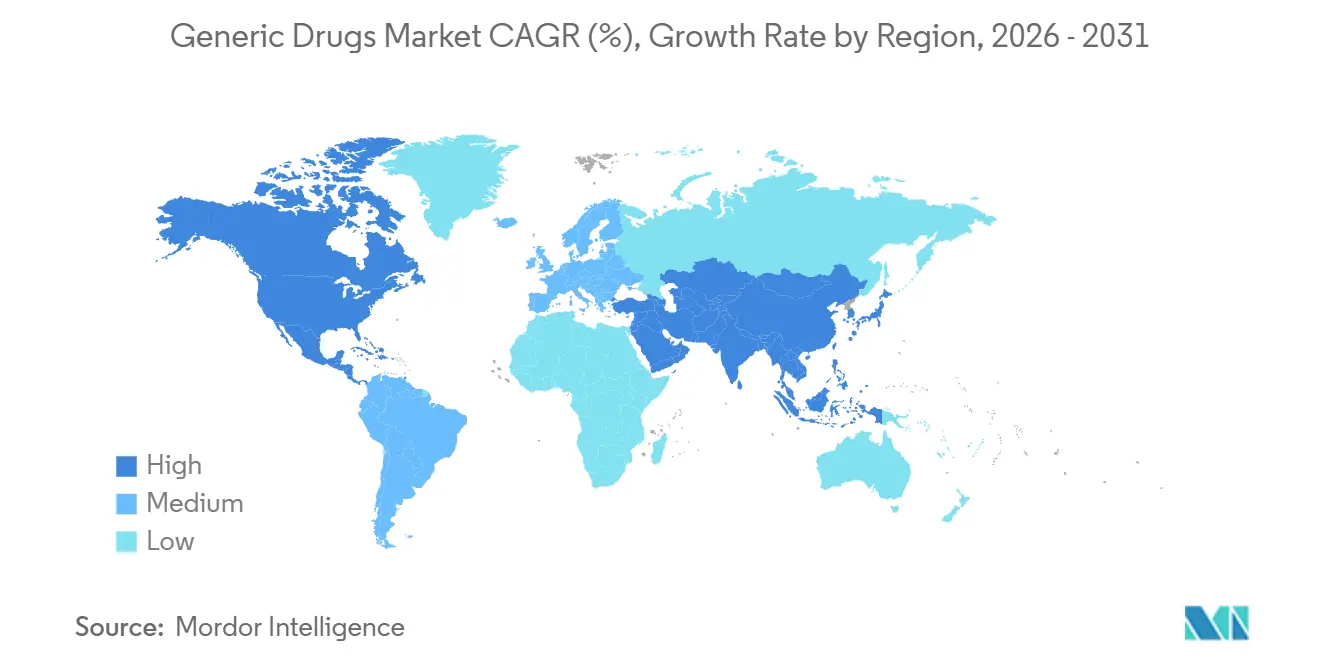
| Fastest Growing Market | Asia-Pacific |
| Largest Market | North America |
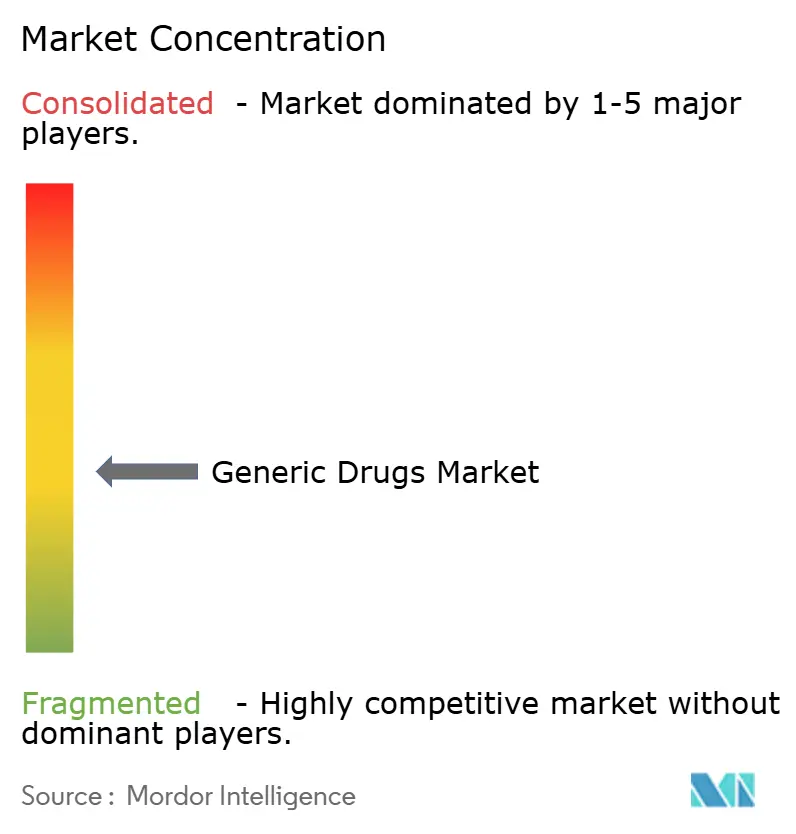
| Market Concentration | Medium |
Major Players *Disclaimer: Major Players sorted in no particular order Image © Mordor Intelligence. Reuse requires attribution under CC BY 4.0. | |
Generic Drugs Market Analysis by Mordor Intelligence
The Generic Drugs Market size is projected to expand from USD 419.37 billion in 2025 and USD 445.32 billion in 2026 to USD 571.12 billion by 2031, registering a CAGR of 5.11% between 2026 to 2031.
This sustained expansion reflects the expiry of blockbuster patents, the negotiated price cuts mandated by the U.S. Inflation Reduction Act, and payer efforts to redirect savings toward specialty care. Patent cliffs for sitagliptin and apixaban alone unlock double-digit billions in annual branded revenue for generic substitution, while first-to-file exclusivity continues to deliver rapid volume capture. Global regulators have accelerated review timelines; the FDA’s GDUFA III staffing boost cut ANDA approval time to 10 months, encouraging earlier market entry. Complex generics and biosimilars enhance long-term value, as device patents and biologic manufacturing barriers restrict competitive entry. At the same time, supply-chain concentration in China and India creates strategic risk, prompting initiatives in the United States, Europe, and India to reshore or diversify active pharmaceutical ingredient (API) production.
Key Report Takeaways
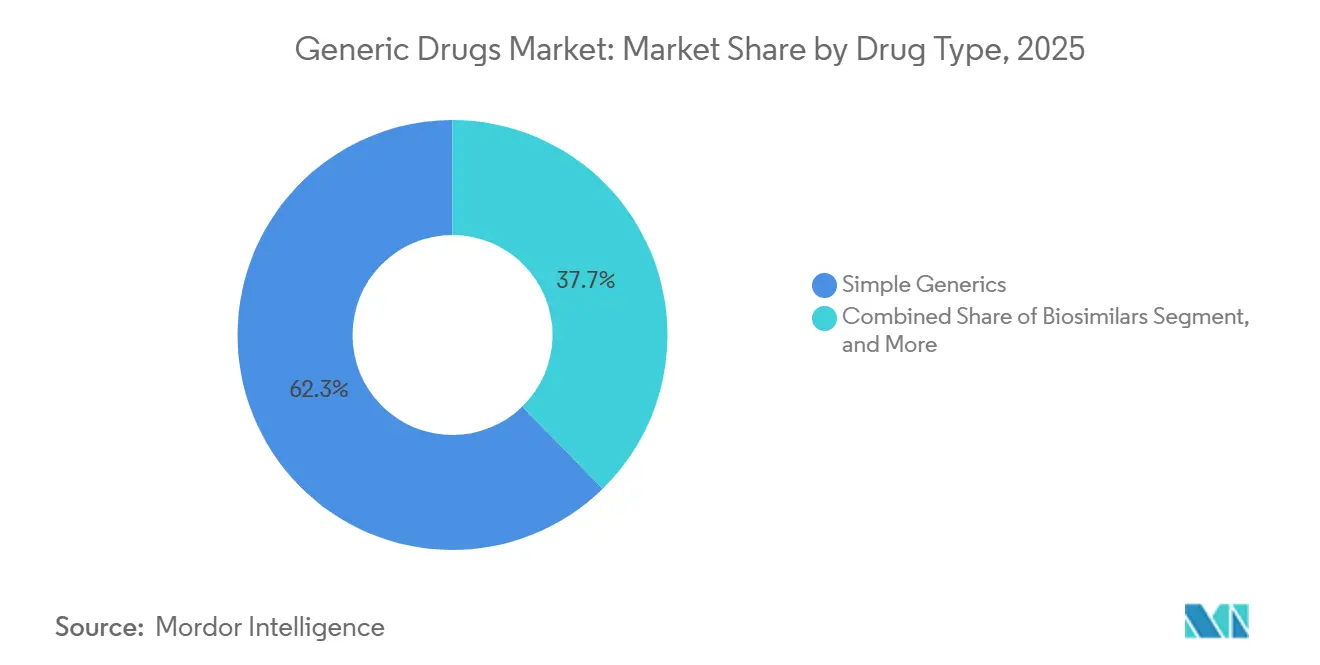
- By drug type, simple generics accounted for 62.31% of the generic drug market share in 2025, while biosimilars were projected to post the highest CAGR at 6.89% through 2031.
- By therapeutic area, cardiovascular agents led with 56.73% revenue share in 2025; oncology products are projected to advance at a 7.34% CAGR to 2031.
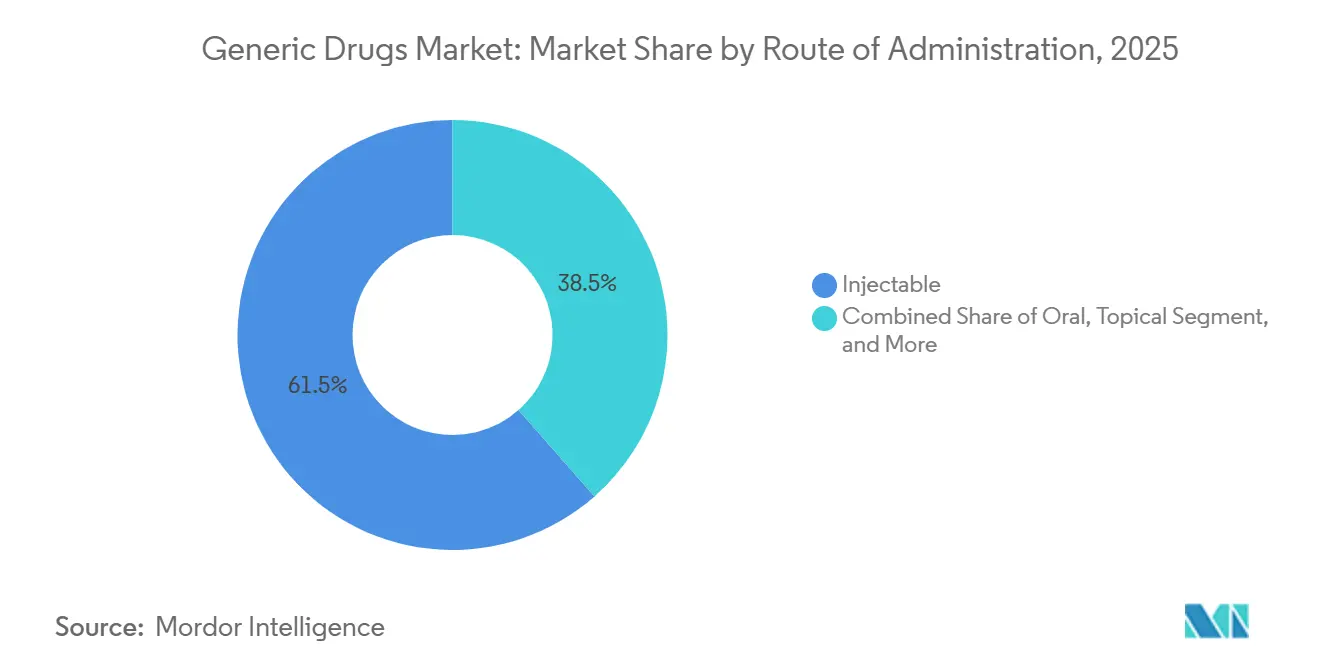
- By route of administration, injectables accounted for 61.48% share of the generic drugs market size in 2025, and inhalables are forecast to expand at a 6.02% CAGR through 2031.
- By distribution channel, hospital pharmacies held 47.16% of the generic drugs market share in 2025, while online pharmacies are projected to post an 8.89% CAGR from 2026 to 2031.
- By geography, North America led the generic drugs market in 2025, with a 42.76% market share. However, the Asia-Pacific region is expected to be the fastest-growing region, with a 7.89% CAGR from 2026 to 2031.
Note: Market size and forecast figures in this report are generated using Mordor Intelligence’s proprietary estimation framework, updated with the latest available data and insights as of January 2026.
Global Generic Drugs Market Trends and Insights
Drivers Impact Analysis*
| Driver | (~) % Impact on CAGR Forecast | Geographic Relevance | Impact Timeline |
|---|---|---|---|
| Expiry of Blockbuster Drug Patents Post-2026 | +1.2% | Global, with peak volume in North America and Europe | Medium term (2-4 years) |
| Escalating Pressure on Healthcare Budgets | +0.7% | Global, most acute in North America and Europe | Short term (≤ 2 years) |
| Favorable Government Initiatives & Reimbursement Policies | +0.9% | APAC core (India, China), spillover to emerging markets | Medium term (2-4 years) |
| Accelerated FDA ANDA Approvals Under GDUFA III | +0.8% | North America, spillover to WHO-prequalified markets | Short term (≤ 2 years) |
| Rise of Complex Generics (Drug-Device Combinations) | +0.6% | North America, Europe, Japan | Medium term (2-4 years) |
| AI-Driven Bioequivalence Modeling Shortening Development Cycles | +0.4% | Global, early adoption in North America and Europe | Long term (≥ 4 years) |
| Source: Mordor Intelligence | |||
Expiry of Blockbuster Drug Patents Post-2026
Patent expiries scheduled between 2026 and 2028 are expected to release approximately USD 40 billion in annual branded revenue to the generic drugs market.[1]Food and Drug Administration, “Generic Drug Approvals 2024,” FDA.GOV Sitagliptin, apixaban, dabigatran, and ticagrelor top the list, and first-to-file applicants can capture up to 70% of originator volume within six months. Formularies now impose 30-day substitution rules once exclusivity lapses, shrinking brand-loyalty windows. As diabetes, anticoagulation, and cardiovascular categories lose exclusivity, procurement budgets worth USD 15 billion are expected to shift to generic suppliers by 2028.
Escalating Pressure on Healthcare Budgets
The U.S. Centers for Medicare & Medicaid Services cut negotiated prices for 10 high-spend drugs by 38%–79% for 2026 implementation, reinforcing payer preference for low-cost therapies.[2]Centers for Medicare & Medicaid Services, “Drug Price Negotiation Program,” CMS.GOV European authorities maintain reference-pricing frameworks, while emerging markets extend tender cycles to secure deeper discounts. In the Asia-Pacific region, government bulk-purchase programs deliver savings exceeding 50% of pre-tender prices, redirecting funds toward hospital infrastructure upgrades. These measures decrease branded spend and allocate larger volumes to generics across high-prevalence chronic diseases.
Favorable Government Initiatives & Reimbursement Policies
India’s Production-Linked Incentive scheme earmarks USD 2 billion for API manufacturing, aiming to foster domestic self-reliance and enhance export capacity.[3]Press Information Bureau Government of India, “PLI Scheme for Pharmaceuticals,” PIB.GOV.IN China’s Marketing Authorization Holder framework separates drug ownership from manufacturing, encouraging contract production and faster generic rollout. Japan raised its substitution targets to 85% by 2025, supported by pharmacy dispensing incentives, and Australia broadened the Pharmaceutical Benefits Scheme's generic listings by 120 molecules in 2024. Collectively, these initiatives shrink approval timelines and boost penetration in price-sensitive segments.
Accelerated FDA ANDA Approvals Under GDUFA III
FDA cleared 90% of ANDAs within 10 months in fiscal 2024, up from 78% in 2022, after adding 200 reviewers and deploying real-time plant inspections. Seventy-six first generics received approval in 2024, unlocking USD 8 billion in branded sales. Tentative approvals rose to 120, positioning applicants to launch immediately upon patent expiry. Alignment between the FDA and WHO prequalification now enables GDUFA-approved products to access PEPFAR and Global Fund tenders with reduced documentation requirements, thereby extending their market reach beyond the United States.
Restraints Impact Analysis*
| Restraint | (~) % Impact on CAGR Forecast | Geographic Relevance | Impact Timeline |
|---|---|---|---|
| Severe Price Erosion from Intense Competition | -0.9% | Global, most acute in North America | Short term (≤ 2 years) |
| Supply-Chain Quality Issues & Product Recalls | -0.4% | Global, with strictest enforcement in North America and Europe | Short term (≤ 2 years) |
| API Manufacturing Concentration in Asia | -0.5% | Global, with highest vulnerability in North America and Europe | Medium term (2-4 years) |
| Nitrosamine Impurity Compliance Costs | -0.5% | Global, with strictest enforcement in North America and Europe | Medium term (2-4 years) |
| Source: Mordor Intelligence | |||
Severe Price Erosion from Intense Competition
Generic prices fall by 90% when four or more entrants launch simultaneously, a pattern observed across 200 molecules from 2020 to 2024. Medicare’s negotiated pricing is expected to accelerate similar cuts at Medicaid and commercial payers, compressing atorvastatin U.S. retail prices to USD 0.03 per tablet by 2025. Exclusivity periods cushion early entrants, but widespread competition collapses margins within six months. Firms offset pressure by pivoting toward complex generics and biosimilars; however, each candidate requires USD 10 million–USD 50 million in development expenditures, thereby heightening portfolio risk.
Nitrosamine Impurity Compliance Costs
The FDA and EMA expanded nitrosamine testing requirements in 2024 to encompass APIs, intermediates, and excipients, prompting firms to adopt liquid chromatography-mass spectrometry platforms, which can cost up to USD 500,000. Annual testing adds USD 50,000–USD 200,000 per product line and lengthens development timelines by up to one year. Between 2020 and 2024, more than 300 recalls damaged supplier reputations and prompted insurers to reassess their preferred drug lists. Smaller manufacturers struggle to absorb the cost, accelerating industry consolidation as larger players acquire distressed portfolios for scale efficiencies.
*Our forecasts treat driver/restraint impacts as directional, not additive. The impact forecasts reflect baseline growth, mix effects, and variable interactions.
Segment Analysis
By Drug Type: Biosimilars Gain Momentum While Simple Generics Dominate
Simple generics accounted for 62.31% of 2025 revenue, primarily driven by high-volume oral solids for the treatment of hypertension, diabetes, and hyperlipidemia. Biosimilars, led by eight adalimumab products capturing 45% of Humira’s U.S. volume, will expand at a 6.89% CAGR through 2031. Specialty and complex generics require USD 10 million–USD 15 million in development investment yet preserve 40%–60% of reference pricing, offering margin stability when simple-generic prices approach marginal cost.
Interchangeability designations accelerate uptake in retail settings; Cyltezo’s 2024 label expansion permits pharmacy-level substitution without prescriber intervention, driving broader access. Medicare Advantage plans now require biosimilar dispensing in 80% of eligible prescriptions, while commercial plans stand at 50% due to rebate contracts that favor reference biologics. As payers align formularies with cost-containment goals, the generic drugs market benefits from an expanding biosimilar pipeline covering autoimmune, oncology, and metabolic therapies.


By Therapeutic Area: Oncology Outpaces Cardiovascular Scale
Cardiovascular agents retained 56.73% revenue share in 2025 as decades-old statins and beta-blockers continue to serve rising chronic-disease prevalence. Oncology, however, is projected to record a 7.34% CAGR, the fastest among therapeutic categories, driven by bevacizumab, trastuzumab, and rituximab biosimilar penetration. Oncology additions strengthen the generic drugs market share in hospital formularies, where biosimilars reduce chemotherapy costs by up to USD 200,000 per patient annually.
FDA approvals for generic imatinib, erlotinib, and nilotinib in 2024 added USD 3 billion in reference-product volume to the substitution pipeline. Hospitals readily adopt oncology biosimilars that maintain infusion-center workflows and earn payer coverage. In contrast, anti-infective growth is tempered by stewardship programs, while CNS drugs trade near marginal cost, leaving minimal room for new entrants. Respiratory generics gain traction through inhalable technologies, with fluticasone-salmeterol and budesonide-formoterol inhalers projecting robust volume growth.
By Route of Administration: Injectables Scale, Inhalables Innovate
Injectables accounted for 61.48% of 2025 revenue, reflecting the hospital's reliance on parenteral antibiotics, chemotherapy, and biosimilars. The generic drugs market size for inhalables is set to expand at a 6.02% CAGR through 2031 as new dry-powder inhaler approvals overcome device-patent hurdles. Adopting proprietary inhaler designs added USD 5 million in engineering costs for fluticasone-salmeterol’s generic, yet market access rewards innovators with premium pricing and limited competition.
Oral solids remain the volume backbone, with more than 10 billion tablets annually in the United States, although sustained price erosion restricts revenue growth. Topicals occupy smaller niches where in-vivo skin-permeation studies create entry barriers that retain 20%–30% of branded pricing. Injectable biosimilars require cold-chain logistics and professional fees, contributing disproportionately to hospital pharmacy spending. The route mix highlights how oncology and immunology favor injectables, respiratory disease drives advances in inhalable products, and chronic-disease management keeps oral volume high.
By Distribution Channel: Online Pharmacies Disrupt Hospital Dominance
Hospital pharmacies held 47.16% revenue share in 2025, leveraging group purchasing contracts and the 340B program to secure discounted injectables and biosimilars. Online pharmacies, however, are projected to grow at an 8.89% CAGR on the back of telehealth integration and expanded prescription portability across 45 U.S. states. Digital fulfillment lowers patient acquisition costs and improves adherence, reducing abandonment rates to 10% versus 25% in brick-and-mortar stores.
Retail giants such as CVS and Walgreens are now integrating same-day delivery and in-store telehealth kiosks to defend their market share. Yet, occupancy costs near USD 1 million per location constrain price competitiveness. Specialty pharmacies focus on high-cost biologics, offering patient support and prior-authorization management that command double-digit margin premiums. As employers explore direct-to-patient models, the distribution landscape fragments, creating new opportunities for data-driven service differentiation in the generic drugs market.
Geography Analysis
North America secured 42.76% revenue in 2025, underpinned by Medicare Part D and Medicaid purchasing power. The FDA authorized 76 first-generation generics in 2024, releasing USD 8 billion in branded sales for substitution. Canada’s price review board trimmed ceiling prices for 15 drugs, lessening cross-border arbitrage. Mexico’s COFEPRIS cut bioequivalence review times to 10 months, strengthening regional supply. Over the forecast period, U.S. Inflation Reduction Act negotiations are expected to widen from 10 to 60 drugs, thereby magnifying payer leverage and reinforcing the adoption of generics.
The Asia-Pacific region is projected to record a 7.89% CAGR through 2031, representing the fastest regional growth in the generic drugs market. India’s USD 2 billion Production-Linked Incentive stimulates API self-reliance, while China’s consistency evaluations consolidate manufacturers around those with clinical-trial capacity. Japan lifted substitution targets to 85% by 2025, and Australia’s Pharmaceutical Benefits Scheme added 120 molecules in 2024, expanding access. These policy shifts accelerate approvals and deepen penetration across rapidly growing chronic disease segments.
Europe maintains stable growth through cost-containment tools, such as Germany’s AMNOG reference pricing and France’s biosimilar quotas, which mandate 80% substitution for adalimumab by 2025. EMA cleared 45 generics and biosimilars in 2024, including ustekinumab and bevacizumab products worth EUR 3 billion in reference sales. Middle East and Africa markets adopt the WHO prequalification to diversify procurement, while South Africa prioritized HIV and tuberculosis generics in Global Fund tenders. South America benefits from Brazil’s shortened bioequivalence timelines; however, Argentina’s macroeconomic volatility prompts local firms to fill supply gaps.
Mordor Intelligence provides coverage of the generic drugs market across other key regional markets. Detailed country-level analysis extends to India incorporating local coverage and market participation, as required.

Competitive Landscape
The generic drugs market features moderate concentration; the top ten players—Sandoz, Teva, Viatris, Sun Pharma, Aurobindo, Cipla, Dr. Reddy’s, Lupin, Fresenius Kabi, and Hikma collectively held significant share of 2025 volume. Price erosion drives portfolio shifts toward specialty products. Sun Pharma’s 2024 acquisition of Ilumya for USD 250 million signals a focus on developing differentiated therapies. Teva deployed Austedo XR in 2024, illustrating lifecycle management that offsets shrinking margins in simple generics.
Complex generics such as drug-device combinations, extended-release tablets, and inhalables require USD 10 million to USD 15 million in R&D, limiting the viability of competitors. Biosimilars demand USD 100 million–USD 250 million in investment, favoring firms with biologic expertise. Contract development and manufacturing organizations (CDMOs) provide turnkey solutions, enabling smaller firms to compete effectively without requiring full vertical integration. Digital health tools differentiate distributors; Amazon Pharmacy utilizes prescription analytics to recommend therapeutic substitutions and automate refills, resulting in a 10% reduction in abandonment rates.
Supply-chain risk shapes strategy: more than 80% of APIs originate in China and India. The proposed U.S. BIOSECURE Act could require the reshoring of sensitive compounds, prompting contingency planning among multinational companies. Ongoing nitrosamine compliance adds USD 50,000–USD 200,000 per product annually, encouraging scale economies and industry consolidation. Private-equity interest remains robust; Goldman Sachs Alternatives bought a majority stake in Synthon in December 2024, citing confidence in complex generics and oncology injectables.
Generic Drugs Industry Leaders
Teva Pharmaceutical Industries Ltd.
Viatris Inc. (Mylan-Upjohn)
Sandoz Group AG
Sun Pharmaceutical Industries Ltd.
Dr. Reddy’s Laboratories Ltd.
- *Disclaimer: Major Players sorted in no particular order

Recent Industry Developments
- February 2025: Apotex acquired U.S. rights to Provigil and Nuvigil, broadening its wakefulness portfolio and leveraging 550 SKUs across U.S. distribution channels.
- January 2025: FDA approved Celltrion’s Avtozma, a tocilizumab biosimilar that expands access for rheumatoid arthritis and COVID-19-related care.
- January 2025: Novo Nordisk petitioned the FDA for tighter oversight of compounding pharmacies producing Victoza (liraglutide), illustrating intensifying GLP-1 competition.
- January 2025: Novo Nordisk petitioned FDA for tighter oversight of compounded liraglutide, reflecting heightened competition in GLP-1 therapies.
- December 2024: Goldman Sachs Alternatives took a majority stake in Synthon, underscoring private-equity appetite for complex generics and oncology injectables


Research Methodology Framework and Report Scope
Market Definitions and Key Coverage
Our study defines the generic drugs market as the worldwide sales of prescription medicines that contain the same active pharmaceutical ingredient, dosage form, strength, and route of administration as an originator product once patent or data exclusivity ends. Products counted include simple oral solids, specialty and complex generics, and approved biosimilars supplied through retail, hospital, and alternate pharmacy channels.
Scope Exclusions: Repurposed brands sold at originator prices and over-the-counter switch products are not included.
Segmentation Overview
- By Drug Type
- Simple Generics
- Specialty Generics
- Biosimilars
- Complex Generics
- By Therapeutic Area
- Cardiovascular
- Oncology
- Anti-Infective
- Central Nervous System
- Endocrine/Metabolic
- Respiratory
- Others
- By Route of Administration
- Oral
- Injectable
- Topical
- Inhalable
- Other Route of Administration
- By Distribution Channel
- Retail Pharmacies
- Hospital Pharmacies
- Online Pharmacies
- Other Distribution Channel
- By Geography
- North America
- United States
- Canada
- Mexico
- Europe
- Germany
- United Kingdom
- France
- Italy
- Spain
- Rest of Europe
- Asia-Pacific
- China
- Japan
- India
- Australia
- South Korea
- Rest of Asia-Pacific
- Middle East & Africa
- GCC
- South Africa
- Rest of Middle East & Africa
- South America
- Brazil
- Argentina
- Rest of South America
- North America
Detailed Research Methodology and Data Validation
Primary Research
Discussions with pharmacoeconomists, hospital procurement heads, wholesaler buyers, and ex-regulators across North America, Europe, Asia-Pacific, and key pharmerging markets allowed Mordor analysts to validate price-erosion curves, channel margins, and biosimilar uptake lags that secondary data could not fully explain. Insights from these interviews fed directly into assumption fine-tuning.
Desk Research
Analysts first mapped the market universe using freely available regulators' databases such as the FDA Orange Book, EMA Community Register, CDSCO list of approved ANDAs, and WTO patent expiries, which helped clarify the number of off-patent molecules and timing of loss of exclusivity. We enriched this with macro health indicators from WHO, OECD Health Statistics, and UN demographics to size patient demand pools. We then referred to annual reports, 10-Ks, and investor decks of leading generic manufacturers for typical average selling prices. Subscription inputs from D&B Hoovers and Dow Jones Factiva provided hard revenue splits that grounded early estimates. The sources cited above are illustrative; many additional open and paid references aided data checks and narrative support.
Market-Sizing & Forecasting
A top-down model rebuilt global generic spending by applying molecule-level patent expiry schedules to branded drug sales, adjusting for typical penetration and price-decline patterns, and then allocating by therapy, route, and region. Supplier roll-ups of sampled ASP × volume and wholesaler channel checks acted as selective bottom-up cross-tests that kept totals realistic. Key variables tracked include the number of molecules losing exclusivity each year, weighted average price erosion, biosimilar launch count, chronic disease prevalence, and insurer cost-containment policies. Forecasts employ multivariate regression that links spending to those drivers while letting analysts test conservative, base, and optimistic scenarios. Gaps in bottom-up data were bridged with triangulated averages from comparable markets before final alignment.
Data Validation & Update Cycle
Outputs pass three rounds: automated variance scans, peer review, and senior analyst sign-off. Figures are refreshed annually, with interim revisions triggered by major patent or policy events, ensuring clients receive the most current view.
Why Mordor's Generic Drugs Baseline Inspires Confidence
Published estimates diverge because firms pick different product mixes, base years, and price-erosion curves.
Key gap drivers include varying treatment of biosimilars, inclusion of OTC generics, currency conversion dates, and refresh cadence. Mordor's disciplined scope selection, annual update cycle, and dual-approach modeling reduce these variances and yield a balanced midpoint that decision-makers can trust.
Benchmark comparison
| Market Size | Anonymized source | Primary gap driver |
|---|---|---|
| USD 431.1 B (2025) | Mordor Intelligence | - |
| USD 361.7 B (2022) | Global Consultancy A | Older base year and excludes biosimilars |
| USD 445.6 B (2024) | Regional Consultancy B | Limited to top 20 countries; infrequent refresh |
| USD 515.1 B (2025) | Trade Journal C | Adds OTC and branded generics; applies aggressive ASP inflation |
In sum, the side-by-side view shows that while other publishers swing high or low based on scope or price assumptions, Mordor Intelligence delivers a transparent, reproducible baseline anchored to clear variables, timely data, and multi-layer validation, giving stakeholders a dependable starting point for strategy and investment decisions.


Key Questions Answered in the Report
How big is the generic drugs market in 2026?
The generic drugs market size reaches USD 445.23 billion in 2026.
What is the projected CAGR for generic drugs from 2026 to 2031?
The market is forecast to grow at a 5.11% CAGR over the period.
Which therapeutic area grows the fastest?
Oncology products record the highest CAGR at 7.34% through 2031.
Why are online pharmacies gaining share?
Telehealth integration and lower fulfillment costs drive an 8.89% CAGR for online channels.
Which region is expanding quickest?
Asia-Pacific posts the fastest growth at 7.89% CAGR, fueled by policy incentives and manufacturing expansion.
Page last updated on:


