
Bone Cancer Treatment Market Size and Share
Market Overview
| Study Period | 2020 - 2031 |
|---|---|
| Market Size (2026) | USD 1.34 Billion |
| Market Size (2031) | USD 1.71 Billion |
| Growth Rate (2026 - 2031) | 4.92 % |
| Fastest Growing Market | Asia Pacific |
| Largest Market | North America |
| Market Concentration | Medium |
Major Players *Disclaimer: Major Players sorted in no particular order Image © Mordor Intelligence. Reuse requires attribution under CC BY 4.0. | |
Bone Cancer Treatment Market Analysis by Mordor Intelligence
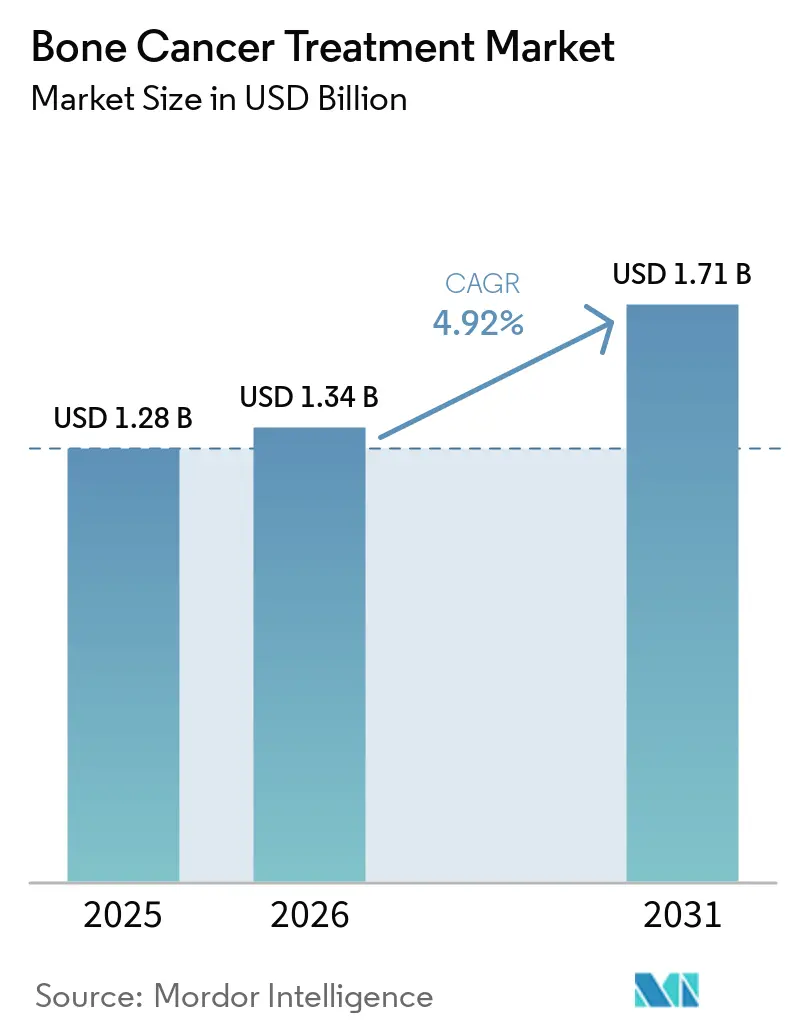
Bone Cancer Treatment market size in 2026 is estimated at USD 1.34 billion, growing from 2025 value of USD 1.28 billion with 2031 projections showing USD 1.71 billion, growing at 4.92% CAGR over 2026-2031.
Demand is expanding on the back of breakthrough regulatory approvals, wider adoption of 3D-printed implants, and steady diffusion of targeted biologics. The market’s growth is further sustained by earlier diagnosis through AI-enabled imaging, wider reimbursement for orphan drugs, and improved clinical outcomes delivered by limb-salvage procedures. North America holds structural advantages in R&D and reimbursement, while Asia-Pacific is adding capacity rapidly as disease-awareness programmes scale. Competition is intensifying as niche biotechnology firms win fast-track approvals, forcing incumbents to recalibrate portfolios toward precision-medicine assets. High treatment costs and limited physician capacity in low-resource settings remain the main countervailing forces.
Key Report Takeaways
- By bone cancer type, primary malignancies commanded 76.45% of bone cancer treatment market share in 2025, while Ewing sarcoma recorded the highest projected CAGR at 8.74% through 2031.
- By therapy type, chemotherapy led with a 32.35% share of the bone cancer treatment market size in 2025; cell and gene therapies are projected to advance at a 6.52% CAGR to 2031.
- By age group, adolescents and young adults held 41.88% revenue share in 2025, whereas paediatric cases are forecast to expand at a 5.62% CAGR to 2031.
- By end user, hospitals dominated with 38.55% of bone cancer treatment market share in 2025; specialty cancer centres show the fastest growth trajectory at an 7.56% CAGR through 2031.
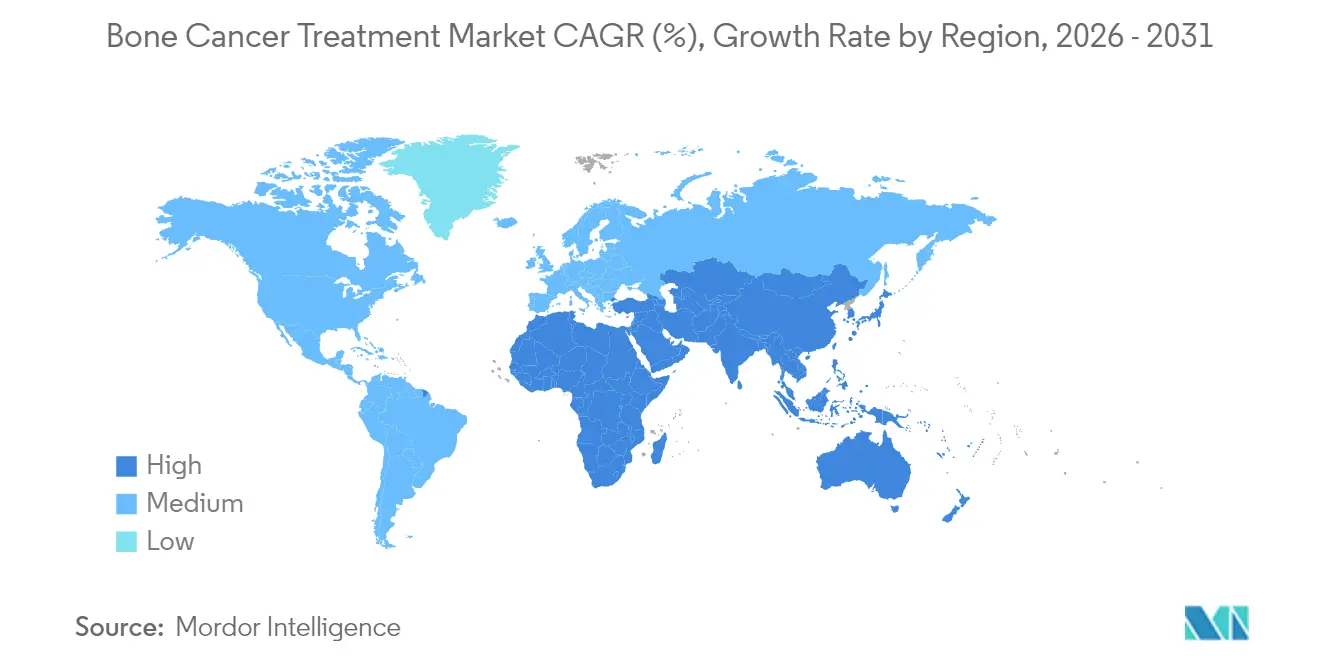
- By geography, North America retained 45.20% of the bone cancer treatment market in 2025; Asia-Pacific is set to post the strongest regional CAGR at 6.79% over the forecast horizon.
Note: Market size and forecast figures in this report are generated using Mordor Intelligence’s proprietary estimation framework, updated with the latest available data and insights as of 2026.
Market Trends and Insights
Drivers Impact Analysis of Bone Cancer Treatment Market*
| Driver | (~) % Impact on CAGR Forecast | Geographic Relevance | Impact Timeline |
|---|---|---|---|
| Rising incidence of primary bone sarcomas | +1.2% | Global; earliest up-lift in North America and Europe | Medium term (2-4 years) |
| Approvals and pipeline momentum of targeted biologics | +1.8% | North America and EU core; roll-out to Asia-Pacific | Short term (≤ 2 years) |
| Government and NGO-led sarcoma awareness programmes | +0.8% | Global, with concentrated impact in emerging markets | Long term (≥ 4 years) |
| AI-driven functional imaging enabling earlier detection | +1.1% | North America and EU; technology transfer to Asia-Pacific | Medium term (2-4 years) |
| 3D-printed patient-specific implants | +0.7% | North America and Europe; step-wise adoption in Asia-Pacific | Medium term (2-4 years) |
| Orphan-drug exclusivity and tax incentives | +1.3% | Global; strongest in North America and EU | Long term (≥ 4 years) |
| Source: Mordor Intelligence | |||
Increasing Global Incidence of Primary Bone Sarcomas
Osteosarcoma continues to be the most common primary bone malignancy among children and adolescents, and epidemiological data confirm a sustained rise in Ewing sarcoma cases in major economies. A national burden study in China reported higher incidence, prevalence and disability-adjusted life-years, with projections indicating continued growth to 2036. Larger patient pools are prompting governments to expand orthopaedic oncology capacity and are attracting venture funding for paediatric-focused therapies. Diagnostic improvements, such as nationwide MRI screening pilots, are capturing earlier-stage presentations and fuelling demand for limb-preserving procedures.
Approvals & Pipeline Momentum of Targeted Biologics
Regulatory agencies accelerated the pace of approvals in 2024-2025. The United States Food and Drug Administration cleared afamitresgene autoleucel, the first gene therapy for synovial sarcoma, after the product delivered a 43.2% overall response in heavily pre-treated patients.[1]FDA, “Vimseltinib: Medical Review,” fda.gov In February 2025 the agency also approved vimseltinib for tenosynovial giant cell tumour, with a 40% objective response versus placebo in the pivotal MOTION trial. Breakthrough therapy designations for additional programmes, including GSK5764227 in relapsed osteosarcoma, validate targeted approaches and shorten development cycles. Collectively, these milestones are expanding clinical protocols and hastening payor adoption across mature markets.
Government & NGO-Led Sarcoma Awareness Programmes
July’s designation as Sarcoma and Bone Cancer Awareness Month anchors multi-channel campaigns that disseminate early-diagnosis checklists to general practitioners worldwide. Collaborations between the Sarcoma Foundation of America and hospital networks distribute free accredited webinars and update referral algorithms. In Europe, six countries have adopted a harmonised checklist requiring referral to specialised centres within two weeks of suspected diagnosis, cutting diagnostic delays and boosting trial enrolment.[2]European Sarcoma Patient Coalition, “Sarcoma Checklist Initiative,” bmccancer.biomedcentral.com Similar NGO-led initiatives are being localised in Latin America and Southeast Asia, driving earlier presentations and widening the treatment funnel.
Advances in Functional Imaging & AI Diagnostics
Machine-learning models trained on radiomics features now classify bone tumours with accuracy rivalling expert radiologists, reducing unnecessary biopsies and enabling earlier onset of curative regimens.[3]Liu Y. et al., “Deep-Learning Classification of Bone Tumours,” EBioMedicine, thelancet.com Deep-learning-assisted PET-CT quantification allows for precise mapping of tumour margins, which in turn optimises intraoperative resections. AI platforms integrated into interventional suites guide needle placement with sub-millimetre precision, improving sample adequacy and reducing complication rates. Large language models with image-analysis capability are undergoing clinical validation to triage suspicious lesions in primary care settings, promising further reductions in time-to-treatment.
Restraints Impact Analysis of Bone Cancer Treatment Market*
| Restraint | (~) % Impact on CAGR Forecast | Geographic Relevance | Impact Timeline |
|---|---|---|---|
| Limited options for metastatic or refractory tumours | -1.5% | Global; most acute in emerging markets | Long term (≥ 4 years) |
| High cost of novel biologics and cell therapies | -2.1% | Worldwide; severe constraints in low- and middle-income countries | Medium term (2-4 years) |
| Post-operative morbidity and lengthy rehabilitation | -0.9% | Global; amplified in resource-constrained settings | Medium term (2-4 years) |
| Shortage of specialised orthopaedic oncologists | -1.2% | Asia-Pacific and Africa | Long term (≥ 4 years) |
| Source: Mordor Intelligence | |||
Limited Therapeutic Options for Metastatic or Refractory Tumours
Five-year survival drops below 30% for metastatic osteosarcoma, underscoring the inadequacy of current regimens. The immunosuppressive bone micro-environment blunts checkpoint inhibitor efficacy, while dose-limiting toxicities cap the gains from intensified chemotherapy. Investigational adoptive cell transfers, such as HER2-targeted T-cells, are showing early promise but remain confined to small cohorts. Real-world data from tertiary centres in India and Brazil illustrate that less than 15% of refractory cases gain access to clinical trials, perpetuating poor outcomes.
High Cost of Novel Biologics & Cell Therapies Limiting Access
Median out-of-pocket spending for standard adjuvant chemotherapy already exceeds local per-capita income in many low-resource settings. A recent Indian cohort study recorded average annual treatment costs of USD 4,171, with 80.4% of households experiencing catastrophic health expenditure. Even in OECD nations, insurer copayments for off-label targeted agents can exceed USD 20,000 annually. Cost-sharing mechanisms, tiered pricing and local manufacturing partnerships are only gradually alleviating the affordability gap.
*Our forecasts treat driver/restraint impacts as directional, not additive. The impact forecasts reflect baseline growth, mix effects, and variable interactions.
Bone Cancer Treatment Market Segment Analysis
By Bone Cancer Type:
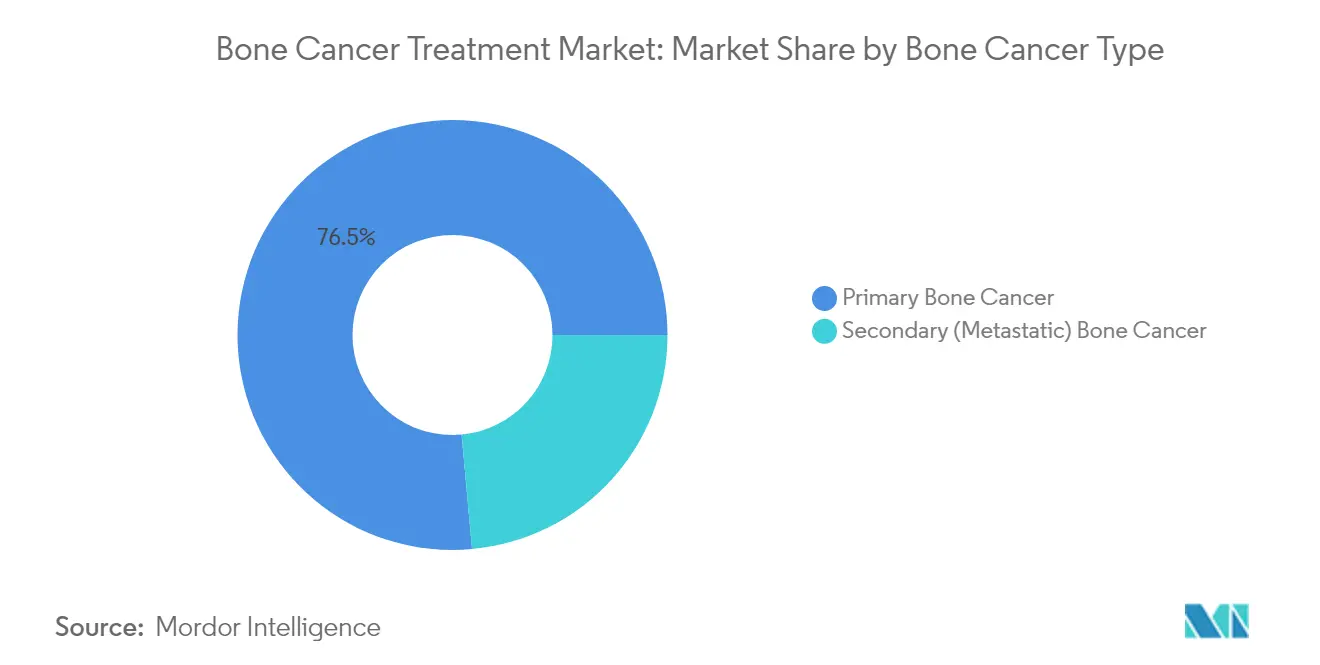
Primary Dominance Drives InnovationPrimary malignancies accounted for 76.45% of bone cancer treatment market share in 2025, reflecting entrenched clinical pathways and high incidence among paediatric and adolescent populations. Osteosarcoma remains the prototypical diagnosis and anchors first-line MAP (methotrexate, doxorubicin, cisplatin) protocols. The segment’s scale is drawing disproportionate R&D attention, from RUNX2-inhibiting small molecules to GD2-directed antibody-drug conjugates that cut pulmonary metastasis in preclinical models. Ewing sarcoma is positioned as the fastest-growing niche, registering a projected 8.74% CAGR to 2031 as adoptive gene therapies enter commercialisation. Meanwhile, chondrosarcoma growth is supported by PD-1/PD-L1 checkpoint regimens demonstrating partial responses in early-phase trials.
Therapeutic innovation is narrowing historical survival gaps. A UK-based programme achieved a 50% survival improvement in murine osteosarcoma by blocking RUNX2 transcription now entering human toxicology studies. At the same time, radiopharmaceutical conjugates for metastatic lesions are moving through Chinese and European regulatory channels, broadening indications beyond primary tumours. Collectively, these pipelines are expected to expand the bone cancer treatment market size across each histology subtype.



By Therapy Type:
Chemotherapy Leadership Amid Emerging DisruptionConventional cytotoxic regimens accounted for 32.35% of the bone cancer treatment market in 2025 and remain first-line therapy for most high-grade sarcomas. However, adverse-event profiles and plateauing survival are catalysing a pivot toward precision approaches. Cell and gene therapies are forecast to expand at a 6.52% CAGR as regulatory precedents lower the bar for additional approvals. CAR-T constructs targeting B7-H3 and GD2 are in multi-centre phase II trials, while allogeneic NK-cell platforms seek to combat the immunosuppressive tumour milieu.
Targeted small-molecule inhibitors, including multi-kinase agents, are gaining off-label traction after demonstrating progression-free benefits in compassionate-use registries. Denosumab’s head-to-head superiority over zoledronic acid in preventing skeletal-related events has cemented RANKL blockade as standard adjunct therapy. Concurrently, 3D-printed implant technology and gallium-doped bioactive glass inserts are redefining local control strategies, raising expectations for limb-salvage uptake.
By Age Group:
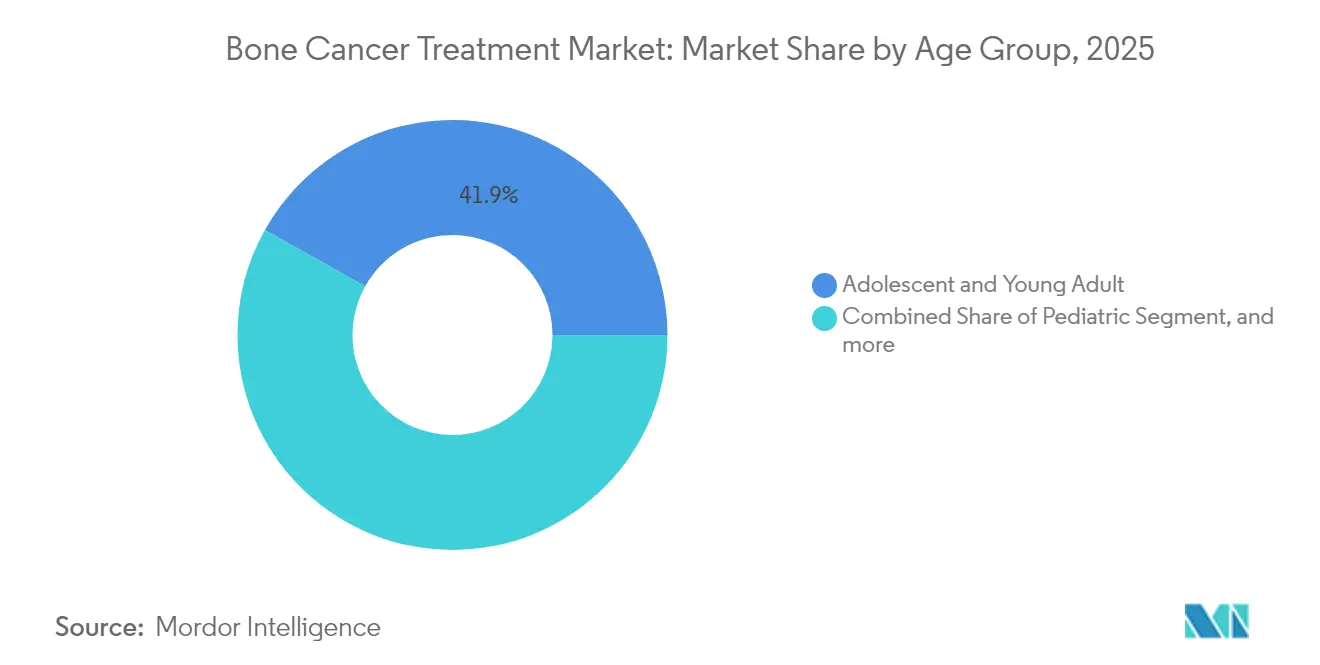
Adolescent Concentration Drives Specialised CareAdolescents and young adults represented 41.88% of bone cancer treatment market revenue in 2025, mirroring epidemiologic clustering of high-grade primary sarcomas. Treatment protocols in this cohort must reconcile growth-plate biology with aggressive tumour kinetics, prompting limb-preserving grafts such as vascularised physeal transfers. Paediatric cases are projected to post a 5.62% CAGR through 2031 as earlier imaging and centralised referral pathways bring more children into curative windows.
Adult and geriatric segments are benefiting from advances in managing bone metastasis originating from prostate or breast primaries. Bisphosphonate-sparring regimens and targeted radioligand therapies are extending functional life expectancy, though comorbidities constrain aggressive surgical interventions. Survivorship programmes are maturing to encompass fertility preservation and psychosocial support across the lifespan.
By End User:
Hospital Dominance with Specialty-Centre SurgeGeneral hospitals held 38.55% of bone cancer treatment market share in 2025 thanks to integrated oncology-surgery-radiology workflows. Yet specialty cancer centres are growing at an 7.56% CAGR, underpinned by complex cases that demand high-volume surgical expertise and onsite additive-manufacturing facilities for custom implants. Academic medical centres double as clinical-trial hubs, funnelling patients into experimental cell-therapy programmes and imaging-AI validation studies.
Ambulatory surgical centres are progressively handling biopsy and post-operative rehabilitation but remain minor revenue contributors. Tele-oncology follow-ups are being bundled with in-person limb-function assessments, improving rural access without cannibalising inpatient revenue streams. The evolving provider mix is expected to tilt the bone cancer treatment market toward concentrated, high-specialisation care models.
Geography Analysis
North America Bone Cancer Treatment Market
North America retained a 45.20% hold on the bone cancer treatment market in 2025, propelled by the United States’ early-access framework for orphan drugs and mature reimbursement for 3D-printed implants. Federal funding for paediatric sarcoma consortia keeps trial density high, and widespread adoption of AI-augmented imaging is eliminating diagnostic delays. Canada’s universal coverage further broadens biologic uptake, offsetting higher per-patient costs.
Europe Bone Cancer Treatment Market
Europe follows with cohesive sarcoma-care pathways that require referral to designated centres within two weeks. The region’s established limb-salvage culture and the European Medicines Agency’s ten-year exclusivity bolster innovation. Nevertheless, divergent reimbursement policies across member states temper uniform adoption of high-cost cell therapies. Germany retains leadership in additive-manufacturing deployments, while Italy is piloting national genomic screening for bone sarcomas.
APAC Bone Cancer Treatment Market
Asia-Pacific is the fastest-growing bloc, forecast at a 6.79% CAGR as China, Japan and India expand orthopaedic oncology capacity. China’s National Medical Products Administration cleared a radionuclide-drug conjugate for bone metastases in 2025, positioning domestic companies as regional leaders. Japan’s focus on high-dose chemotherapy and autologous marrow rescue continues to yield incremental survival gains. India’s challenge remains late presentation and limited specialist coverage, but locally fabricated modular prostheses and tier-two city treatment programmes are improving disease-free survival to 61% in selected centres.
LATAM and Africa Bone Cancer Treatment Market
Latin America and Africa lag behind due to fragmented reimbursement and clinician shortages. Nonetheless, multinational NGOs are increasing training fellowships and funding limb-salvage initiatives that are expected to seed regional centres of excellence within the next decade.

Competitive Landscape
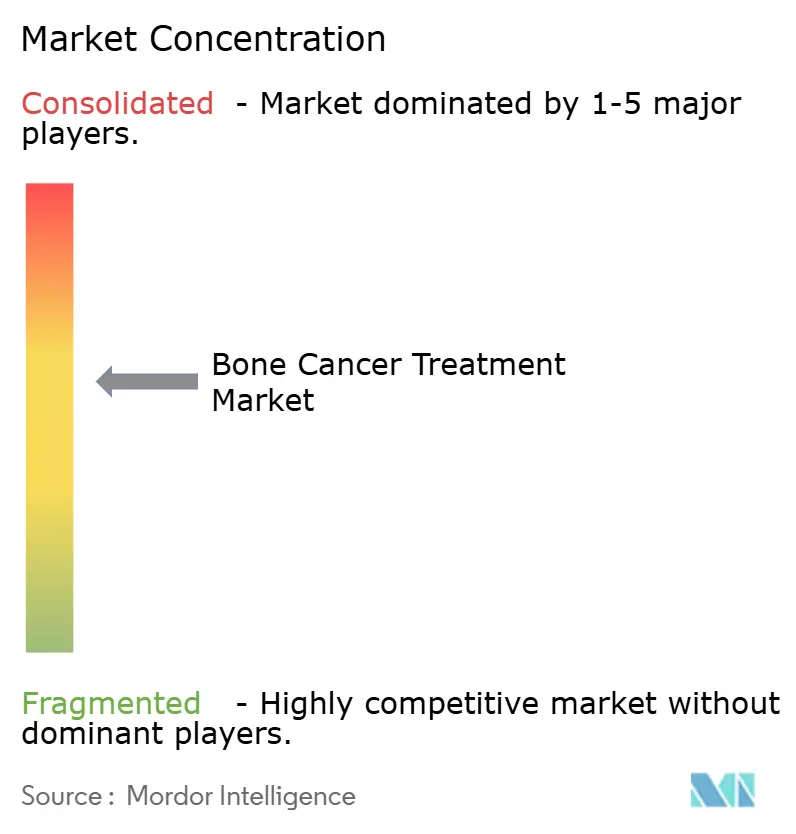
The bone cancer treatment market is moderately concentrated. Top pharmaceutical and med-tech players are consolidating biologic pipelines through acquisitions, while venture-backed start-ups capture orphan indications with nimble R&D models. Amgen’s denosumab maintains entrenched leadership for skeletal-event prophylaxis, but smaller firms such as Adaptimmune and Deciphera have vaulted into prominence with recent FDA approvals for gene and kinase-targeted therapies.
Technology integration is becoming a differentiator: orthopaedic-implant manufacturers are partnering with AI-software vendors to create closed-loop planning-to-print systems that cut lead times by 40%. Cross-licensing agreements between imaging-AI firms and hospital networks are expanding data pools, facilitating algorithm validation and accelerating time-to-market. Academic spin-offs, notably from UK and US universities, are commercialising RUNX2 inhibitors and bioactive glass scaffolds, promising highly differential efficacy.
Price pressures are prompting tiered-pricing strategies and local manufacturing joint ventures to secure emerging-market penetration. Meanwhile, global players are experimenting with outcomes-based reimbursement for high-cost cell therapies, aiming to reduce payer push-back and solidify formulary positioning.
Bone Cancer Treatment Industry Leaders
Bayer AG
Pfizer Inc.
Amgen Inc.
Novartis AG
Johnson & Johnson (Janssen)
- *Disclaimer: Major Players sorted in no particular order
Bone Cancer Treatment Market Companies Covered in this Report
- Amgen
- Bayer
- Novartis
- Johnson & Johnson
- Pfizer
- Takeda Pharmaceuticals
- Eli Lilly and Company
- Hikma Pharmaceuticals
- Recordati S.p.A
- Spectrum Pharmaceuticals
- Debiopharm Group
- Atlanthera
- Adaptimmune Therapeutics plc
- Daiichi Sankyo
- Roche
- Ipsen
- OncoTherapy Science Inc.
- Legend Biotech
- Merck
- Gilead Sciences

Market Opportunities and Future Outlook
A key commercialization whitespace in bone cancer treatment lies in systemic options for histologies with limited approved therapies, particularly conventional chondrosarcoma and relapsed or refractory osteosarcoma. In June 2026, the U.S. FDA accepted the BLA for Inhibrx's ozekibart (INBRX-109) in unresectable or metastatic conventional chondrosarcoma, which points to continued label-bearing targeted biologics in rare bone malignancies and creates a more defined path for companion diagnostics and specialist-center adoption. At the same time, early-stage immunotherapy programs are expanding in osteosarcoma, including CAR-T approaches such as the FIERCe trial (NCT07227571) initiated by Fred Hutchinson Cancer Center for advanced refractory or recurrent or progressive disease.
Cost and access optimization is another area where momentum is building around established bone-targeted agents used to prevent skeletal-related events in cancer care, since biosimilar competition is reshaping procurement and formulary dynamics. The FDA approvals of interchangeable denosumab biosimilars (referencing Prolia and XGEVA) in 2025 support broader payer-driven substitution, allowing hospitals and specialty cancer centers to reallocate budgets toward high-cost precision therapies and supportive technologies, including AI-enabled imaging workflows and patient-specific limb-salvage implants. With osteosarcoma development still heavily concentrated in phase I/II trials, international trial-network expansion and pragmatic studies in higher-burden regions, particularly in Asia-Pacific where capacity additions and local oncology manufacturing are accelerating, offer a direct route to narrow evidence gaps and standardize modern protocols beyond a small number of high-volume centers.
Recent Industry Developments in Bone Cancer Treatment Market
- June 2026: Inhibrx announced U.S. FDA acceptance of its BLA for ozekibart (INBRX-109) in unresectable or metastatic conventional chondrosarcoma. The filing advances one of the more prominent late-stage targeted-biologic efforts in a bone sarcoma subtype with limited systemic options and reinforces precision-oncology R&D momentum in rare bone cancers.
- December 2025: Amneal Pharmaceuticals and mAbxience reported FDA approval of Oziltus (denosumab-mobz), a biosimilar referencing XGEVA. The approval broadened competitive pressure in bone-modifying supportive care, giving health systems additional levers for tendering and pathway standardization alongside branded denosumab.
- February 2025: Samsung Bioepis announced FDA approval of XBRYK (denosumab-dssb), a biosimilar referencing Prolia and XGEVA. The earlier entrant helped drive a wave of denosumab biosimilar availability, shaping pricing and access conditions for managing cancer-related bone complications across hospital and specialty-center settings.


Bone Cancer Treatment Market Report Scope and Research Methodology
Market Definition and Coverage
This market covers the value of medical and procedural care used to treat bone cancer, including drug therapies and hospital based interventions provided to patients diagnosed with primary or secondary bone tumors.
Scope exclusions: Non-cancer bone diseases and bone pain management that is not linked to a confirmed bone cancer diagnosis are excluded.
Segments Covered in This Report
- By Bone Cancer Type
- Primary Bone Cancer
- Osteosarcoma
- Chondrosarcoma
- Ewing Sarcoma
- Other Primary Types
- Secondary (Metastatic) Bone Cancer
- Primary Bone Cancer
- By Therapy Type
- Chemotherapy
- Anthracyclines
- Alkylating Agents
- Antimetabolites & Others
- Targeted Therapy
- RANKL Inhibitors
- Tyrosine Kinase Inhibitors
- mTOR/MEK & Emerging Targets
- Immunotherapy
- Immune Check-point Inhibitors
- Cell & Gene Therapies
- Radiation Therapy
- Surgery & Limb-Salvage Procedures
- Others
- Chemotherapy
- By Age Group
- Pediatric
- Adolescent & Young Adult
- Adult
- Geriatric
- By End User
- Hospitals
- Specialty Cancer Centres & Orthopaedic Institutes
- Academic & Research Institutes
- Ambulatory Surgical Centres
- By Geography
- North America
- United States
- Canada
- Mexico
- Europe
- Germany
- United Kingdom
- France
- Italy
- Spain
- Rest of Europe
- Asia-Pacific
- China
- Japan
- India
- Australia
- South Korea
- Rest of Asia-Pacific
- Middle East & Africa
- GCC
- South Africa
- Rest of Middle East & Africa
- South America
- Brazil
- Argentina
- Rest of South America
- North America
Data Sources, Market Sizing, and Validation
Desk Research
Desk research was used to set the clinical and demand context first, so later assumptions could be kept realistic. We reviewed public disease and treatment references such as the National Cancer Institute, World Health Organization cancer statistics, International Agency for Research on Cancer (GLOBOCAN), and country level health ministry publications for incidence, diagnosis patterns, and care pathways.
On the market side, pricing and access signals were checked using sources such as U.S. FDA drug labels and approvals, clinical trial registries, peer reviewed oncology journals, and reimbursed care references published by public payers where available. Company filings, investor presentations, and reputable press coverage were used to understand pipeline timing and commercialization plans, and paid subscriptions focused on company financials, news and financials, and patent databases were referenced selectively to validate timelines and ownership. The desk sources listed here are illustrative, and many other public sources were also used to collect, cross-check, and clarify data points.
Primary Interviews and Surveys
Primary work was used to pressure test the desk assumptions that tend to move the totals, especially treatment mix, lines of therapy, and typical care settings for primary versus metastatic cases. We spoke with a mix of clinicians, hospital pharmacists, procurement teams, and industry participants across major regions so gaps around uptake, access delays, and price realization could be filled in before finalizing the model.
Distribution of primary research fieldwork respondents
| Company type | Respondent position | Region |
|---|---|---|
| Top tier: 34% | CXOs: 19% | APAC: 52% |
| Mid tier: 47% | Functional/Unit leaders: 28% | EMEA: 30% |
| Smaller Players: 19% | Managers: 53% | Americas: 18% |
Market-Sizing & Forecasting
Sizing started with a top-down build where incidence and diagnosis rates were used to reconstruct the treatable patient pool, which was then split by primary versus secondary disease and mapped to common treatment pathways. From there, therapy adoption shares were applied across chemotherapy, targeted therapy, radiation therapy, and surgery, and the value was computed using typical course level cost ranges and setting of care effects.
To keep results grounded, selective bottom-up checks were run using supplier and channel feedback, plus sampled price per regimen multiplied by expected treated volumes in key countries, and then adjusted when the implied utilization looked out of line. The main inputs that moved the model included osteosarcoma and Ewing sarcoma diagnosis volumes, metastatic bone involvement rates, surgery and radiotherapy utilization by stage, drug uptake speed after approvals, and regional pricing differences driven by reimbursement and tender dynamics.
For forecasting, scenario analysis was applied around a base case adoption curve, because new indications, label expansions, and access timing can change year to year. Assumptions on incidence growth, treatment penetration, and price erosion were aligned to the ranges repeatedly observed in expert feedback, and missing country data points were bridged using proxy markets with similar care infrastructure and oncology spend profiles.
Data Validation & Update Cycle
Outputs were validated through triangulation across patient pool math, therapy mix logic, and independent signals such as procedure volumes and public oncology spending trends, and then reviewed again for any country outliers. When a variance was found, the underlying driver was traced back to the specific input (for example, uptake, pricing, or metastatic share) and respondents were re-contacted when the gap could not be explained from public evidence.
Before sign-off, the model and write-up go through multiple analyst review steps so definitions, conversions, and year alignment are consistent. The report is refreshed annually, and interim checks are performed when there are material events such as approvals, safety actions, or reimbursement changes, followed by a final pre-delivery pass so clients receive the latest updated view.
Mordor Intelligence's Bone Cancer Treatment Market Size Compared With Other Published Estimates
Published market sizes for bone cancer treatment often do not match because firms do not count the same patient groups, care settings, or therapy components in the value. Differences also come from how pricing is normalized across regions, how fast pipeline therapies are assumed to ramp, and whether the base year is aligned to a full calendar year.
Supportive bone care drugs and skeletal related event prevention therapies are kept outside Mordor Intelligence's scope here, which is one reason the baseline differs from some broader oncology treatment totals. Other estimates can also shift upward when they use aggressive uptake curves for newer targeted options, or when they apply a single global price assumption instead of region specific realized pricing and reimbursement timing.
Benchmark comparison
| Source | Market Size | Gaps in Research Methodology |
|---|---|---|
| Mordor Intelligence | USD 1.34 B (2026) | |
| Global Consultancy A | USD 1.31 B (2025) | Uses an earlier base year and a longer horizon, and it appears to fold some advanced disease complication related therapies into the treatment basket, which increases comparability gaps versus a tumor treatment only view. |
| Industry Publisher B | USD 1.18 B (2021) | Relies on an older base year, and the split is heavily channel and drug type driven, which can understate procedure intensive care components when costs are not rebuilt from care pathway utilization. |
The spread in reported values is largely explained by base year timing and what gets counted as treatment versus supportive care, followed by differences in regional price realization. By keeping the patient pool and therapy mix steps visible, and then checking totals against practical utilization signals, the estimate stays traceable and repeatable for planning use.


Key Questions Answered in the Report
What is the current size of the bone cancer treatment market?
The bone cancer treatment market size reached USD 1.34 billion in 2026 and is projected to climb to USD 1.71 billion by 2031.
Which therapy type segment is growing the fastest?
Cell and gene therapies are the fastest-growing segment, expanding at a 6.52% CAGR as regulatory approvals for targeted and gene-edited modalities accelerate.
Why is Asia-Pacific considered the high-growth region?
Asia-Pacific benefits from expanding healthcare access, rising sarcoma awareness, and local approvals of radionuclide-drug conjugates, driving a 6.79% regional CAGR.
How are 3D-printed implants influencing treatment outcomes?
Patient-specific 3D-printed implants improve limb-salvage rates to above 90%, shorten theatre times and deliver higher functional scores post-surgery.
What limits broader access to advanced therapies?
High costs and inadequate reimbursement structures, especially in low- and middle-income countries, restrict uptake of novel biologics and cell therapies despite strong clinical efficacy.
Which age group represents the largest demand share?
Adolescents and young adults accounted for 41.88% of market revenue in 2025, reflecting the epidemiologic concentration of primary bone sarcomas in this cohort.
Page last updated on:


 Your data is secure and never sold or shared.


