
Oil And Gas Separator Market Size and Share
Market Overview
| Study Period | 2021 - 2031 |
|---|---|
| Market Size (2026) | USD 5.53 Billion |
| Market Size (2031) | USD 6.47 Billion |
| Growth Rate (2026 - 2031) | 3.18 % |
| Fastest Growing Market | Asia-Pacific |
| Largest Market | Middle-East and Africa |
| Market Concentration | Medium |
Major Players
*Disclaimer: Major Players sorted in no particular order Image © Mordor Intelligence. Reuse requires attribution under CC BY 4.0. |
|
Oil And Gas Separator Market Analysis by Mordor Intelligence
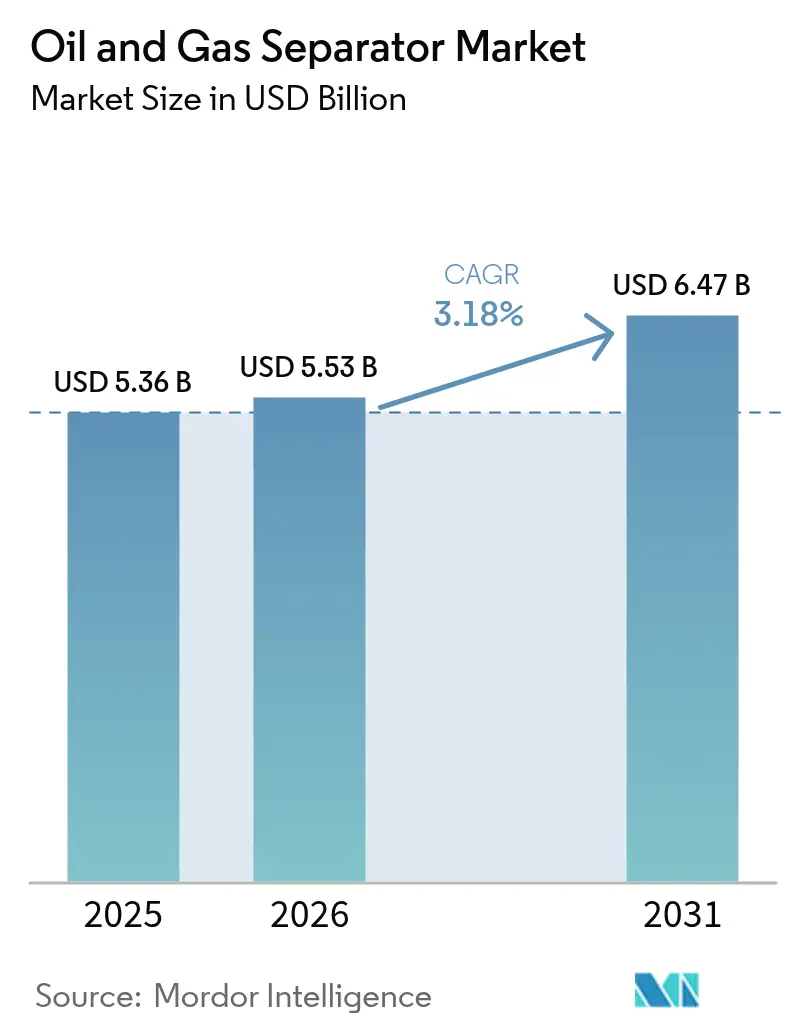
The Oil And Gas Separator Market size was valued at USD 5.36 billion in 2025 and estimated to grow from USD 5.53 billion in 2026 to reach USD 6.47 billion by 2031, at a CAGR of 3.18% during the forecast period (2026-2031).
This steady climb is rooted in ongoing shale development, revived offshore capital spending, and tighter produced‐water discharge rules, all of which demand higher-performing equipment. Operators are phasing out older gravity units in favor of space-saving centrifugal, cyclonic, and coalescer designs that cope better with fluctuating multiphase streams. Digital monitoring, especially AI-driven predictive maintenance, is now table stakes for premium systems, reducing downtime and helping owners navigate the shortage of skilled offshore technicians. Consequently, the oil and gas separator market now straddles conventional gravity devices and emerging compact technologies, each targeting different reservoir and infrastructure constraints.
Key Report Takeaways
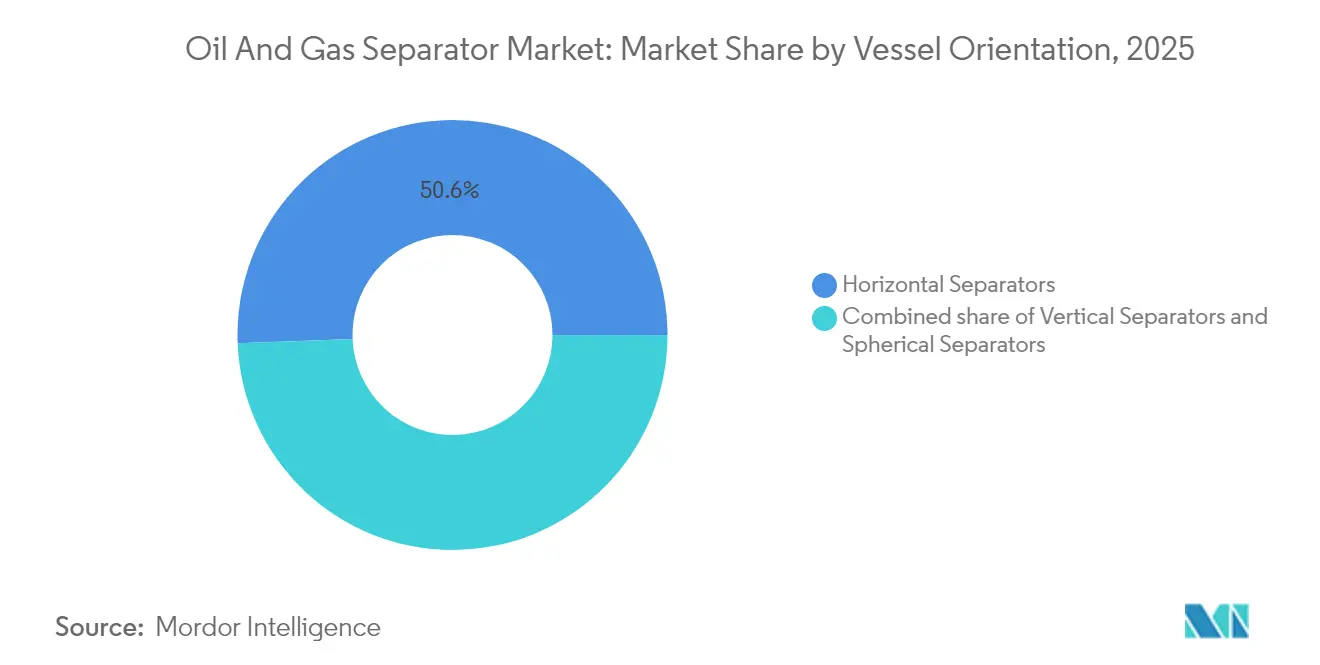
- By vessel orientation, horizontal units led the oil and gas separator market with 50.62% of the market share in 2025, while vertical configurations are expected to advance at a 5.28% CAGR through 2031.
- By phase type, two-phase equipment accounted for a 66.12% share of the oil and gas separator market size in 2025, and three-phase units are projected to track a 3.72% CAGR through 2031.
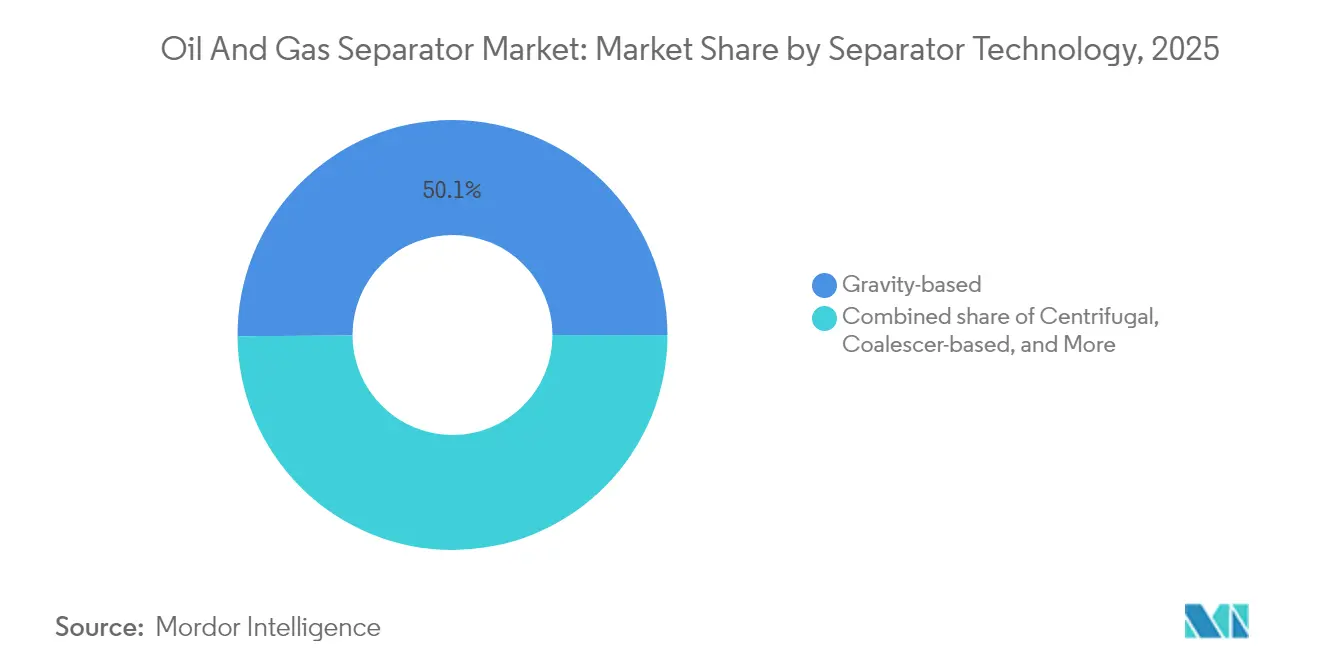
- By separator technology, gravity devices captured a 50.09% share in 2025; centrifugal systems are projected to expand at a 5.49% CAGR through 2031.
- By pressure rating, low-pressure vessels dominated the market with a 53.02% share in 2025, whereas high-pressure models (>1,000 psi) posted the fastest growth rate of 5.71% from 2025 to 2031.
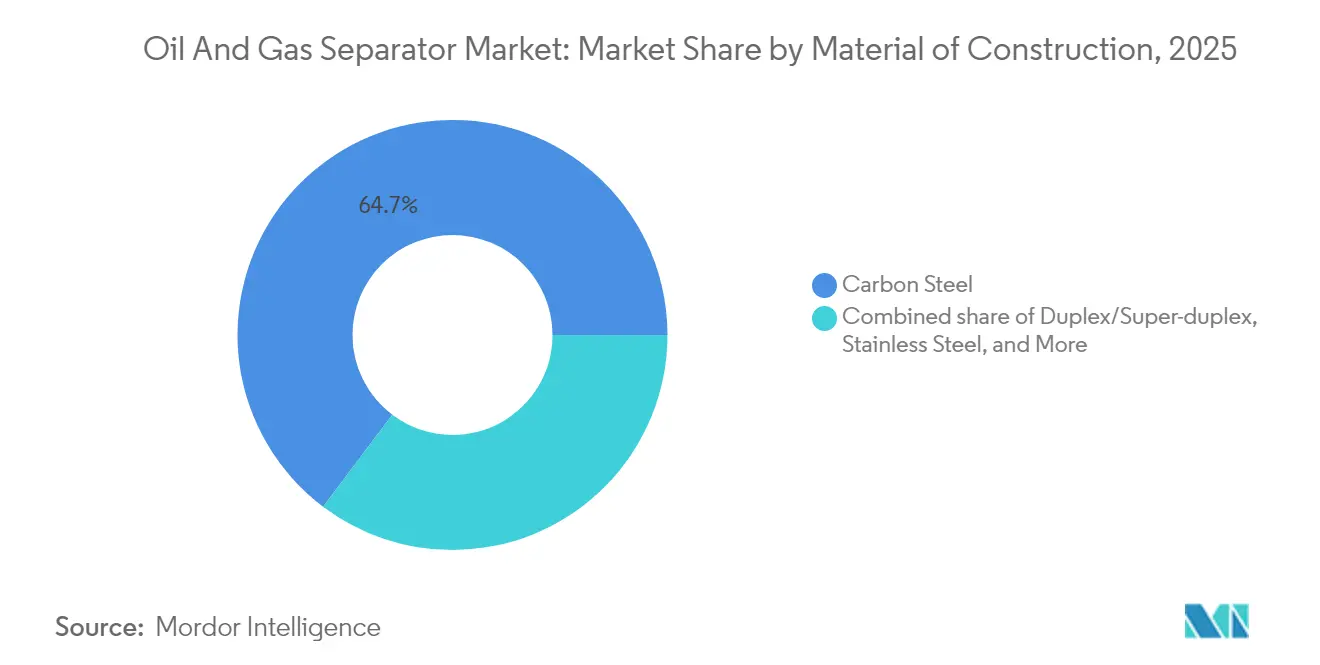
- By material, carbon-steel designs held a 64.72% share of the oil and gas separator market in 2025; however, duplex/super-duplex alloys are expected to register a 5.21% CAGR on sour-gas projects.
- By application, upstream stayed ahead with 48.12% revenue share in 2025, while midstream facilities recorded a 6.34% CAGR through 2031.
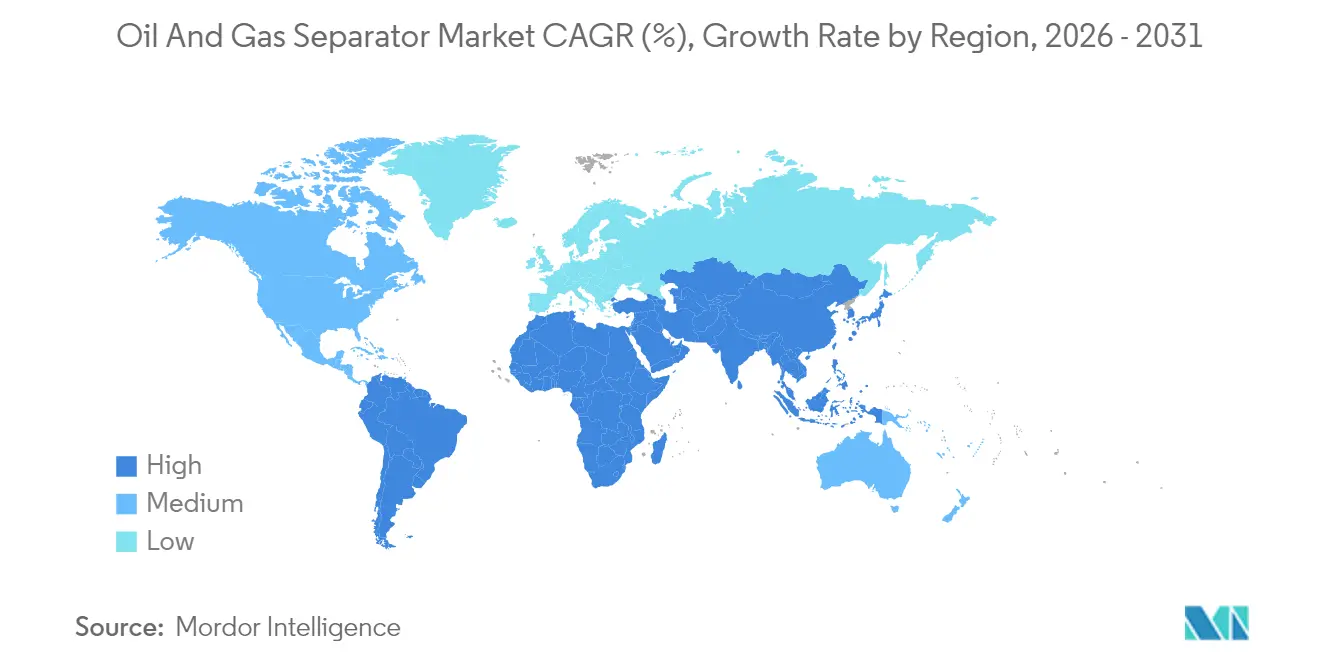
- By geography, the Middle East & Africa commanded 39.05% of 2025 revenue; the Asia-Pacific region is the fastest-growing at a 5.96% CAGR to 2031.
Note: Market size and forecast figures in this report are generated using Mordor Intelligence’s proprietary estimation framework, updated with the latest available data and insights as of 2026.
Market Trends and Insights
Drivers Impact Analysis of Oil And Gas Separator Market*
| Driver | (~) % Impact on CAGR Forecast | Geographic Relevance | Impact Timeline |
|---|---|---|---|
| Growth in unconventional shale output | +0.80% | North America core, spill-over to APAC & South America | Medium term (2-4 years) |
| Stricter environmental regulations on water | +0.60% | Global, early enforcement in North America & Europe | Short term (≤ 2 years) |
| Offshore deep-water project revival | +0.50% | Middle East & Africa, South America, APAC offshore | Long term (≥ 4 years) |
| Compact modular separators for FPSOs | +0.40% | Global offshore, led by Brazil, West Africa, North Sea | Medium term (2-4 years) |
| AI-driven predictive maintenance adoption | +0.30% | Global, led by North America & Europe | Long term (≥ 4 years) |
| Composite internals in sour service | +0.20% | Middle East, North America unconventional, APAC sour-gas fields | Medium term (2-4 years) |
| Source: Mordor Intelligence | |||
Growth in Unconventional Shale Output
Shale plays, typified by the Permian Basin, continue to expand and reshape the design needs for separators. Tight formations generate highly variable gas-to-oil ratios, forcing operators to specify three-phase vessels able to cope with surging gas volumes and occasional sand influx. Prefabricated modular units that can be easily shuffled between pads have become a standard procurement choice because productivity declines steeply over time, and producers want equipment that can be redeployed quickly. Tight-oil production reached 9.4 million b/d in 2024, underlining the sustained call for separators that tolerate erosive sand and foaming fluids.[1]U.S. Energy Information Administration, “Short-Term Energy Outlook January 2025,” eia.gov As these wells flow into trunk pipelines, midstream firms must add high-turndown separators to handle compositional swings, thereby enlarging demand beyond the wellhead.
Stricter Environmental Regulations on Produced Water
Discharge standards for produced water have tightened, particularly in North America and Europe, leading to an emphasis on reducing residual oil content. Updated U.S. wastewater rules require oil-in-water concentrations to be near zero for offshore discharges, prompting operators to adopt high-performance coalescers supplemented with proprietary media layers. Global produced-water volumes exceed 250 million barrels per day, and disposal/treatment costs can range from USD 0.50 to USD 2.00 per barrel, according to the International Association of Oil & Gas Producers.[2] International Association of Oil & Gas Producers, “Global Produced Water Report 2024,” iogp.org More efficient primary separation directly reduces downstream filtration and chemical dosing, transforming environmental compliance into a significant capital driver for the oil and gas separator market.
Offshore Deep-Water Project Revival
The rebound in Brent prices has reopened the sanction gate for deep-water projects in Brazil, West Africa, and the eastern Mediterranean. These plays often sit beneath 2,000 m of water and require separators certified to withstand pressures exceeding 1,000 psi. Subsea systems are emerging as an alternative to traditional topside processing, improving flow assurance and reducing deck loads. Petrobras earmarked USD 5.2 billion for high-pressure separation equipment through 2026.[3]Petrobras, “Annual Report 2024,” petrobras.com.br Such spending funnels directly into specialized vendors capable of fabricating duplex steel pressure vessels and delivering them with API 17D certification.
Demand for Compact Modular Separators in FPSOs
Tight deck real estate on FPSOs has spurred the development of vertical separators that trim footprint by roughly 30% compared with horizontal equivalents. Inclination-tolerant internals permit stable separation even when the vessel pitches ±15°, a common scenario off the coast of Brazil or West Africa. Seatrium’s USD 1.8 billion order in 2024 for FPSO modules with vertical vessels reflects this bias toward space-saving architecture. Operators also prize plug-and-play modules that can be swapped out quickly during short weather windows, reinforcing demand for skid-mounted formats within the oil and gas separator market.
Restraints Impact Analysis of Oil And Gas Separator Market*
| Restraint | (~) % Impact on CAGR Forecast | Geographic Relevance | Impact Timeline |
|---|---|---|---|
| Volatility in crude-oil prices | -0.70% | Global, acute in North America unconventional & offshore projects | Short term (≤ 2 years) |
| High capital cost of high-pressure units | -0.40% | Global offshore, deep-water South America & West Africa | Medium term (2-4 years) |
| Skilled-labor shortages offshore | -0.30% | Global offshore, centered in North Sea, Gulf of Mexico, West Africa | Long term (≥ 4 years) |
| Supply-chain bottlenecks for specialty alloys | -0.20% | Global, severe in duplex steel & corrosion-resistant alloys | Short term (≤ 2 years) |
| Source: Mordor Intelligence | |||
Volatility in Crude-Oil Prices
When benchmark prices drop below USD 70/bbl, operators tend to delay or scale back separator purchases, focusing on lower-capex standard units. The International Energy Agency recorded a 40% increase in annual price volatility in 2024, resulting in USD 15 billion in deferred projects worldwide. Smaller independents are particularly vulnerable, often opting for refurbished separators or rental units until their cash flows stabilize, which dampens near-term momentum for the oil and gas separator market.
High Capital Cost of High-Pressure Separators
Deep-water separators rated above 1,000 psi demand duplex steel shells, oversize forgings, and extensive nondestructive testing. Unit prices can be three to four times those of equivalent low-pressure models, and certification under API 6A or ASME Section VIII can add up to a year to the delivery time. Halliburton cited a 25% year-over-year cost increase for high-pressure vessels in 2024, as alloy shortages and test-bench congestion mounted.[4]Halliburton, “Investor Presentation Q4 2024,” halliburton.com Such premiums hinder adoption by marginal fields and independents, restraining the high-end slice of the oil and gas separator market.
*Our forecasts treat driver/restraint impacts as directional, not additive. The impact forecasts reflect baseline growth, mix effects, and variable interactions.
Oil And Gas Separator Market Segment Analysis
By Vessel Orientation:
Vertical Designs Gain FPSO TractionVertical-orientation units captured notable attention, even though horizontal vessels secured the largest 50.62% market share for oil and gas separators in 2025. The modular nature of offshore projects now leans heavily on vertical models, sending that segment on a 5.28% CAGR run toward 2031. Several Brazilian FPSOs signed in 2024 feature entirely vertical primary separation trains, citing a 30% reduction in deck space. Horizontal units retain dominance onshore because maintenance crews find tray‐pulling and internals inspection easier at ground level. Yet, the heavier focus on deep-water gas and liquids within the Asia-Pacific region is already tilting tenders toward slimmer vertical footprints.
Compactness aside, vertical designs score higher in sloshing tolerance thanks to shorter liquid hold-up lengths, a critical attribute for floating production systems. TechnipFMC quoted operators an impressive 20-year service life with upgraded anti‐slosh baffles in its newest vertical line. Meanwhile, spherical designs remain niche, primarily in subsea modules, where the geometry distributes hoop stress evenly. OEMs that master multi-orientation portfolios thus appeal to a broader spread of applications, ensuring their share of the oil and gas separator market stays resilient even if upstream activity migrates from land to sea.



By Phase Type:
Two-Phase Dominance Faces Three-Phase ChallengeTwo-phase equipment accounted for a 66.12% share of the oil and gas separator market size in 2025; however, this space is not static. LNG trains, NGL fractionators, and pipeline conditioners rely on simple gas-liquid splitters with large turndown ratios, ensuring stable demand and predictable margins. Three-phase units, however, notch incremental share as water cut climbs in aging fields and as produced-water discharge rules call for cleaner splits. Their 3.72% CAGR reflects the heightened need for integrated sand handling and desalter pre-treatment in unconventional oil and gas reservoirs.
OEM roadmaps indicate a rapid refinement of weir designs and interface controllers to minimize oil carryover in three-phase systems. Meanwhile, four-phase separators with sand jetting are popping up on Canadian heavy-oil pads. Yet, two-phase technology continues to evolve as well: Alfa Laval recently unveiled a high-capacity mixer-settler that brings 25% more throughput within the same envelope for midstream stations. Such step changes keep established two-phase solutions attractive and prevent them from yielding leadership easily in the oil and gas separator market.
By Separator Technology:
Centrifugal Systems Challenge Gravity DominanceGravity settling remained the workhorse in 2025, claiming 50.09% of total revenue. These designs are widely understood, inexpensive to maintain, and scalable across a range of flows. Centrifugal units nevertheless booked the fastest 5.49% CAGR, propelled by compact cyclonic cores that fit tight modules on seabed templates and brownfield decks. Where operators require plug-and-play tie-ins or must scrub gross liquids before gas compression, centrifugal styles provide compelling payback.
Sulzer’s latest offshore package illustrates the trend: the footprint shrank 50% relative to gravity drums, yet it delivered superior oil-in-water performance under high gas-volume fraction conditions. Coalescer cartridges and vane packs also enhance removal efficiency in gravity separators, blurring the binary split. However, centrifugal technology’s trajectory suggests it may close the revenue gap with gravity systems within the forecast window, thereby doubling the competitive tone of the oil and gas separator market.
By Pressure Rating:
High-Pressure Growth Driven by Deep-Water DevelopmentLow-pressure drums (<300 psi) still underpin 53.02% of shipments, reflecting the prevalence of onshore pads and midstream depots operating at pressures below gathering-line pressures. Yet, sanction momentum for deep-water FPSOs and subsea boosting has vaulted high-pressure (>1,000 psi) orders to a 5.71% CAGR, the fastest across rating classes. Each new ultra-high-pressure discovery in the Gulf of Mexico or Santos Basin implies multiple multi-stage separators sized for 2,000 psi service.
The certification premium for these vessels remains steep, but top-tier independents accept the added capex as the entry fee for unlocking reservoirs that flow at 12,000 psi at the mudline. Modularization also narrows delivery windows by allowing parallel fabrication of shell courses and internals. Consequently, OEMs that invested early in high-pressure forging capabilities now command a pricing advantage while consolidating their market share in the oil and gas separator market.
By Material of Construction:
Duplex Alloys Address Corrosion ChallengesCarbon steel maintained a 64.72% share in 2025 because many sweet-gas fields and onshore crude lines do not require expensive metallurgy. However, duplex and super-duplex alloys are projected to clock a 5.21% CAGR as operators seek higher H₂S thresholds and improved life-of-field reliability. Duplex’s superior chloride stress-crack resistance unlocks subsea installations where cathodic protection options are sparse and repairs are cost-prohibitive.
Composite or polymer-lined vessels are gaining traction for produced-water de-oiling, but their mechanical strength ceiling currently restricts them to low-pressure service. Several Middle East sour-gas megaprojects have mandated full duplex internals, prompting suppliers to blend lean duplex shells with super duplex wetted parts for cost balance. As sour-gas footprints broaden, metallurgical substitution will accelerate, progressively chipping away at carbon steel’s dominance in the oil and gas separator market.
By Application:
Midstream Infrastructure Drives Fastest GrowthUpstream facilities still generated 48.12% of 2025 revenue, given the universal need for primary separation at the wellhead. Midstream projects, however, scored a 6.34% CAGR as pipeline operators and LNG developers bolstered condensation handling and slug capture across long-haul routes. Compact modular skids that ship on pallets and bolt into pigging loops are particularly popular for new-build gas highways in India and China.
Downstream refineries and gas plants buy specialized separators for propane-propylene splitter pre-conditioning or amine sweetening. Those orders tick along at a GDP-like pace but are dwarfed by midstream’s burst of greenfield stretches. Vendors that carve out standard catalog skids with 12-week deliveries and remote performance analytics are positioned to outperform the overall oil and gas separator market going into 2030.
Geography Analysis
MEA Oil and Gas Separator Market
The Middle East & Africa led the oil and gas separator market with 39.05% revenue in 2025, as Saudi Arabia, the United Arab Emirates, and Qatar invested billions in offshore brownfield expansions and sour-gas gathering. Enhanced-oil-recovery campaigns within the Arabian Gulf rely on high-capacity three-phase separators with anti-corrosion upgrades, sustaining orders despite flat crude volumes. Nigeria and Angola adopted high-pressure subsea solutions for new deep-water plays, importing vertical cyclonic packages to meet both deck weight limits and stringent flaring rules.
APAC Oil and Gas Separator Market
The Asia-Pacific region delivered the swiftest 5.96% CAGR and is on track to narrow the gap with the Gulf by 2031. China’s accelerating gas pivot and state-owned enterprise appetite for South China Sea blocks are driving the growth of the oil and gas separator market in the region. Petronas, CNOOC, and ONGC prioritized gas-handling towers and mist eliminators in 2024 tenders, citing tighter marine discharge caps. Australia’s LNG megatrains continue to retrofit larger scrubbers as inlet gas becomes wetter, proving that the oil and gas separator market size within the Asia-Pacific region has room to expand beyond upstream into LNG backends.
North America and Europe Oil and Gas Separator Market
North America remains pivotal throughout the Permian’s relentless growth path, even as its overall share slips with faster offshore gains elsewhere. Three-phase skids customized for shale pad redeployment continue to be a core revenue pillar. Canada adds demand for sand-tolerant four-phase units capable of handling oil-sands pump failures and water content exceeding 70%. Europe’s North Sea now emphasizes refurbishment and replacement, swelling the aftermarket share of the oil and gas separator market as mature platforms seek to extend economic life while complying with EU methane rules.

Regulatory Landscape
Methane and emissions-control rules are tightening around oil and gas surface equipment, which is pushing operators toward lower-leak designs and monitoring-ready separation trains. In the United States, the EPA finalized New Source Performance Standards (OOOOb) and Emissions Guidelines (OOOOc) for the oil and natural gas sector in 2024, and issued technical amendments in April 2026 that update elements including flaring provisions and related monitoring. This is shaping how separators, associated controls, and related venting and flaring configurations are engineered and operated.
In Europe, Regulation (EU) 2024/1787 entered into force in 2024, setting requirements around leak detection and repair (LDAR) and restricting routine venting and flaring, with reach that extends to imported oil and gas via monitoring, reporting, and verification expectations. In Canada, final Enhanced Methane Regulations for the upstream oil and gas sector were published as SOR/2025-280 in December 2025. The rules provide multiple compliance pathways, including prescriptive fugitive-emissions management or alternative emission monitoring systems, reinforcing demand for separator packages that integrate measurement and diagnostics and support tighter emissions performance at the equipment level.
Competitive Landscape
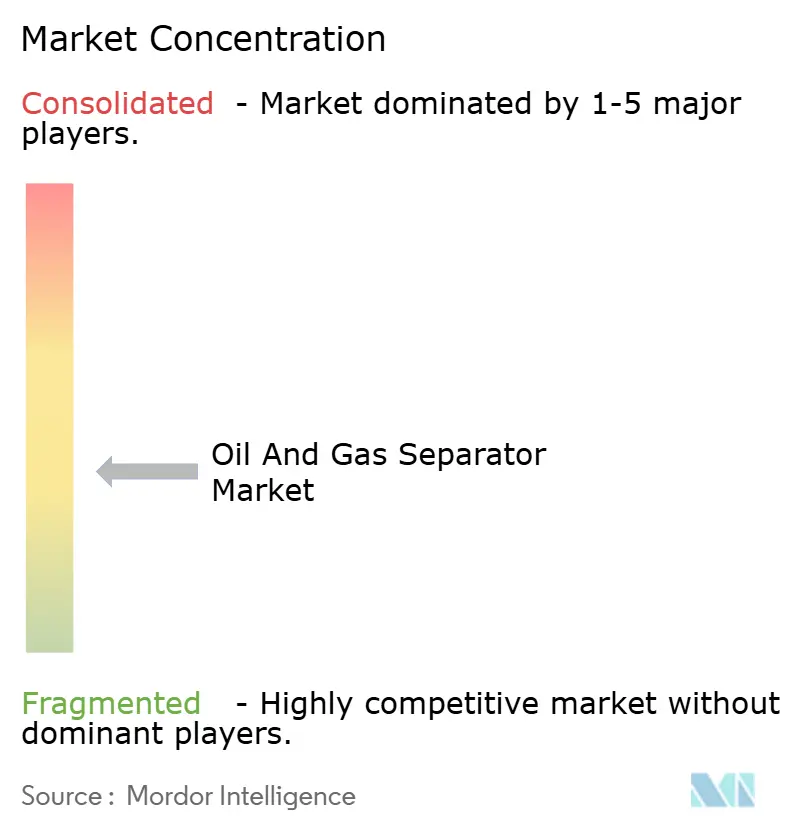
The oil and gas separator market exhibits moderate fragmentation, with the top five vendors collectively holding approximately 45% of the 2024 revenue, falling short of an oligopoly. Schlumberger, TechnipFMC, and Alfa Laval each command narrow specialties, respectively service-integrated units, offshore modularization, and high-efficiency internals. Regional manufacturers, particularly in China and India, fill lower-pressure, carbon-steel niches at competitive price points.
Strategic alliances have increased in frequency, as OEMs seek to bundle process simulation, digital twin modeling, and lifecycle services into a single contract. Schlumberger’s AI-based monitoring suite has become a pull-through asset, as its adoption often influences separator selection, as operators seek unified support layers. Likewise, TechnipFMC’s vertical integration into module design and yard delivery secured a USD 2.1 billion Brazilian FPSO package in 2025, underscoring the leverage of its execution track record on megaprojects.
White-space innovation focuses on subsea and high-pressure designs where certification barriers elevate margins. Start-ups in Norway and Singapore are trialing ceramic-lined cyclonic inserts with broad chemical resistance. Incumbents respond by strengthening material science departments and securing long-term duplex plate contracts to mitigate alloy volatility. Overall, the oil and gas separator market rewards firms that combine metallurgical expertise, digital reliability analytics, and flexible fabrication capabilities.
Oil And Gas Separator Industry Leaders
-
Schlumberger Limited
-
TechnipFMC plc
-
Alfa Laval AB
-
Honeywell International Inc.
-
Exterran Corporation
- *Disclaimer: Major Players sorted in no particular order
Oil And Gas Separator Market Companies Covered in this Report
- Schlumberger Limited
- TechnipFMC plc
- Alfa Laval AB
- Honeywell International Inc.
- Exterran Corporation
- GEA Group AG
- Frames Energy Systems B.V.
- Pentair plc
- Halliburton Company
- Sulzer AG
- National Oilwell Varco
- Andritz Group
- ProSep Inc.
- Pall Corporation
- Twister BV
- HAT International
- ACS Manufacturing Inc.
- Sep-Pro Systems Inc.
- Valerus (Enerflex)
- Worthington Industries

Market Opportunities and Future Outlook
A visible opportunity is emerging in retrofit and upgrade programs for aging assets, where rising water cut and stricter discharge performance requirements increase the value of higher-efficiency internals, coalescers, and digital monitoring. SLB completed the acquisition of Sulzer's Vessel Internal Electrostatic Coalescer (VIEC) technology in July 2026, expanding the installed-base upgrade toolkit for oil-water separation without requiring full vessel replacement. This aligns with operators phasing out older gravity-only configurations in favor of coalescer and compact high-performance designs.
Another near-term whitespace is modular separation for offshore and gas-processing megaprojects. Tight footprints and tougher specifications are drawing demand toward vertical, compact, and high-pressure certified trains. Tecnimont (MAIRE) advanced the Tengiz Gas Separation Complex in Kazakhstan with a 2025 milestone (project contract/ground-breaking coverage), built around deep recovery targets such as at least 98% ethane recovery from dry gas, which supports demand for large-scale engineered separation systems. At the wellsite, performance-driven separation demand is also broadening beyond topsides, with Halliburton reporting a May 2026 deployment of its Hydro-Helical downhole dynamic gas separator in the Bakken and a stated 20% oil-production increase in the case study, indicating continued equipment pull-through for gas-handling and separation solutions designed for highly variable shale conditions.
Recent Industry Developments in Oil And Gas Separator Market
- July 2026: SLB completed the acquisition of Sulzer's Vessel Internal Electrostatic Coalescer (VIEC) technology, adding electrostatic coalescence capability into its production and recovery portfolio. The acquisition strengthens offerings for oil-water separation upgrades in aging fields where water cut and produced-water constraints are tightening, supporting retrofit-oriented separator and internals demand.
- October 2025: Sulzer collaborated with TechnipFMC to supply customized 6 MW high-pressure centrifugal pumps for Petrobras's Mero 3 HISEP subsea separation pilot. This supports the industry shift toward subsea processing architectures that reduce topside congestion and demand higher-performance separation and handling systems designed for CO2-rich, high-pressure service.
- March 2024: TechnipFMC advanced Petrobras's Mero 3 HISEP initiative through the iEPCI award and continued public detailing of the dense-gas separation-and-storage concept for subsea deployment. The project highlights how separation scope is expanding from conventional topside vessels to integrated subsea processing and reinjection trains, raising the bar on compactness, reliability, and certification requirements for separator-related equipment.


Oil And Gas Separator Market Report Scope and Research Methodology
Market Definition and Coverage
This market covers revenues generated from oil and gas separators used to split wellstream into gas, oil, and produced water across upstream and processing sites, including onshore and offshore installations.
Scope exclusions: We exclude downstream refinery fractionation units and general-purpose industrial separators that are not designed for oil and gas production fluids.
Segments Covered in This Report
-
By Vessel Orientation
- Horizontal Separators
- Vertical Separators
- Spherical Separators
-
By Phase Type
- Two-phase Separators
- Three-phase Separators
- Four-phase/Sand Separators
-
By Separator Technology
- Gravity-based
- Centrifugal
- Filter-vane / Mist Eliminator
- Coalescer-based
- Compact Cyclonic
-
By Pressure Rating
- High-pressure (Above 1,000 psi)
- Medium-pressure (300 to 1,000 psi)
- Low-pressure (Below 300 psi)
-
By Material of Construction
- Carbon Steel
- Stainless Steel
- Duplex/Super-duplex
- Composite and Lined Vessels
-
By Application
- Upstream
- Midstream
- Downstream (Refineries and Gas Processing)
-
By Geography
-
North America
- United States
- Canada
- Mexico
-
Europe
- Norway
- United Kingdom
- Russia
- Netherlands
- Germany
- Rest of Europe
-
Asia Pacific
- China
- India
- Japan
- South Korea
- ASEAN Countries
- Australia
- Rest of Asia Pacific
-
South America
- Brazil
- Argentina
- Colombia
- Rest of South America
-
Middle East and Africa
- Saudi Arabia
- United Arab Emirates
- Qatar
- Nigeria
- South Africa
- Rest of Middle East and Africa
-
North America
Data Sources, Market Sizing, and Validation
Desk Research
Desk work starts with defining the demand pool and the operating context where separators are required, and then checking how activity levels are changing by region. We review public datasets and technical references such as the US EIA, OPEC publications, Baker Hughes rig count releases, World Bank commodity and macro indicators, and IEA oil and gas outlook material (where accessible) to anchor production trends and investment cycles.
Next, we map supply and pricing signals using sources such as company annual reports, investor presentations, press releases, and project award announcements, which help interpret replacement cycles and new capacity additions. When needed, we also refer to paid subscriptions for company financials and intelligence, import-export shipment-level checks, and patent databases to validate technology direction and the timing of major orders. The sources listed here are illustrative, and many other public and paid references are also used for data collection, cross-checks, and clarification.
Primary Interviews and Surveys
Primary inputs are taken from interviews and surveys with equipment suppliers, EPC participants, field operations teams, and engineering consultants who are close to separator specifications and procurement cycles. Because the market is global, coverage is balanced across major producing basins so assumptions on vessel sizing, order lead times, and average pricing can be confirmed and adjusted to observed practices.
Distribution of primary research fieldwork respondents
| Company type | Respondent position | Region |
|---|---|---|
| Top tier: 33% | CXOs: 19% | APAC: 41% |
| Mid tier: 47% | Functional/Unit leaders: 36% | EMEA: 36% |
| Smaller Players: 20% | Managers: 45% | Americas: 23% |
Market-Sizing & Forecasting
We build the market from the demand side first, where production and development activity are translated into separator needs by installation type and typical configuration, and then values are converted using region-level pricing logic. This top-down approach is grounded in indicators such as crude oil and gas production volumes, active rig counts, upstream capex direction, the onshore versus offshore project mix, and the typical replacement cadence for separators in mature fields.
To keep the total realistic, we corroborate it using selective bottom-up approximations, including sampled supplier revenues where available, channel checks on large project packages, and a volume times average selling price build for common vessel classes. Where direct volume visibility is weak, such as small brownfield replacements, we fill gaps through calibrated ratios tied to operating well counts and maintenance intensity, and then re-check those ratios with interview feedback.
For forecasting, scenario analysis is used because demand is sensitive to oil price expectations and upstream spending sentiment, and then the scenarios are translated into a single base case after expert review. Key forward drivers include announced field developments, LNG and gas processing additions that influence separation needs, regional production outlooks, and expected material and fabrication cost trends that move average prices.
Data Validation & Update Cycle
Before sign-off, model totals are compared with independent signals such as rig activity shifts, major project sanctioning patterns, and supplier backlog commentary, which helps spot over-counting or timing errors. If a regional number looks unusual, the assumptions are revisited, and targeted re-contacts are triggered to confirm whether the change reflects new evidence or data-driven noise.
Each report is reviewed in multiple steps, including an internal peer check on unit logic, currency conversions, and year alignment, followed by a final analyst pass to remove inconsistencies. We refresh the study annually, and interim updates are made when there are material events such as sharp capex resets, major offshore project delays, or step changes in drilling activity, with a final update pass completed right before delivery.
Mordor Intelligence's Oil and Gas Separator Market Size Measured Against Other Published Estimates
Published market sizes for oil and gas separators can vary even when the topic name looks the same, because the counted equipment set and the timing assumptions are not always aligned. The benchmark table highlights a spread that usually comes from what is treated as a separator versus adjacent separation equipment, plus the year used for currency and pricing.
The table shows a higher 2025 value in one estimate and a lower 2026 value in another, and in Mordor Intelligence's model the market is limited to dedicated oil and gas separators and related skids used for phase separation, rather than folding in broader oil and gas separation equipment like scrubbers, treaters, or other process vessels. Differences can also come from how offshore packages are valued (full module versus separator-only value), how average selling prices are stepped up with steel and fabrication costs, and whether base case project timing is updated after delays.
Benchmark comparison
| Source | Market Size | Gaps in Research Methodology |
|---|---|---|
| Mordor Intelligence | USD 5.36 B (2025) | |
| Trade Publisher A | USD 4.64 B (2025) | Uses a wider 2026-2035 window and may understate near-term offshore package value by applying more uniform average prices across regions and vessel classes. |
| Industry Report B | USD 5.06 B (2026) | Uses a later base year and can shift demand into 2026 by relying more on stated project pipelines, which may not be adjusted quickly when sanctions and delivery schedules change. |
Across the three figures, the practical gap is mainly about what gets counted as separator-only revenue and how timing is handled for delayed projects and offshore packages. When the scope, price logic, and activity indicators are kept consistent year to year, the resulting number is easier to trace back to clear demand signals and repeatable steps.


Key Questions Answered in the Report
How large is the oil and gas separator market in 2026 and what growth is expected?
The market stands at USD 5.53 billion in 2026 and is projected to reach USD 6.47 billion by 2031, growing at a 3.18% CAGR.
Which region shows the strongest growth for separators?
Asia-Pacific leads growth with a 5.96% CAGR through 2031, bolstered by Chinese deep-water and Indian gas-pipeline projects.
What separator technology is gaining share fastest?
Centrifugal and cyclonic units post the quickest 5.49% CAGR, thanks to their compact footprint and high-efficiency performance.
Why are vertical separators favored on FPSOs?
Vertical vessels cut deck footprint by around 30% and tolerate vessel motion better than horizontal designs, critical for floating production.
How does environmental regulation influence separator demand?
Stricter produced-water discharge limits push operators toward higher-efficiency coalescers and advanced internals to meet near-zero oil-in-water targets, spurring capital upgrades.
Page last updated on:


 Your data is secure and never sold or shared.


