Market Overview
| Study Period | 2021 - 2031 |
|---|---|
| Market Size (2026) | USD 64.44 Billion |
| Market Size (2031) | USD 75.08 Billion |
| Growth Rate (2026 - 2031) | 3.11% CAGR |
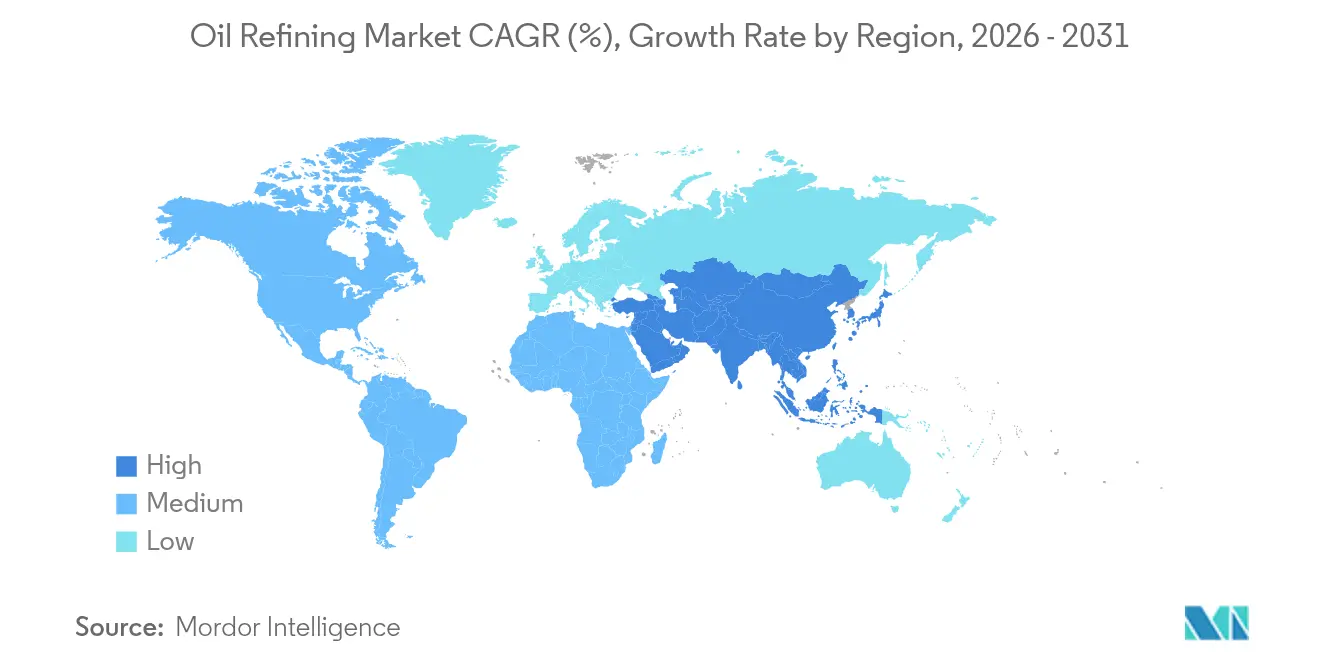
| Fastest Growing Market | Asia Pacific |
| Largest Market | Asia Pacific |
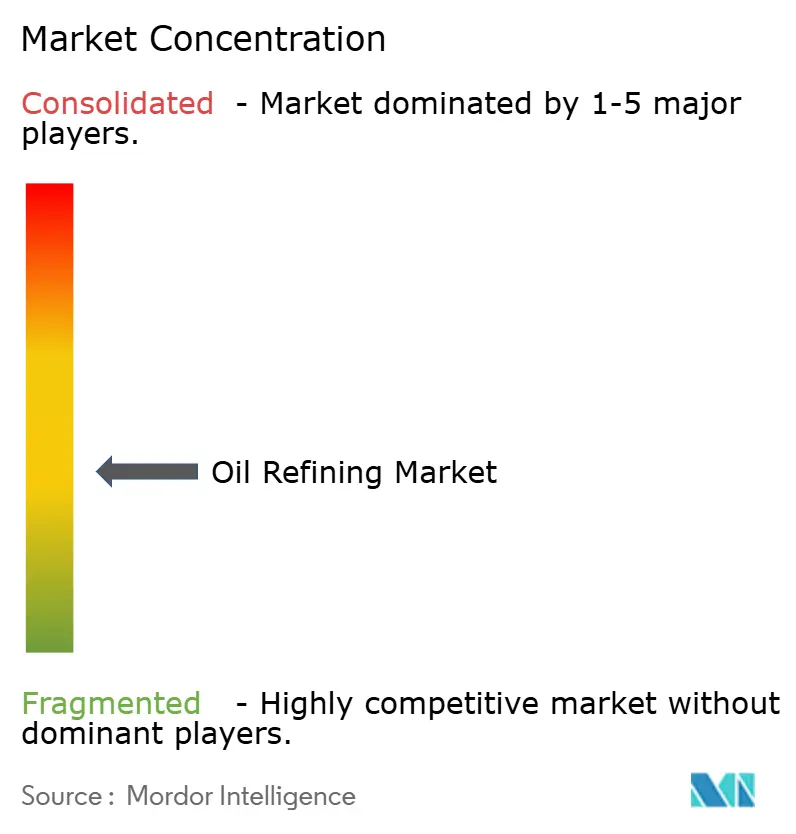
| Market Concentration | Medium |
Major Players *Disclaimer: Major Players sorted in no particular order Image © Mordor Intelligence. Reuse requires attribution under CC BY 4.0. | |
Oil Refining Market Analysis by Mordor Intelligence
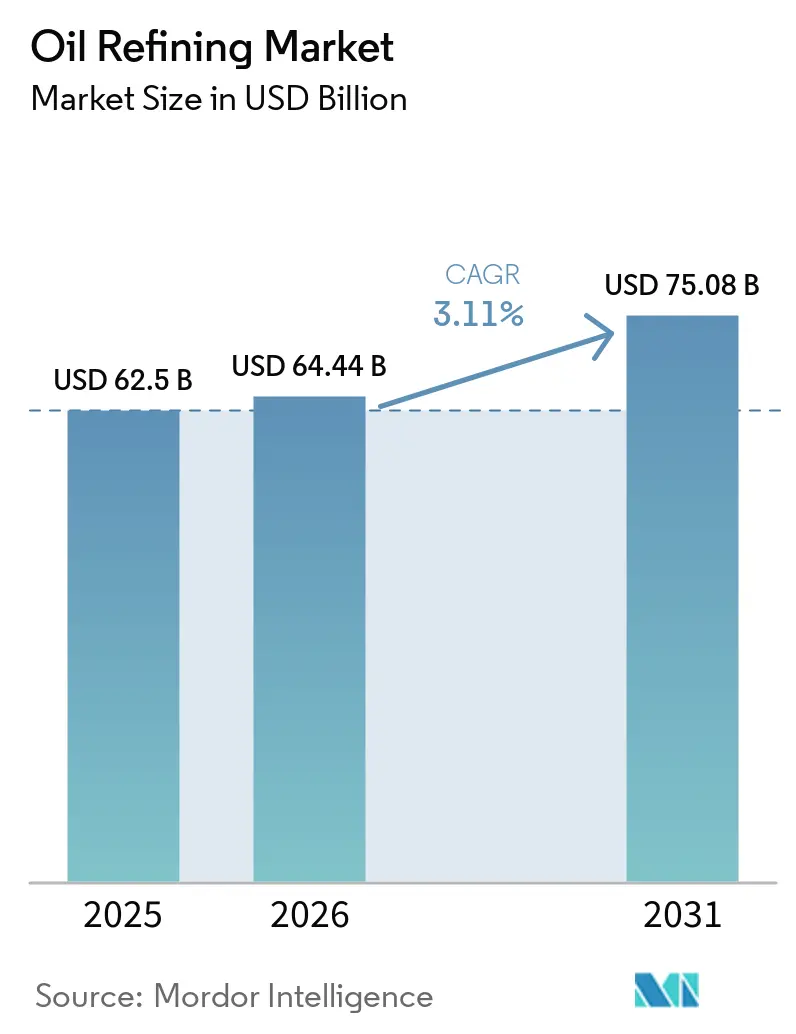
The Oil Refining Market size was valued at USD 62.5 billion in 2025 and estimated to grow from USD 64.44 billion in 2026 to reach USD 75.08 billion by 2031, at a CAGR of 3.11% during the forecast period (2026-2031).
This forward trajectory stems from refiners’ accelerated push into petrochemical integration, large-scale desulfurization retrofits, and renewable diesel platforms that help shield margins from soft gasoline demand. Operators that combine conversion depth, digital optimization, and diversified fuel slates continue to outperform, while plants locked into single-fuel economics or lacking feedstock flexibility are closing or converting to specialty uses. Refinery throughput growth remains strongest in the Asia-Pacific, the Middle East, and select African markets, where governments support downstream self-sufficiency and export ambitions. Simultaneously, OECD rationalization and ESG-linked capital scarcity limit green-field build in developed regions, intensifying the global contest for high-quality barrels and resilient cracks.
Key Report Takeaways
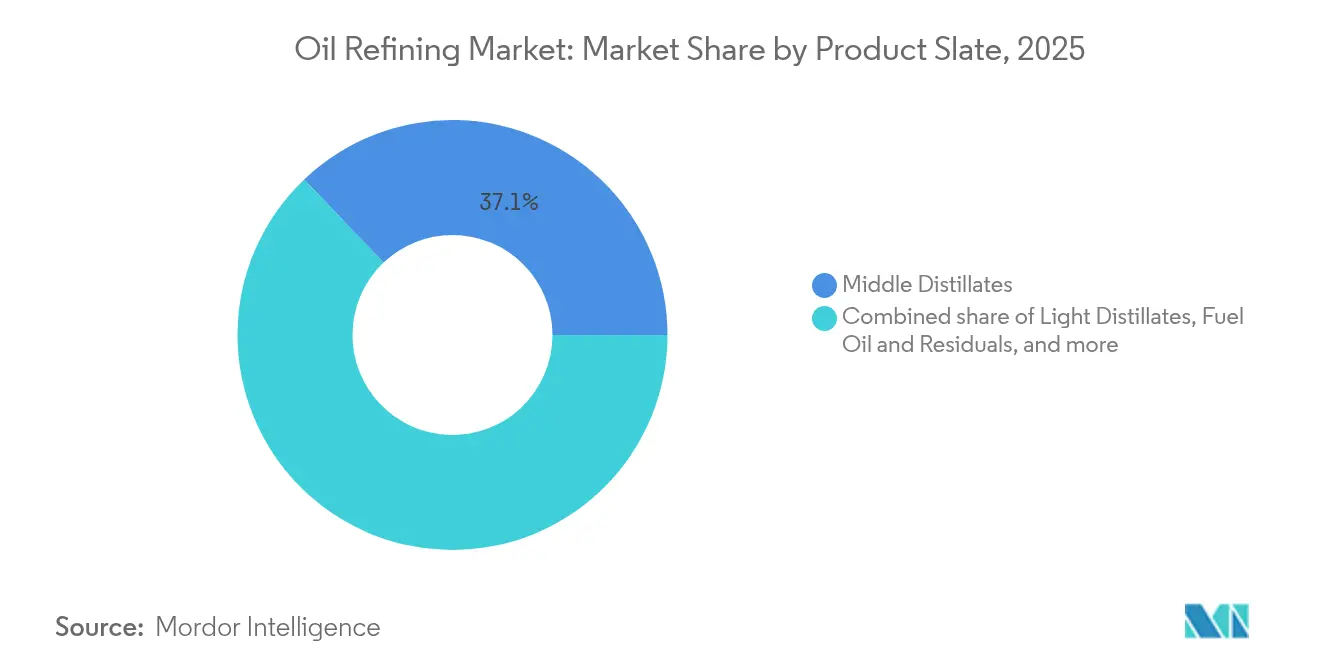
- By product slate, middle distillates held 37.12% of the oil refining market share in 2025; petrochemical feedstock is projected to grow at a 3.85% CAGR through 2031.
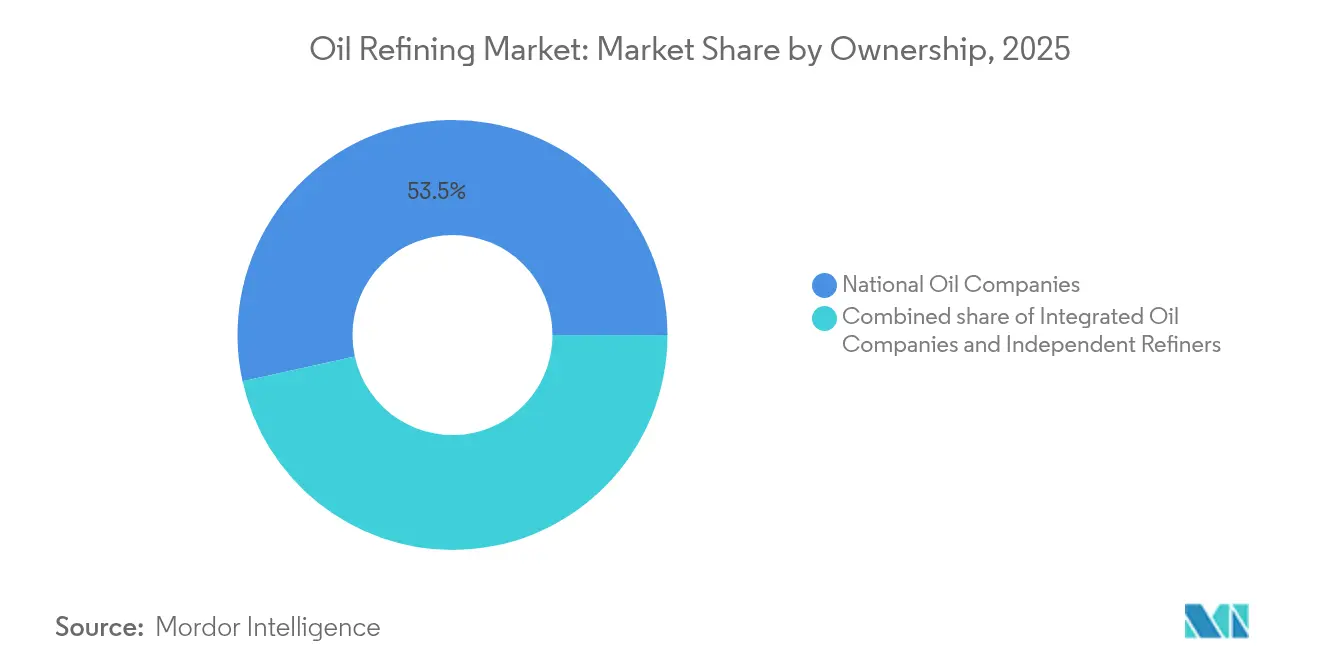
- By ownership, national oil companies commanded 53.45% of the oil refining market share in 2025, whereas independent / merchant refiners posted the fastest 3.65% CAGR through 2031.
- By geography, Asia-Pacific controlled 34.62% of the oil refining industry in 2025, expanding at a 4.04% CAGR between 2026 and 2031.
Note: Market size and forecast figures in this report are generated using Mordor Intelligence’s proprietary estimation framework, updated with the latest available data and insights as of 2026.
Market Trends and Insights
Drivers Impact Analysis of Oil Refining Market*
| Driver | (~) % Impact on CAGR Forecast | Geographic Relevance | Impact Timeline |
|---|---|---|---|
| Petro-chemical feed-stock push in Asia bolstering conversion upgrades | +0.8% | Asia-Pacific core, spill-over to Middle East | Medium term (2-4 years) |
| Low-sulfur marine fuels post-IMO 2020 triggering desulfurization retrofit wave | +0.6% | Global, concentrated in major shipping hubs | Short term (≤ 2 years) |
| Middle-East NOCs' forward integration capturing downstream margins | +0.5% | Middle East & Africa, export markets globally | Long term (≥ 4 years) |
| U.S. light-tight oil boom driving condensate-splitter investments | +0.4% | North America, primarily U.S. Gulf Coast | Medium term (2-4 years) |
| Discounted Russian Urals stimulating European complex refinery margins | +0.3% | Europe, selective refineries with heavy crude capability | Short term (≤ 2 years) |
| Renewable diesel co-processing incentives in OECD raising hydro-treating spend | +0.2% | OECD countries, particularly U.S. and Europe | Long term (≥ 4 years) |
| Source: Mordor Intelligence | |||
Petro-chemical feed-stock push in Asia bolstering conversion upgrades
Asia’s refiners integrate catalytic crackers and polypropylene lines to move up the value chain. CNOOC’s Ningbo upgrade added 450,000 tpy polypropylene capacity and lifted crude runs by 50%, giving the complex access to robust domestic chemical demand.[1]“CNOOC Ningbo PP Expansion,” oilprice.com, oilprice.com Similar investments in India aim to target 35-40 million tonnes of new capacity by 2030, with naphtha being directed to aromatic and olefin chains. Integration protects margins from erosion driven by electric vehicles, while capturing higher petrochemical spreads that underpin long-term earnings resilience across the oil refining industry.
Low-sulfur marine fuels post-IMO 2020 triggering desulfurization retrofits
The sulfur cap continues to reshape fuel quality expectations. ExxonMobil’s Fawley investment includes a hydrotreater that produces 570 million gallons of low-sulfur diesel annually. Inland refiners also retrofit desulfurizers to supply premium bunker fuel, expanding geographic supply and improving arbitrage options. Sustained capital inflows toward compliance upgrades reinforce demand for hydrogen and catalyst systems, sustaining throughput flexibility and supporting the oil refining industry.
Middle-East NOCs’ forward integration capturing downstream margins
ADNOC, Saudi Aramco, and other national champions utilize their resource advantages to develop export-oriented complexes. Their integrated models combine crude production with refining and chemical assets, enabling them to offer competitive pricing in Asia’s high-growth hubs. Rising volumes from these players pressure merchant refiners but improve regional product availability, shaping trade flows and relative margin dynamics across the oil refining industry.
U.S. light-tight oil boom driving condensate splitter investments
Surging shale output drives investments in condensate splitters and crude flexibility. Phillips 66 completed projects at Sweeny, optimizing light sweet processing and improving petrochemical feedstock yields. Gas-to-gasoline ventures, such as Verde Clean Fuels’ Permian plant, illustrate new pathways to producing finished products. These moves enhance U.S. competitiveness and boost product exports, thereby adding depth to the global oil refining industry.
Restraints Impact Analysis of Oil Refining Market*
| Restraint | (~) % Impact on CAGR Forecast | Geographic Relevance | Impact Timeline |
|---|---|---|---|
| OECD refinery rationalization under net-zero targets | -0.9% | Europe & North America, selective closures globally | Long term (≥ 4 years) |
| Rising ESG-driven capital scarcity for green-field plants | -0.7% | Global, particularly developed markets | Medium term (2-4 years) |
| Volatile crack spreads eroding ROCE for merchant refiners | -0.4% | Global, concentrated in independent refiners | Short term (≤ 2 years) |
| Carbon-pricing schemes compressing heavy-fuel margins | -0.3% | Europe, expanding to other developed markets | Medium term (2-4 years) |
| Source: Mordor Intelligence | |||
OECD refinery rationalisation under net-zero targets
Europe and North America are closing or repurposing older plants as firms align with climate policies. TotalEnergies is converting Grandpuits into a zero-crude platform producing sustainable aviation fuel and biopolymers. Shell will end crude runs at Wesseling by 2025, shifting to base oils.[2]“Shell Wesseling Transition,” shell.com, shell.com These actions tighten regional supply, elevate utilization at surviving sites, and reshape product import patterns, yet cap capacity growth within the oil refining market.
Rising ESG-driven capital scarcity for green-field plants
Investors seek lower-carbon returns, making it harder to finance new refining units. Shell’s pause of its Rotterdam biofuel project and related impairments highlight the heightened scrutiny even for transition-aligned assets.[3]“Rotterdam Biofuels Pause,” theguardian.com, theguardian.com Equity valuations trailing renewable peers restrict balance-sheet capacity for growth, pushing operators toward brownfield optimization instead of greenfield builds, which moderates the expansion of the oil refining market.
*Our forecasts treat driver/restraint impacts as directional, not additive. The impact forecasts reflect baseline growth, mix effects, and variable interactions.
Oil Refining Market Segment Analysis
By Product Slate:
Petrochemicals Drive Value MigrationMiddle distillates retained a 37.12% oil refining market share in 2025, as jet fuel and diesel recovered alongside global travel and emerging-market freight. Light distillates continue to benefit from rising vehicle ownership in developing economies, yet face structural declines in mature regions. Heavy fuel oil struggles with stricter marine and power regulations, prompting investments in cokers and hydrocrackers to upgrade residues. The petrochemical feedstock category grows at the fastest rate, with a 3.85% CAGR, as integrated operators channel naphtha and LPG into high-margin polymer chains. The chemicals pivot enhances margin stability and supports a broader revenue base within the oil refining industry.
Greater integration increases unit complexity, enhancing crude flexibility and enabling the selection of a diverse slate. CNOOC’s polypropylene addition in Ningbo and Shell’s Huizhou expansion, scheduled for 2028, highlight the trend toward operations centered on chemicals. Such projects expand the oil refining market size for high-conversion assets and shield earnings from gasoline displacement by electric vehicles.


By Ownership:
NOCs Dominate While Independents Adapt FastestNational oil companies held 53.45% of the oil refining market share in 2025, using secure crude access and government capital to build integrated sites that displace traditional majors. Saudi Aramco's multi-site downstream push and ADNOC's Ruwais upgrades typify how NOCs leverage their resource depth to secure Asian offtake agreements. CNOOC's USD 2.74 billion Ningbo revamp underscores the scale advantage of state firms, extending their reach into domestic polymer niches and regional product exports.
Independent/merchant refiners, although smaller, are expected to expand the fastest at a 3.65% CAGR through 2031. Their agile capital allocation, focus on high-return upgrades, and willingness to pivot to renewable diesel allow quick adaptation to market swings. Phillips 66's dedicated Renewable Diesel segment and Valero's low-carbon project pipeline demonstrate how independents can monetize incentives and flex their operations while remaining within the core oil refining industry. Integrated oil companies contend with upstream-downstream balancing acts, prompting selective divestments such as TotalEnergies' Grandpuits switch to a zero-crude platform and Shell's Wesseling base-oil pivot. As majors tilt portfolios toward low-carbon ventures, NOCs and independents fill conventional refining gaps, reshaping future shares across the oil refining market size continuum.
Geography Analysis
APAC Oil Refining Market
Asia-Pacific’s refining complex expansion underpins its leadership. CNOOC’s USD 2.74 billion Ningbo upgrade lifted crude runs to 240,000 bpd, adding polypropylene units to meet domestic plastics demand. India’s planned capacity builds worth INR 1.9-2.2 lakh crore support sustained supply as consumption expands at 4% CAGR. Southeast Asia is seeing new projects in Vietnam and Indonesia aimed at reducing product import dependence, while Japan and South Korea are focusing on high-efficiency operations and technology exports. The region’s integrated models and government backing continue to enlarge the oil refining market.
North America Oil Refining Market
North America remains a pivotal exporter. Shale-driven light crude availability reduces feedstock costs for Gulf Coast refineries. Phillips 66’s Sweeny upgrades allow flexible runs that favor gasoline and chemical feedstock production. Valero channels USD 5.4 billion into low-carbon projects, including renewable diesel, to balance emissions objectives with margin capture. Canada and Mexico vie to modernize their assets amid policy shifts, yet the U.S. maintains a structural advantage in the oil refining industry through its abundant feedstocks and deepwater logistics networks.
Europe Oil Refining Market
Europe experiences the fastest structural change. TotalEnergies converts Grandpuits to a renewable platform, while Shell repurposes Wesseling, removing conventional capacity yet adding sustainable aviation and base-oil output. Carbon pricing increases operating costs for heavy-fuel streams, incentivizing the conversion of units and the integration of hydrogen. Supply tightness from closures increases imports from the Middle East and the United States, elevating trans-Atlantic trade and reinforcing competitiveness gaps among surviving plants within the oil refining market.

Competitive Landscape
Market concentration remains moderate. ExxonMobil, Shell, and Saudi Aramco lead the industry through scale, technology, and feedstock advantages, but collectively account for less than one-quarter of the throughput. Independent refiners, such as Valero and Marathon, emphasize operational flexibility and renewable diesel to defend their margins. National oil companies expand integrated complexes to lock in downstream value. Phillips 66 created a Renewable Diesel segment, and Valero allocated $5.4 billion to low-carbon assets, signaling a pivot toward sustainable platforms that complement its conventional refining operations. Technology investment centers on digital twins and AI-based optimization to cut energy use and emissions rather than disruptive process innovations.
M&A speculation surrounds majors as the rack spread volatility pressures merchant economics, yet antitrust and strategic hurdles limit large-scale deals. Downstream integration by Middle Eastern NOCs intensifies Asian competition, compelling independents to differentiate through cost leadership or specialty output. Renewable mandates create white-space opportunities in sustainable aviation and renewable diesel, attracting capital and partnerships that reshape the future earnings mix of the oil refining market.
Oil Refining Industry Leaders
Sinopec Corp.
Exxon Mobil Corporation
Saudi Aramco (incl. JV capacity)
Shell plc
BP plc
- *Disclaimer: Major Players sorted in no particular order
Oil Refining Market Companies Covered in this Report
- Exxon Mobil Corporation
- Sinopec Corp.
- Shell plc
- Saudi Aramco
- BP plc
- Chevron Corporation
- Valero Energy Corp.
- Marathon Petroleum Corp.
- Phillips 66
- Indian Oil Corporation Ltd.
- Rosneft PJSC
- CNPC
- TotalEnergies SE
- PKN Orlen SA
- Petrobras SA
- ENOC
- Reliance Industries Ltd.
- Petron Corp.
- PETRONAS
- Bharat Petroleum Corporation Limited

Recent Industry Developments in Oil Refining Market
- June 2025: Nigeria's Dangote refinery has dispatched its inaugural 90,000-tonne gasoline shipment to Asia, facilitated by trader Mercuria. This marks the refinery's debut gasoline export beyond West Africa, underscoring its ambition to tap into wider international markets. With a robust capacity of 650,000 barrels per day, the refinery has predominantly catered to the gasoline needs of the West African region.
- April 2025: Afreximbank has unveiled a USD 3 billion revolving credit facility aimed at bolstering intra-African trade in refined petroleum products and curbing import dependence. Dubbed the Revolving Intra-African Oil Trade Financing Program, the facility will enable buyers from Africa and the Caribbean to procure fuel directly from African refineries. This move is anticipated to spur investments in refining and logistics, with the potential to increase refining capacity by 1.3 million barrels per day.
- April 2025: Due to overcapacity in the European petrochemical market and the non-renewal of a major ethylene contract, TotalEnergies plans to shut down its oldest steam cracker in Antwerp by the end of 2027. At the same time, the company is channeling investments into a 200 MW green hydrogen production facility. Of this, 130 MW has already been contracted with Air Liquide, enabling the production of 15,000 tonnes of green hydrogen annually for on-site use.
- March 2025: CNOOC has initiated a USD 2.74 billion expansion at its Ningbo refinery, increasing its crude processing capacity by 50%. The upgrade introduces a new 120,000 barrels per day crude unit, elevating the total capacity to 240,000 barrels per day.


Global Oil Refining Market Report Scope
Oil refining, also known as petroleum refining, is the industrial process of transforming crude oil (also referred to as petroleum) into various refined products used in everyday life. Crude oil is a complex mixture of hydrocarbons, including gases, liquids, and solids.
The Oil Refining Market is Segmented by Geography (North America, Asia-Pacific, Europe, South America, the Middle-East, and Africa). For each segment, the market sizing and forecasts have been done based on refining capacity (in million barrels per day).
Segmentation Overview
By Product Slate
| Light Distillates (Gasoline, Naphtha) |
| Middle Distillates (Diesel/Gasoil, Jet/Kero) |
| Fuel Oil and Residuals |
| Petro-chemical Feed-stocks (Propylene, Aromatics) |
By Ownership
| National Oil Companies (NOCs) |
| Integrated Oil Companies (IOCs) |
| Independent/Merchant Refiners |
By Geography
| North America | United States |
| Canada | |
| Mexico | |
| Europe | United Kingdom |
| Germany | |
| France | |
| Spain | |
| Nordic Countries | |
| Russia | |
| Rest of Europe | |
| Asia-Pacific | China |
| India | |
| Japan | |
| South Korea | |
| Malaysia | |
| Thailand | |
| Indonesia | |
| Vietnam | |
| Australia | |
| Rest of Asia-Pacific | |
| South America | Brazil |
| Argentina | |
| Colombia | |
| Rest of South America | |
| Middle East and Africa | United Arab Emirates |
| Saudi Arabia | |
| South Africa | |
| Egypt | |
| Rest of Middle East and Africa |
| By Product Slate | Light Distillates (Gasoline, Naphtha) | |
| Middle Distillates (Diesel/Gasoil, Jet/Kero) | ||
| Fuel Oil and Residuals | ||
| Petro-chemical Feed-stocks (Propylene, Aromatics) | ||
| By Ownership | National Oil Companies (NOCs) | |
| Integrated Oil Companies (IOCs) | ||
| Independent/Merchant Refiners | ||
| By Geography | North America | United States |
| Canada | ||
| Mexico | ||
| Europe | United Kingdom | |
| Germany | ||
| France | ||
| Spain | ||
| Nordic Countries | ||
| Russia | ||
| Rest of Europe | ||
| Asia-Pacific | China | |
| India | ||
| Japan | ||
| South Korea | ||
| Malaysia | ||
| Thailand | ||
| Indonesia | ||
| Vietnam | ||
| Australia | ||
| Rest of Asia-Pacific | ||
| South America | Brazil | |
| Argentina | ||
| Colombia | ||
| Rest of South America | ||
| Middle East and Africa | United Arab Emirates | |
| Saudi Arabia | ||
| South Africa | ||
| Egypt | ||
| Rest of Middle East and Africa | ||


Key Questions Answered in the Report
What is the current value of the oil refining market?
The oil refining market size is USD 64.44 billion in 2026 and is projected to reach USD 75.08 billion by 2031.
Which region leads the oil refining market growth?
Asia-Pacific holds the largest share at 34.62% in 2025 and is forecast to expand at a 4.04% CAGR through 2031.
Which product slate dominates global refinery output?
Middle distillates, including diesel and jet fuel, accounted for 37.12% of the oil refining market share in 2025.
What is driving petrochemical integration in refineries?
Higher and more stable petrochemical margins encourage refiners to add catalytic crackers and polymer units, diversifying revenues and reducing exposure to declining gasoline demand.
How are climate policies affecting OECD refining capacity?
Net-zero commitments are prompting plant closures or conversions, with more than 20% of OECD capacity at risk by 2031, tightening regional supply but curbing traditional expansion.
Page last updated on:


