Market Overview
| Study Period | 2021 - 2031 |
|---|---|
| Forecast Data Period | 2026 - 2031 |
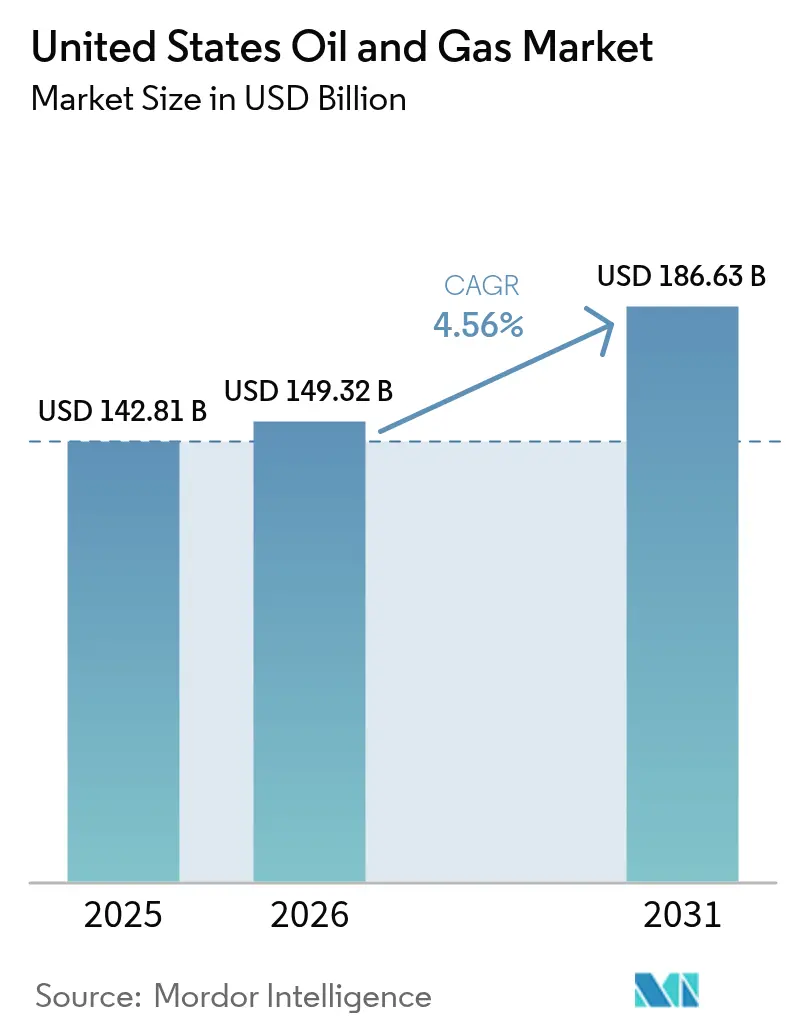
| Base Year Market Size (2025) | USD 142.81 Billion |
| Market Size (2026) | USD 149.32 Billion |
| Market Size (2031) | USD 186.63 Billion |
| Growth Rate (2026 - 2031) | 4.56% CAGR |
| Market Concentration | Low |
Major Players
*Disclaimer: Major Players sorted in no particular order Image © Mordor Intelligence. Reuse requires attribution under CC BY 4.0. |
|
United States Oil And Gas Market Analysis by Mordor Intelligence
The United States Oil And Gas Market size in 2026 is estimated at USD 149.32 billion, growing from 2025 value of USD 142.81 billion with 2031 projections showing USD 186.63 billion, growing at 4.56% CAGR over 2026-2031.
Robust drilling productivity in tight-oil plays, the rapid build-out of Gulf Coast LNG trains, and steady technology diffusion into mature basins underpin this expansion. Structural change is evident as export-oriented growth outpaces domestic demand, with 15 billion cubic feet per day of new LNG liquefaction slated by 2028. Upstream reinvestment remains disciplined, yet efficiency gains allow production to rise even as rig counts fall.(1)U.S. Energy Information Administration, “Tight oil production in Permian drives growth,” eia.gov Meanwhile, mega-mergers concentrate Permian Basin acreage, unlocking shared infrastructure savings that strengthen breakeven resilience.
Key Report Takeaways
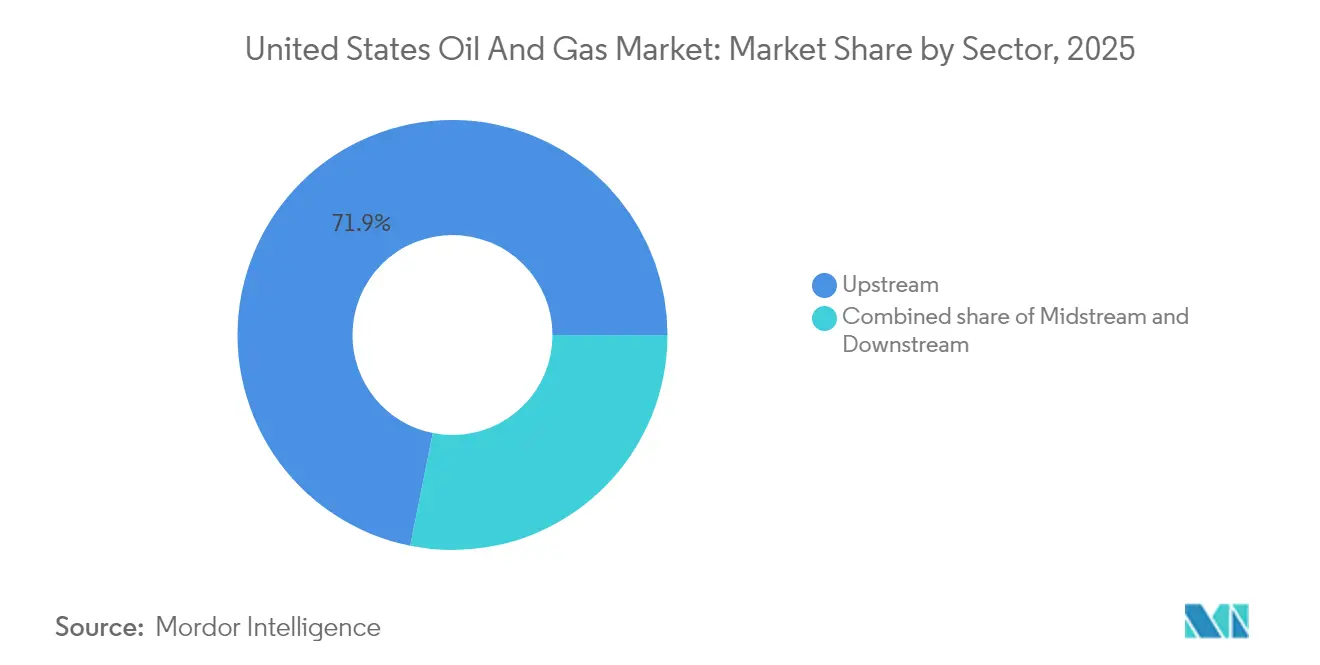
- By sector, the upstream segment held 71.85% of the US oil and gas market share in 2025 and is projected to advance at a 4.84% CAGR through 2031.
- By location, onshore operations captured a 73.25% share in 2025, while offshore projects recorded the fastest 5.18% CAGR.
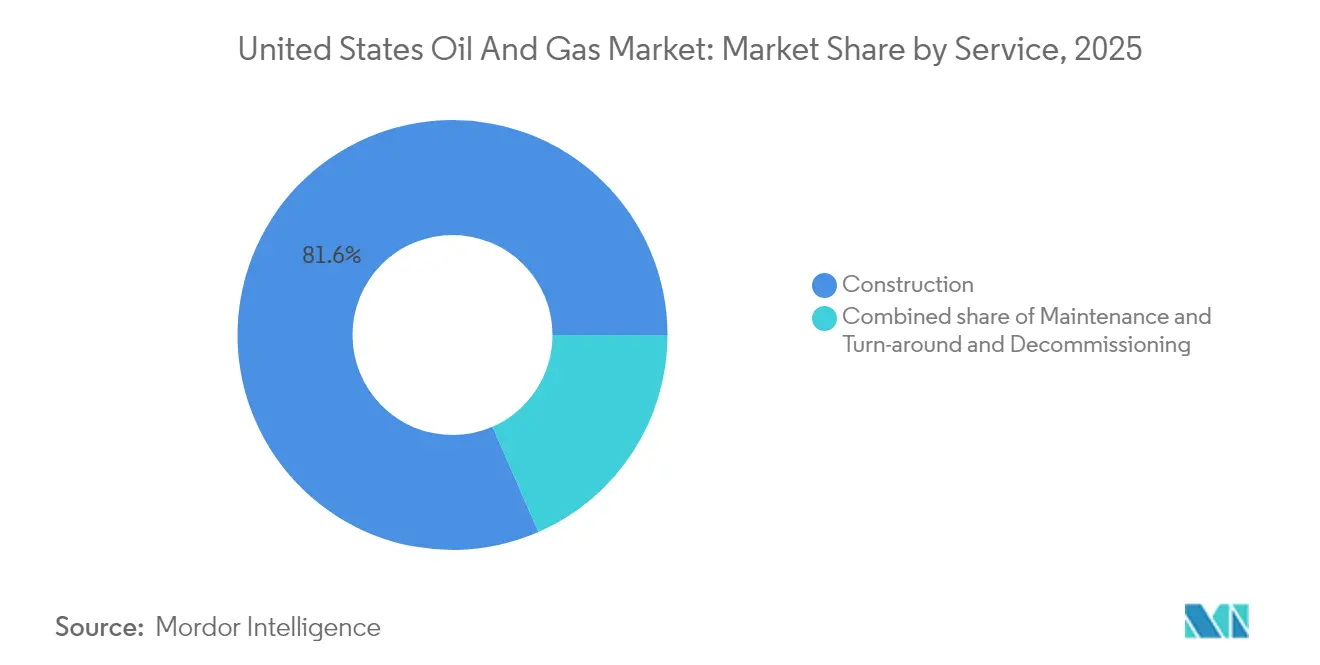
- By service, construction services accounted for 81.55% of the US oil and gas market size in 2025; decommissioning is projected to expand at a 6.72% CAGR through 2031.
Note: Market size and forecast figures in this report are generated using Mordor Intelligence’s proprietary estimation framework, updated with the latest available data and insights as of 2026.
United States Oil And Gas Market Trends and Insights
Drivers Impact Analysis*
| Driver | (~) % Impact on CAGR Forecast | Geographic Relevance | Impact Timeline |
|---|---|---|---|
| Tight-oil productivity gains in the Permian | +1.2% | Texas, New Mexico core basins | Medium term (2-4 years) |
| Surging LNG export capacity (new Gulf Coast trains) | +0.9% | Gulf Coast states, national spillover | Long term (≥ 4 years) |
| AI-driven seismic analytics for marginal well recovery | +0.6% | Unconventional plays nationwide | Medium term (2-4 years) |
| IRA 45Q & 45V tax credits lowering CCS costs | +0.4% | Industrial corridors, Gulf Coast | Long term (≥ 4 years) |
| Corporate green-bond funding for midstream build-out | +0.3% | Pipeline corridors, processing hubs | Medium term (2-4 years) |
| Niche petro-feedstock demand from advanced plastics | +0.2% | Gulf Coast petrochemical complexes | Long term (≥ 4 years) |
| Source: Mordor Intelligence | |||
Tight-oil Productivity Gains in the Permian
Advanced completion designs and AI-guided drilling lifted Permian Basin output to 6.3 million barrels per day in 2024, representing 60% of total US growth despite a leaner rig fleet. Longer laterals, higher proppant loading, and real-time frac optimization push recovery per well higher while trimming costs. ExxonMobil’s integration of Pioneer aims for a further 15% uplift through standardized execution and shared infrastructure.(2)Halliburton Company, "Form 10-Q Quarterly Report," sec.gov Independent drillers mirror these tactics to remain competitive. Efficiency, therefore, anchors continued output gains that fortify the US oil and gas market against price swings
Surging LNG Export Capacity
New Gulf Coast liquefaction trains reshape demand by linking domestic supply to global price premia. Venture Global’s Plaquemines terminal added 20 million tpa capacity in 2024, with Golden Pass to follow at 15.6 million tpa.(3)Federal Energy Regulatory Commission, “LNG Monthly Report,” FERC, ferc.gov The export surge boosts Appalachian and Haynesville drilling, while USD 15 billion of new pipelines funnel volumes south. Closer alignment with world markets tempers seasonal Henry Hub volatility, strengthening forward visibility for producers and midstream players, and reinforcing expansion in the US oil and gas market.
AI-driven Seismic Analytics for Marginal Well Recovery
Halliburton’s DecisionSpace platform processes seismic data 10× faster than prior workflows and identifies sweet spots with 85% accuracy. Operators in mature basins leverage these insights to re-enter legacy acreage, reducing drilling days and increasing initial production rates by 15%, as demonstrated by ConocoPhillips on Alaska’s North Slope. As computing costs fall, adoption widens, reinforcing a technology race that underpins productivity leadership in the US oil and gas market.
IRA 45Q & 45V Tax Credits Lowering CCS Costs
Inflation Reduction Act credits of up to USD 85 per ton for captured CO₂ and as high as USD 3 per kilogram for clean hydrogen narrow the economic gap for large-scale CCS hubs.(4)Internal Revenue Service, “Notice 2024-36: Clean Hydrogen Production Credit,” IRS, irs.gov ExxonMobil pledged USD 4 billion to develop a Gulf Coast hub able to store 50 million tons annually by 2030, ExxonMobil.com. The policy certainty boosts new revenue streams and drives cross-sector partnerships, reinforcing decarbonization trends within the US oil and gas market.
Restraints Impact Analysis*
| Restraint | (~) % Impact on CAGR Forecast | Geographic Relevance | Impact Timeline |
|---|---|---|---|
| Methane-fee compliance costs under EPA OOOOb/c | -0.8% | National, concentrated in major basins | Short term (≤ 2 years) |
| Water-stress limits on Permian fracturing | -0.5% | West Texas, Southeast New Mexico | Medium term (2-4 years) |
| Growing state-level setback rules (e.g., CO, NM) | -0.4% | Colorado, New Mexico, select states | Short term (≤ 2 years) |
| Persistent WTI-Brent discount hurting exports | -0.3% | Gulf Coast export terminals, national | Medium term (2-4 years) |
| Source: Mordor Intelligence | |||
Methane-fee Compliance Costs Under EPA OOOOb/c
Beginning in 2024, methane emissions exceeding set thresholds incur fees starting at USD 900 per metric ton and rising to USD 1,500 by 2026.(5)Environmental Protection Agency, “Methane Emissions Charge for Oil and Gas Facilities,” EPA, epa.gov Added monitoring and repair programs raise operating costs by USD 2-4 per barrel for typical shale wells, hitting smaller producers hardest. Compliance demands speed consolidation and quick adoption of technology, such as continuous leak detection, to alter cost structures within the US oil and gas market.
Water-stress Limits on Permian Fracturing
The Ogallala Aquifer has fallen by up to 15 feet in parts of West Texas, forcing stricter water allocations.(6)US Geological Survey, “High Plains Aquifer Water-Level and Storage Changes,” USGS, usgs.gov Operators invest in recycling systems, yet drought periods still create scheduling bottlenecks. Pioneer recycled 99% of produced water in 2024, cutting freshwater use by 75% from 2020 but noting constraints during peak irrigation seasons. Higher costs and potential delays temper growth expectations in the US oil and gas market.
*Our forecasts treat driver/restraint impacts as directional, not additive. The impact forecasts reflect baseline growth, mix effects, and variable interactions.
Segment Analysis
By Sector: Upstream Investments Drive Market Leadership
Upstream claimed 71.85% of the US oil and gas market size in 2025 and is on track for a 4.84% CAGR to 2031. Midstream captured 18.40%, buoyed by pipeline additions and LNG terminal build-outs, while downstream refining held 9.75% amid capacity limits and tighter emissions rules. Operators now target internal rates above 15% at USD 60 oil, steering capital toward high-return shale laterals and select long-cycle projects. ConocoPhillips’ Willow development illustrates the shift, with 30-year reserves offering cash-flow depth rare in short-cycle shale projects. Drilling efficiency and disciplined reinvestment keep the upstream segment at the center of continued gains in the US oil and gas market.
Upstream’s dominance rests on rapid productivity gains that hold costs near sub-USD 40 per barrel breakevens. Midstream remains an opportunity-rich sector as LNG growth drives storage and takeaway needs, yet capital discipline tempers speculative projects. Downstream margins are tightening amid competition from renewable diesel and the cost of regulatory upgrades. Together, these dynamics reinforce the upstream sector’s outsized influence on revenue trends within the US oil and gas market.


By Location: Offshore Revival Challenges Onshore Dominance
Onshore activity held 73.25% of the US oil and gas market share in 2025, but offshore deepwater projects are projected to post a sharper 5.18% CAGR through 2031. Shell’s Whale field began flowing in 2024, validated by lower development costs resulting from the use of standardized subsea systems. Operators bid USD 382 million across 73 Gulf tracts that same year, signaling a renewed appetite for deepwater. The offshore resurgence anchors growth against onshore headwinds such as drilling setbacks in Colorado that removed 85% of locations in some counties.
While shale remains critical, the depletion of tier-one inventory pushes producers to explore fringe acreage or deeper horizons, which carry higher costs. Offshore, by contrast, offers multi-decade reserves and clearer permitting timelines. This geographic diversification supports resilience in the US oil and gas market even as regulatory risk rises on land.
By Service: Decommissioning Emerges as Growth Driver
Construction services accounted for 81.55% of the US oil and gas market size in 2025, while decommissioning is the fastest-growing segment at a 6.72% CAGR. Roughly 2,700 offshore structures and thousands of aging onshore wells must be dismantled over the next decade. TechnipFMC secured USD 1.2 billion in related contracts in 2024, leveraging its heavy-lift vessels and subsea expertise. Maintenance services fill the remaining share, buoyed by mandatory turnarounds that ensure compliance with emissions rules.
Bonding requirements are tightening, compelling operators to demonstrate future abandonment funding before obtaining permits. This framework creates a visible backlog of work that underpins revenue stability for specialty contractors. Decommissioning, therefore, stands out as a structural growth lever inside the US oil and gas market.
Geography Analysis
Texas and New Mexico supplied 64.7% of US crude in 2025, with the Permian rising 9.9% year over year to 6.38 million barrels per day. High-quality rock, abundant infrastructure, and permissive regulations keep the basin central to the US oil and gas market. North Dakota’s Bakken added 1.08 million barrels per day, while Colorado’s DJ and Pennsylvania’s Marcellus anchored gas volumes that feed LNG trains.
Gulf Coast states are pivotal, as 89.5% of export liquefaction is located in Texas and Louisiana, with plans to reach a 39.6 bcf/d capacity by 2028. This expansion reduces basis differentials and intertwines domestic pricing with global markets, enhancing revenue visibility for upstream and midstream operators.
Appalachia delivered 34.6% of US gas output in 2025. Despite permitting friction, proximity to Northeast load centers and multiple pipeline corridors sustains competitive economics. Alaska’s long-cycle Willow project adds supply diversity and optionality for future Asia-oriented LNG exports. Collectively, regional specialization and infrastructure depth underpin the geographic robustness of the US oil and gas market.
Regulatory Landscape
US oil and gas regulation is centered on federal air-emissions compliance under the Clean Air Act and on approvals that affect upstream, midstream, and export infrastructure. In April 2026, the US Environmental Protection Agency (EPA) finalized technical revisions to the 2024 New Source Performance Standards and Emission Guidelines for oil and gas operations (OOOOb/c), adjusting items such as flare-related requirements and monitoring provisions to reduce compliance burden while keeping the framework for methane and VOC controls in place.
On the energy security and supply side, the US Department of Energy (DOE) continues to shape market conditions through LNG export authorizations and targeted R&D support. DOE reported the authorization or re-authorization of more than 17.6 Bcf/d of LNG exports during 2025, reinforcing the export-oriented shift in US gas demand. In July 2026, DOE also announced up to USD 150 million in funding via the Hydrocarbons and Geothermal Energy Office (HGEO) to improve unconventional recovery, fracture characterization, and produced water management, which directly influences operating practices and compliance investment in major basins.
Competitive Landscape
The top five operators controlled about 35% of US production in 2024, indicating moderate concentration. ExxonMobil’s USD 60 billion Pioneer deal and Chevron’s USD 53 billion acquisition of Hess tightened the Permian and deepwater portfolios, enabling cost synergies and extending reserve life. ConocoPhillips’ USD 17.1 billion Marathon merger extended the consolidation wave into mid-caps, while Diamondback – Endeavor’s USD 26 billion tie-up illustrated continued scale building.
Technology provides a decisive edge. Halliburton’s DecisionSpace 365 accelerates interpretation and completion design, enabling clients to drill faster and more cost-effectively. Early adopters secure performance advantages that widen the cost gap over smaller rivals. Carbon capture, offshore decommissioning, and the integration of renewable fuels open new revenue streams, leveraging incumbent logistics and reservoir expertise.
Regulation amplifies competitive barriers. Larger firms absorb methane-fee compliance and water-management investments more readily than small, independent firms, furthering consolidation. Overall, disciplined capital allocation, technology uptake, and regulatory agility define competitive positioning in the US oil and gas market.
United States Oil And Gas Industry Leaders
-
Exxon Mobil
-
Chevron
-
ConocoPhillips
-
EOG Resources
-
Occidental Petroleum
- *Disclaimer: Major Players sorted in no particular order

Market Opportunities and Future Outlook
The main whitespace is where decarbonization-linked projects align with existing production and refining assets, especially carbon capture, CO2 utilization, and produced-water management. DOE selections under carbon management programs create clear entry points for oilfield services, midstream CO2 logistics, and operators. In May 2026, DOE selected a USD 36 million University of North Dakota project to advance CO2-based enhanced oil recovery (EOR) in the Bakken, and DOE-backed carbon capture pilots at operating refineries, such as the Delek US Big Spring Refinery project (selected in February 2024 to capture 145,000 metric tons per year of CO2), support demand for capture equipment, integration engineering, and storage or utilization pathways.
A second opportunity set is tied to gas supply chains built around LNG exports, along with the pipeline, compression, and gathering expansions that connect producing regions to Gulf Coast liquefaction. EIA highlights the pull-through, with LNG exports forecast to reach 17.4 Bcf/d in 2026. This increase is supported by ramp-ups at Plaquemines LNG, Corpus Christi Stage 3, and Golden Pass LNG, which reinforces demand for reliability upgrades, debottlenecking services, and emissions monitoring across upstream and midstream systems. Offshore resource appraisal and leasing groundwork also remains a structural lane, with BOEM's 2026 National Assessment of Undiscovered Oil and Gas Resources of the Outer Continental Shelf providing updated technical basis that can shape future leasing and exploration prioritization.
Recent Industry Developments
- July 2026: The US Department of Energy (DOE) announced up to USD 150 million in funding through the Hydrocarbons and Geothermal Energy Office (HGEO) to improve unconventional oil and gas recovery and produced water management. The program strengthens the pipeline of field-deployable technologies in tight-oil basins, supporting service demand for subsurface characterization, water recycling, and productivity enhancements.
- June 2026: Western Midstream announced the start-up of its JIP 2 produced-water treatment pilot facility in Reeves County, Texas, as part of a joint industry effort involving ExxonMobil, Chevron, and ConocoPhillips. Demonstrated water treatment and reuse at scale addresses Permian water-stress constraints and creates a clearer commercial path for midstream-style water infrastructure alongside hydrocarbon takeaway.
- November 2024: ConocoPhillips completed its USD 17.1 billion acquisition of Marathon Oil, expanding scale across US unconventional positions. The combination elevated portfolio integration and execution standardization, reinforcing cost and infrastructure advantages for large operators in a compliance-tight operating environment.


Research Methodology Framework and Report Scope
Market Definition and Coverage
For this study, the United States oil and gas market is defined as the value generated from upstream, midstream, and downstream activities within the country, tracked in USD across the value chain and supported by observable activity levels.
Scope exclusions: We exclude indirect spillovers such as broader energy equipment manufacturing, general utilities, and non-oil-and-gas end markets that are not directly part of core oil and gas operations.
Segmentation Overview
-
By Sector
- Upstream
- Midstream
- Downstream
-
By Location
- Onshore
- Offshore
-
By Service
- Construction
- Maintenance and Turn-around
- Decommissioning
Data Sources, Market Sizing, and Validation
Desk Research
Desk research started with public series that anchor industry activity levels, using EIA data for crude oil and natural gas production, consumption, storage, and rig productivity. Where geology or offshore context was needed, we also referenced USGS and NOAA materials.
For trade and flows, we used sources such as the US Census Bureau trade statistics and public customs releases to confirm import and export direction. We then used high-level indicators from the Federal Reserve for industrial production and inflation context to support pricing assumptions.
To cross-check the industry structure, we reviewed company annual reports, investor presentations, and public filings. We also relied on association and regulator websites for pipeline and safety context, including PHMSA. In a few places, paid subscriptions were used only for company financials and news intelligence, plus shipment-level import and export databases to sanity check selected flow patterns. This list is illustrative only, and other public sources were also referenced for data collection, validation, and clarification.
Primary Interviews and Surveys
Primary work was used to pressure-test desk assumptions, especially around how revenue pools are counted across upstream, midstream, and downstream, and how pricing and utilization move through cycles. We spoke with operators, service providers, midstream asset owners, refiners, distributors, and industry consultants across the United States, so gaps in public datasets could be filled with realistic ranges and decision rules.
Distribution of primary research fieldwork respondents
| Company type | Respondent position | Region |
|---|---|---|
| Top tier: 30% | CXOs: 19% | |
| Mid tier: 48% | Functional/Unit leaders: 24% | |
| Smaller Players: 22% | Managers: 57% |
Market-Sizing & Forecasting
The core sizing logic was built using top-down and bottom-up together, with the main totals reconstructed from observable US activity series and then cross-checked using selective roll-ups. In the top-down step, we link production and consumption volumes for crude oil and natural gas to value pools through pricing, utilization, and service intensity, then allocate across upstream, midstream, and downstream based on how assets are used in practice.
To keep the model grounded, we used a set of fingerprints that are hard to ignore in this market: crude oil and natural gas production and consumption levels, rig and completion activity, refinery throughput and utilization, and pipeline and export capacity signals where relevant. Inputs also include WTI and Henry Hub price direction, the oil to gas mix shifts over time, and the onshore versus offshore activity mix, which then shape the revenue split and the growth pattern.
For forecasting, scenario analysis was used so base-case paths for commodity prices, drilling pace, and refinery utilization could be adjusted in a controlled way when the outlook changes. Bottom-up approximations were applied as a check, such as sampled ASP-by-activity calculations for selected services and simple channel checks for midstream and downstream activity. Where gaps remained, we used conservative ranges, then validated them again through expert feedback.
Data Validation & Update Cycle
Outputs are validated through triangulation across independent signals, followed by variance checks to catch totals that do not reconcile with key activity markers like production, consumption, and throughput. When a number breaks the expected relationship, we review the underlying assumption and revisit supporting sources before accepting the revised estimate.
A second analyst review is completed before sign-off, and primary contacts are re-contacted if a material mismatch remains or if a new event changes the market direction. The report is refreshed annually, and interim updates are made when major policy, price, or capacity changes occur. Right before delivery, a final pass is done so clients receive the most current view.
Mordor Intelligence's United States Oil and Gas Market Estimate Compared With Other Published Estimates
Published market sizes for the United States oil and gas industry often do not line up because different teams count different revenue pools, and they also choose different base years and pricing conventions. Another frequent reason is that some estimates start from broad macro totals, while others are reconstructed from industry activity signals and then adjusted through expert checks.
Some published figures expand scope to include fuel retailing and broader energy value pools, which can push the number into the hundreds of billions or even trillions. In Mordor Intelligence sizing, the value is limited to the oil and gas value chain activities as defined in the study, and totals are kept consistent with production and consumption indicators plus sector split logic for upstream, midstream, and downstream.
Benchmark comparison
| Source | Market Size | Gaps in Research Methodology |
|---|---|---|
| Mordor Intelligence | USD 142.81 B (2025) | |
| Industry Data Publisher A | USD 474.50 B (2025) | Uses a broader accounting of value chain revenue pools and can blend refining, logistics, and distribution value more expansively, which typically lifts totals even when activity volumes are similar. |
| Global Media Publisher B | USD 1.61 T (2025) | Appears to align closer to a very wide industry value concept that can include large downstream and distribution value pools, plus different pricing and currency timing assumptions that amplify the headline total. |
The spread in the table mainly comes from how wide the counted revenue pool is, and from how price and activity are translated into dollars for the same year. By keeping the model tied to observable production, consumption, and throughput checks, and by applying repeatable allocation rules across sectors, the estimate stays transparent enough for planning and sensitivity testing.


Key Questions Answered in the Report
What is the projected value of the US oil and gas market by 2031?
The market is expected to reach USD 186.63 billion by 2031, growing at a 4.56% CAGR.
Which segment holds the largest share of revenue?
Upstream accounted for 71.85% of revenue in 2025 thanks to intensive unconventional drilling.
Why are LNG exports important to U.S. producers?
New Gulf Coast terminals unlock higher international prices, driving demand for domestic gas and underpinning pipeline expansion.
How are methane regulations affecting operators?
EPA fees starting at USD 900 per ton plus monitoring costs add USD 2-4 per barrel to shale well operating expenses, pushing efficiency upgrades.
Which geographic area leads U.S. crude production?
The Permian Basin in Texas and New Mexico produced 6.38 million barrels per day in 2025, or 59.2% of national growth.
What drives growth in decommissioning services?
Regulatory enforcement and aging infrastructure require removal of 2,700 offshore structures and many onshore wells, boosting a 6.72% CAGR in this segment.
Page last updated on:


