
Market Overview
| Study Period | 2021 - 2031 |
|---|---|
| Market Size (2026) | USD 6.59 Billion |
| Market Size (2031) | USD 8.12 Billion |
| Growth Rate (2026 - 2031) | 4.27 % |
| Fastest Growing Market | Middle East and Africa |
| Largest Market | Middle East and Africa |
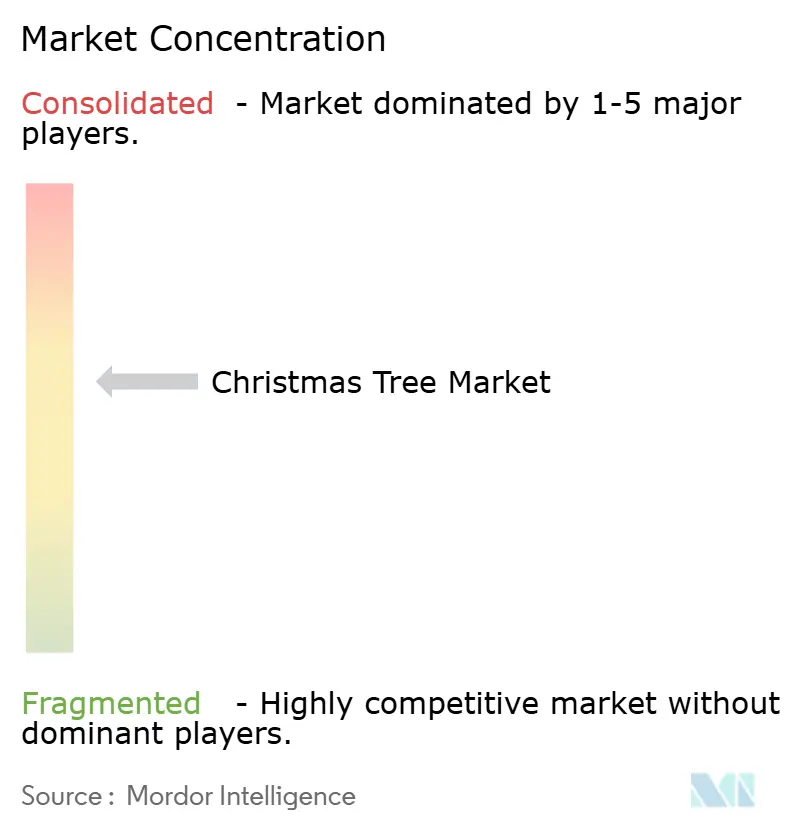
| Market Concentration | Medium |
Major Players *Disclaimer: Major Players sorted in no particular order Image © Mordor Intelligence. Reuse requires attribution under CC BY 4.0. | |
Christmas Tree Market Analysis by Mordor Intelligence
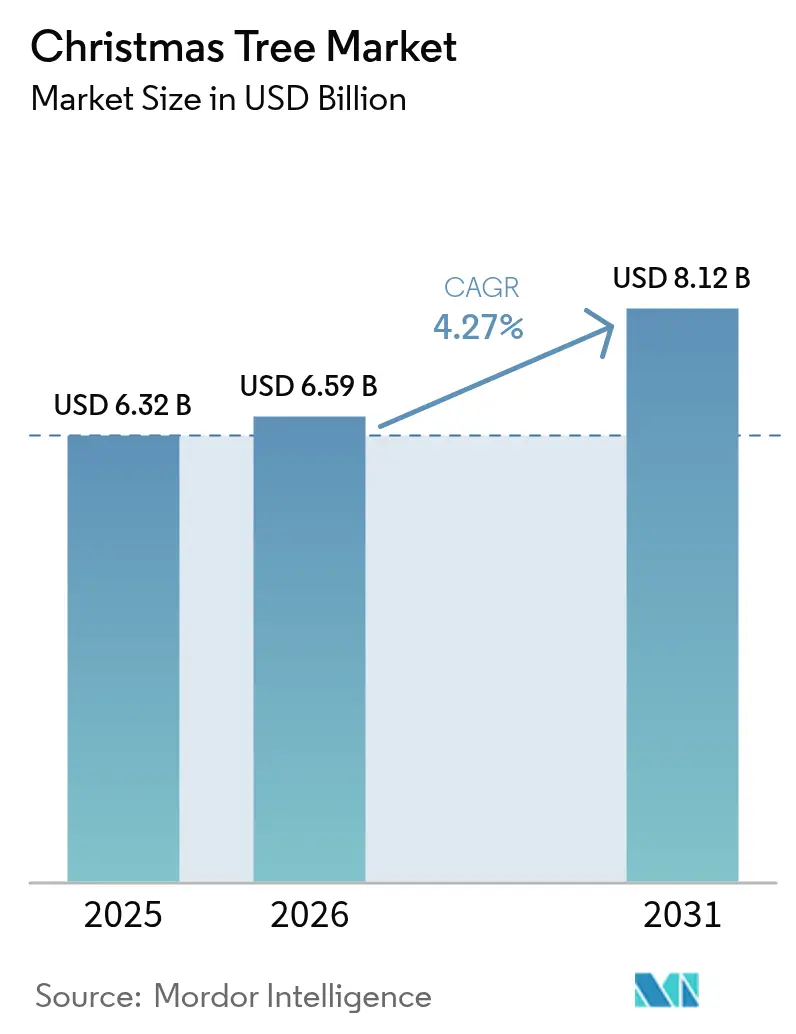
The Christmas Tree market size is expected to grow from USD 6.32 billion in 2025 to USD 6.59 billion in 2026 and is forecast to reach USD 8.12 billion by 2031 at 4.27% CAGR over 2026-2031.
Steady demand comes from a new wave of deep- and ultra-deepwater final investment decisions (FIDs), wider adoption of AI-enabled subsea controls, and the gradual standardization of modular, hybrid tree designs. Operators are redeploying capital toward high-pressure reservoirs, where 20,000 psi systems unlock resources once deemed uneconomic. At the same time, growing carbon-capture-and-storage (CCS) projects extend the application range of tree technology, turning legacy wells into dual hydrocarbon and CO₂ injection assets. Supply-chain friction for high-integrity forgings and crude-price swings above USD 15/bbl remain the largest headwinds, but the underlying shift toward subsea tie-backs and brownfield optimization continues to insulate the Christmas tree market from wider energy-cycle volatility.
Key Report Takeaways
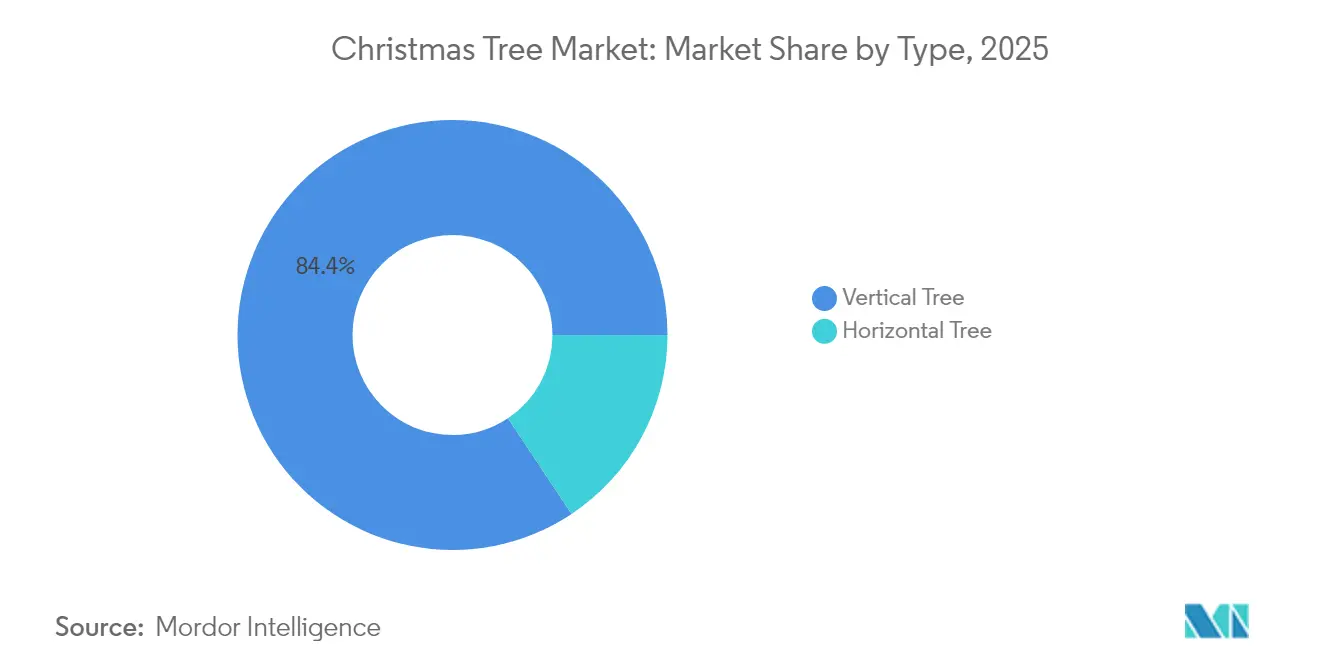
- By type, vertical trees captured 84.35% of the Christmas tree market share in 2025, while horizontal trees are projected to expand at a 4.85% CAGR through 2031.
- By location of deployment, onshore systems accounted for 76.45% share of the Christmas tree market size in 2025, whereas offshore installations are forecast to grow at 5.82% CAGR.
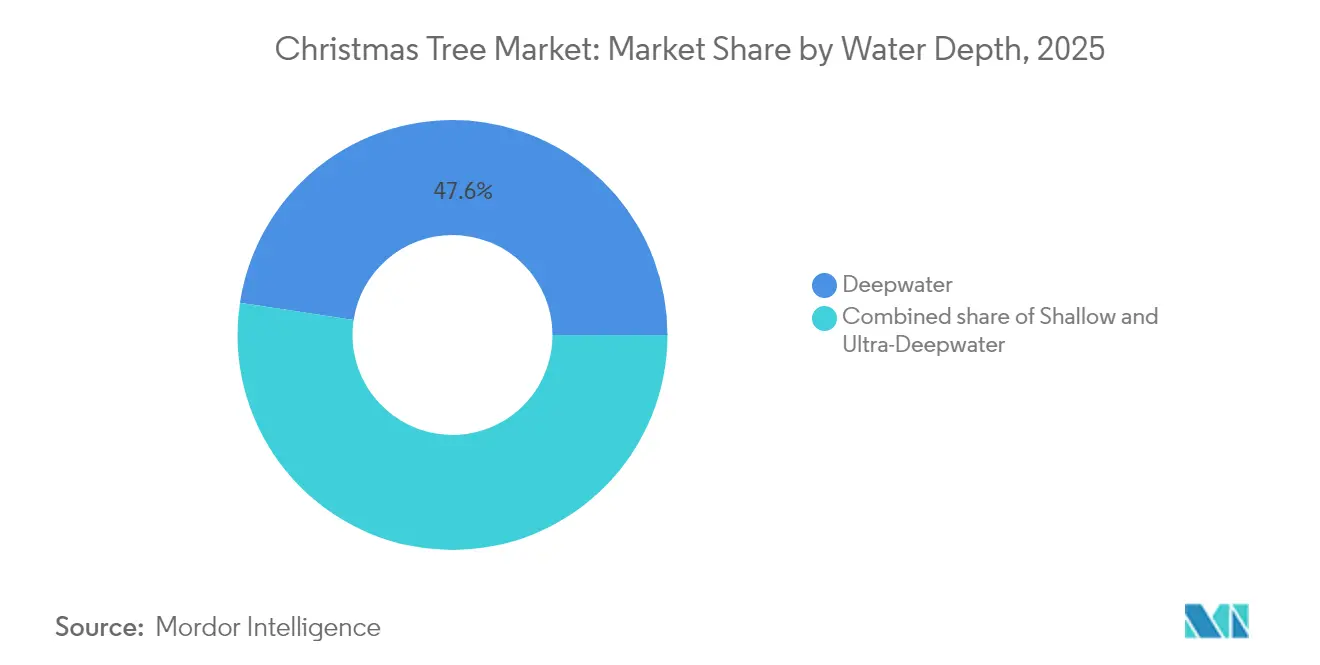
- By water depth, deepwater installations held 47.60% of the Christmas tree market size in 2025; the ultra-deepwater segment is set to rise at a 5.75% CAGR to 2031.
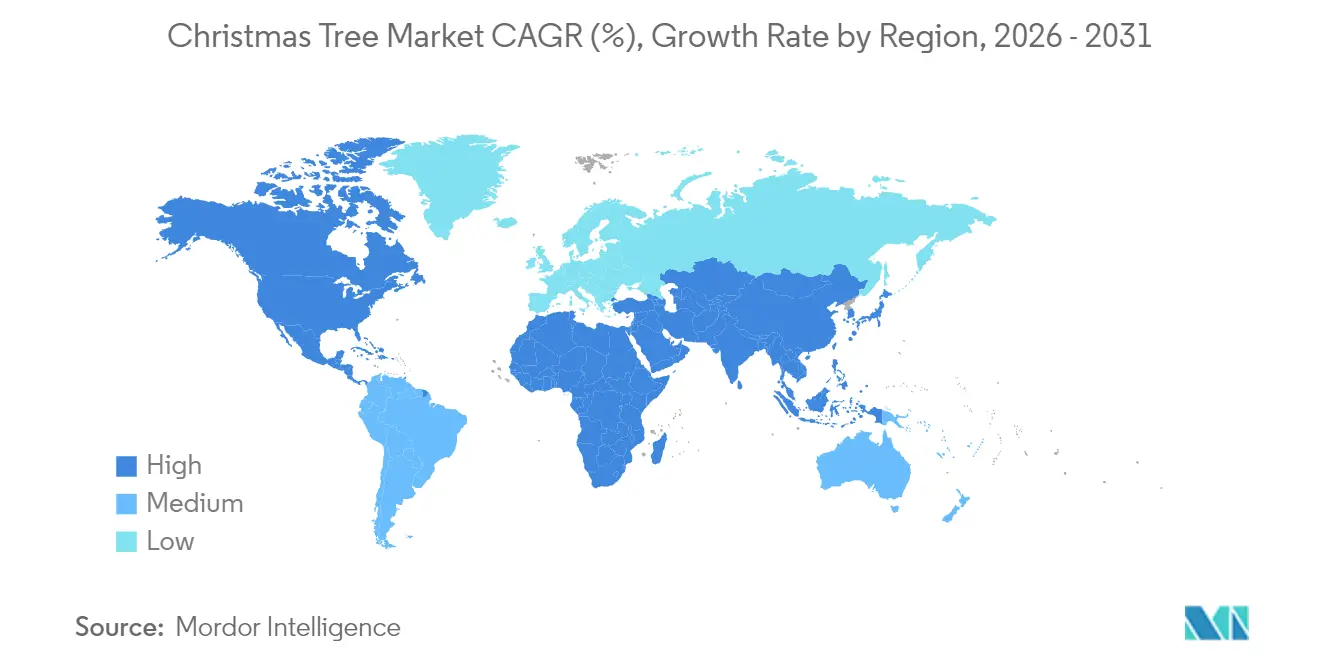
- By geography, the Middle East and Africa region commanded 42.65% of the Christmas tree market share in 2025 and is expected to maintain 4.82% CAGR during the outlook period.
Note: Market size and forecast figures in this report are generated using Mordor Intelligence’s proprietary estimation framework, updated with the latest available data and insights as of 2026.
Market Trends and Insights
Drivers Impact Analysis of Christmas Tree Market*
| Driver | (~) % Impact on CAGR Forecast | Geographic Relevance | Impact Timeline |
|---|---|---|---|
| Deep-water FID resurgence boosts tree demand | +1.20% | Gulf of Mexico, Brazil Santos Basin, West Africa | Medium term (2-4 years) |
| Integration of subsea hardware & AI-driven controls | +0.80% | North America, Europe, Asia-Pacific tech hubs | Long term (≥ 4 years) |
| Latin-America's ultra-deep pre-salt project pipeline | +0.90% | South America (Brazil, Argentina, Colombia) | Medium term (2-4 years) |
| CCS & subsea tie-backs repurposing existing wells | +0.50% | North Sea, Gulf of Mexico, global | Long term (≥ 4 years) |
| Standardized modular “hybrid” tree designs cut CAPEX | +0.70% | Brazil, Norway, UK North Sea | Short term (≤ 2 years) |
| National-oil-company local-content mandates | +0.40% | Middle East, Africa, Latin America | Medium term (2-4 years) |
| Source: Mordor Intelligence | |||


Deep-water FID Resurgence Boosts Tree Demand
Final investment decisions for deepwater projects accelerated in 2024, headlined by BP’s Kaskida (USD 5 billion, six 20 ksi wells, 80,000 bpd from 2029).[1] TotalEnergies’ GranMorgu in Suriname (USD 10.5 billion, 220,000 bpd)[2] and Shell’s Gato do Mato in Brazil (120,000 bpd) underscore the scale of sanctioned capital. These projects funnel more than USD 20 billion toward subsea hardware over the next five years, directly lifting demand in the Christmas tree market. Operators’ willingness to adopt 20 ksi designs signals confidence in drilling technologies that lower lifecycle cost per barrel, reinforcing a multi-year order pipeline for high-specification trees.
Integration of Subsea Hardware & AI-Driven Controls
Artificial-intelligence platforms now monitor valve positions, flow rates, and pressure anomalies in real time, delivering predictive maintenance that cuts unplanned downtime. ADNOC generated USD 500 million in value from AI in 2023 while lowering CO₂ emissions. Umbilical-less control schemes further reduce capex in ultra-deepwater settings where traditional umbilicals are cost-prohibitive. Remote operations centers oversee multiple wells, trimming offshore staffing needs and elevating safety outcomes. Machine-learning algorithms refine choke-valve adjustments to maximize reservoir drawdown, lengthening equipment life. These capabilities position AI-enabled trees as core infrastructure for new offshore developments where extreme depth or weather challenges require manual intervention.
Latin-America's Ultra-Deep Pre-Salt Project Pipeline
Petrobras plans 280 new wells by 2028 and has contracted P-84 and P-85 FPSOs, each rated at 225,000 bpd. High CO₂ content in the pre-salt demands corrosion-resistant alloys and advanced sealing, fostering material-science innovation. Argentina’s Vaca Muerta offshore extensions and Colombia’s Caribbean acreage add longer-term upside, though Brazil remains the anchor market. Local-content rules requiring 20-25% domestic sourcing compel suppliers to form joint ventures or license technology, reshaping supply chains across the Southern Cone.
CCS & Subsea Tie-backs Repurposing Existing Wells
Equinor’s Northern Lights project illustrates how dedicated CO₂-injection trees can coexist with hydrocarbon production on shared infrastructure. Super-critical CO₂ foam techniques improve oil recovery while storing carbon, necessitating dual-purpose valve blocks and specialized elastomers. Brownfield tie-backs extend field life at a fraction of greenfield capex, as operators reuse host facilities and reconfigure existing trees for secondary or tertiary recovery. Such hybrid deployments reinforce the Christmas tree market by opening fresh revenue channels tied to the energy transition agenda.
Restraints Impact Analysis of Christmas Tree Market*
| Restraint | (~) % Impact on CAGR Forecast | Geographic Relevance | Impact Timeline |
|---|---|---|---|
| Supply-chain bottlenecks for high-integrity forgings | -0.60% | North America, Europe | Short term (≤ 2 years) |
| Volatile Brent > USD 15/bbl swing deters long-cycle FIDs | -0.90% | Global | Medium term (2-4 years) |
| Growing investor scrutiny on Scope-1 emissions | -0.40% | North America, Europe, Asia-Pacific | Long term (≥ 4 years) |
| Limited rig availability drives day-rate inflation | -0.70% | Global | Short term (≤ 2 years) |
| Source: Mordor Intelligence | |||
Supply-Chain Bottlenecks for High-Integrity Forgings
Critical forgings manufactured from AerMet 100 or MP35N alloys face 12-18-month lead times as only a handful of mills meet the required non-destructive-testing standards. Higher volumes of 20 ksi hardware exacerbate the squeeze because forgings must endure ultra-high pressures without hydrogen-induced stress cracking. With offshore EPC contract awards topping USD 52 billion in 2024, component demand outpaces qualified capacity. Operators are therefore locking in long-lead items earlier, increasing project-planning complexity.
Volatile Brent Above USD 15/bbl Swing Deters Long-Cycle FIDs
Price swings from USD 66 to USD 81 between 2024 and 2026 cloud project economics for deepwater ventures that typically require USD 60–70 breakevens. Research linking interest-rate uncertainty with future oil-price variance heightens boardroom caution. While OPEC+ curbs aim to stabilize the market, compliance risks persist, prompting some operators to defer FIDs and temper short-term orders in the Christmas tree market.
*Our forecasts treat driver/restraint impacts as directional, not additive. The impact forecasts reflect baseline growth, mix effects, and variable interactions.
Christmas Tree Market Segment Analysis
By Type:
Vertical Trees Dominate Despite Horizontal InnovationVertical systems, long the industry’s default, held 84.35% share of the Christmas tree market in 2025. Their compatibility with legacy wellheads and decades of accumulated operating data underpin sustained demand. Conversely, horizontal units are gaining ground on high-intervention wells where ESP retrieval is frequent, translating to a 4.85% CAGR outlook. The Christmas tree market size for vertical systems is slated to reach USD 6.83 billion by 2031, whereas horizontal configurations, though smaller, are moving into higher-pressure service windows once limited to vertical designs.
Ongoing R&D introduces “hybrid” architectures that marry vertical tubing-head profiles with horizontal valve blocks. For example, OneSubsea’s monobore design streamlines completion timing for operators such as BP and TotalEnergies. Spool trees, incorporating side-mount valves, allow workovers without full tree removal and serve as a technological bridge between traditional forms. The interplay of field-proven reliability and intervention efficiency keeps both designs relevant and boosts optionality for end users.


By Location of Deployment:
Onshore Stability Meets Offshore GrowthOnshore installations retain a 76.45% hold on the Christmas tree market size, benefiting from mature infrastructure and lower logistical complexity. Tight-oil and shale gas plays in North America continue to order advanced programmable trees that mirror offshore digital-control sophistication. Yet offshore orders are poised for 5.82% CAGR as subsea tie-backs to existing hubs, such as Ithaca Energy’s Cambo in the UK North Sea, become cost-competitive.
Deepwater projects in China and Southeast Asia spotlight offshore upside: the nation’s first domestic subsea tree, weighing 22 t and rated to 17 MPa, entered service in 2024. Offshore gains also reflect CCS schemes where depleted reservoirs lie beneath platforms already wired for subsea operations, further integrating carbon management into the mainstream Christmas tree market.
By Water Depth:
Deepwater Leadership Amid Ultra-Deepwater AccelerationDeepwater wells between 300 m and 1,500 m comprise 47.60% of the Christmas tree market size and will continue to absorb the bulk of capex through 2031. Their popularity rests on an equilibrium between manageable technical risk and attractive reserve sizes. Ultra-deepwater (above 1,500 m) is expanding faster at a 5.75% CAGR, propelled by Brazil’s pre-salt, Suriname’s emerging basins, and high-pressure US Gulf prospects such as Kaskida.
Ultra-deep programs rely on 20 ksi pressure envelopes and more exotic alloy selections. Horizontal tree adoption is particularly brisk in the Christmas tree industry because smaller footprints simplify installation from dynamically positioned vessels. Shallow-water brownfields remain relevant, primarily through enhanced-recovery tie-backs that upgrade existing vertical trees to current API standards, leveraging parts commonality to keep control-system retrofits economical.
Geography Analysis
MEA Christmas Tree Market
The Middle East and Africa region dominates the Christmas tree market with a 42.65% share in 2025 and retains a 4.82% growth trajectory through 2031. National oil companies in the Arabian Gulf push brownfield recompletions while West Africa’s frontier finds, notably in Namibia, insert fresh greenfield demand. Local-content statutes of 20-25% compel global OEMs to partner with regional workshops, accelerating skills transfer and fostering a nascent supply chain that, over time, is expected to moderate landed costs.
North America Christmas Tree Market
North America anchors a sizable slice of spending via Gulf of Mexico deepwater activity. Projects such as BP’s Paleogene 20 ksi programs and Mexico’s Trion, where Woodside Energy chose Dril-Quip wellhead systems, highlight the region’s appetite for high-pressure trees. Canada’s Atlantic offshore adds niche volumes, while US shale basins keep onshore volumes elevated despite price swings. Environmental permitting remains strict, nudging operators toward trees with embedded leak-detection sensors and lower fugitive-emission profiles.
Europe, South America and APAC Christmas Tree Market
South America is the growth engine thanks to Petrobras’ 280-well program and the construction of FPSOs capable of 225,000 bpd apiece. Emphasis on corrosion-resistant metallurgy and standardized connectors defines procurement specs across the region. Europe sustains steady orders in the North Sea, now increasingly linked to CCS initiatives such as Northern Lights, whereas Asia-Pacific broadens the map with Philippine, Malaysian, and Indonesian projects exploring deeper waters. Together, these trends diversify revenue streams, lessening over-reliance on any single basin and promoting resilience across the Christmas tree market.

Regulatory Landscape
In the United States, subsea and wellhead safety and barrier integrity requirements under 30 CFR Part 250 Subpart H guide equipment acceptance on the Outer Continental Shelf, with regulators requiring permit submissions and barrier verification for critical well-control components. The Bureau of Safety and Environmental Enforcement (BSEE) finalized an HPHT rule (89 FR 70732) that took effect in 2024, tightening performance and design expectations for equipment used in HPHT environments.
Globally, conformity to widely adopted technical standards supports procurement and approval pathways. API Spec 17D is a core reference for subsea wellhead and tree equipment design, with Addendum 2 taking effect in 2025, while API Spec 6A remains central for wellhead and tree equipment used across onshore and offshore projects. ISO 10423:2022 also supports international alignment for wellhead and tree requirements, and North Sea oversight continues to emphasize environmental and safety consent decisions, reinforcing leak prevention and lifecycle integrity expectations for installed tree systems.
Competitive Landscape
The Christmas tree industry exhibits moderate concentration, with TechnipFMC, SLB OneSubsea, Baker Hughes, and Aker Solutions leading. Proposed consolidation, namely the Saipem-Subsea7 merger into “Saipem7” with a EUR 43 billion backlog, would add scale and broaden service depth from oil and gas to CCS and renewables.[4]Saipem, “Saipem-Subsea7 Merger Outline,” saipem.com SLB’s all-stock purchase of ChampionX introduces production chemicals and artificial-lift synergies valued at USD 400 million annually.[5]SLB, “ChampionX Acquisition Details,” slb.com
Technology remains the chief differentiator. Integrated alliances such as the Subsea Integration Alliance (SLB and Subsea7) deliver bundled engineering, procurement, construction, and installation (EPCI) scopes, lowering client interface risk. Modular tree lines in the Christmas tree industry, like Baker Hughes’ Aptara, shorten fabrication cycles and invite standardization, while Aker’s “all-electric” concept aims to eliminate hydraulic leakage risk. Regional challengers emerge where local-content rules erect protective barriers, carving out a share in assembly and service niches.
White-space opportunities lie in CCS-specific trees, subsea energy-storage interfaces, and hybrid production-injection configurations designed for late-life fields. Established OEMs leverage extensive installed bases and lifecycle-service portfolios to protect share, but nimble regional players can still penetrate via specialized offerings tied to local regulations. Consequently, competitive intensity is set to rise as decarbonization broadens the definition of addressable markets for the Christmas tree market.
Christmas Tree Industry Leaders
TechnipFMC
SLB (OneSubsea/Cameron)
Baker Hughes
Aker Solutions
Dril-Quip
- *Disclaimer: Major Players sorted in no particular order
Christmas Tree Market Companies Covered in this Report
- TechnipFMC PLC
- SLB (OneSubsea & Cameron)
- Baker Hughes Company
- Aker Solutions ASA
- Dril-Quip Inc.
- Halliburton Company
- NOV Inc.
- Weatherford International plc
- Yantai Jereh Petroleum Equipment
- Worldwide Oilfield Machine
- Shengji Group
- Oceaneering International
- Expro Group
- Forum Energy Technologies
- Kongsberg Gruppen ASA
- Siemens Energy AG
- ABB Ltd (Pressure Control)
- INTERA Ltd
- GE Vernova (Former GE Oil & Gas assets)
- Plexus Holdings plc

Market Opportunities and Future Outlook
Standardized subsea tie-back developments and repeatable delivery models reduce engineering and integration time for operators. In July 2026, Equinor awarded contracts totaling about NOK 6 billion for Norwegian Continental Shelf subsea tie-back projects, and SLB OneSubsea also received awards linked to Equinor subsea tie-back activity. Eni Baleine Phase 3 offshore Côte d'Ivoire received an EPC award in July 2026 covering subsea production systems, including trees for 13 wells.
Technology-driven whitespace is widening around electrification and retrofit pathways focused on reliability, emissions, and intervention costs. Progress from demonstration to deployment for all-electric subsea production concepts supports demand for electric actuation, digital diagnostics, and simplified controls, including retrofittable solutions designed to extend the life of installed hydraulic-tree fleets without full retrieval. Petrobras Sepia 2 (17 wells under a Subsea 7 SURF award in April 2026) reinforces the addressable scope for trees and associated long-lead components, while also encouraging local delivery and addressing forging and alloy bottlenecks.
Recent Industry Developments in Christmas Tree Market
- May 2026: TechnipFMC and TotalEnergies completed stack-up and system integration testing for shallow-water production tree units for TotalEnergies GranMorgu offshore Suriname. The milestone de-risks integration ahead of deployment and supports faster delivery schedules for standardized subsea production systems in emerging basins.
- October 2025: SLB OneSubsea secured contracts from PTTEP to deliver subsea production systems, including horizontal subsea trees, for deepwater gas fields offshore Malaysia (Alum, Bemban, Permai) and the Kikeh oil field. These awards reinforce supplier positioning in Asia-Pacific deepwater and increase demand for high-integration subsea tree and control packages.
- September 2024: SLB OneSubsea signed contracts with Petrobras to supply 19 subsea Christmas trees for the Sepia and Atapu fields in Brazil. The multiunit order underscores continued investment in pre-salt developments and supports the order pipeline for high-specification trees aligned with Brazil's deepwater operating conditions.


Christmas Tree Market Report Scope and Research Methodology
Market Definition and Coverage
For this report, the Christmas tree market is defined as the revenue generated from selling Christmas trees used for seasonal decoration, covering both natural and artificial trees across major geographies.
Scope exclusions: We exclude ornaments, tree stands, lights, and other add-on decorations that are bought separately from the tree itself.
Segments Covered in This Report
- By Type
- Horizontal Tree
- Vertical Tree
- By Location of Deployment
- Onshore
- Offshore
- By Water Depth
- Shallow (Below 300 m)
- Deepwater (300 to 1500 m)
- Ultra-Deepwater (Above 1500 m)
- By Geography
- North America
- United States
- Canada
- Mexico
- Europe
- United Kingdom
- Germany
- France
- Spain
- Nordic Countries
- Russia
- Rest of Europe
- Asia-Pacific
- China
- India
- Japan
- South Korea
- ASEAN Countries
- Rest of Asia-Pacific
- South America
- Brazil
- Argentina
- Colombia
- Rest of South America
- Middle East and Africa
- United Arab Emirates
- Saudi Arabia
- South Africa
- Egypt
- Rest of Middle East and Africa
- North America
Data Sources, Market Sizing, and Validation
Desk Research
To build the base understanding, we started with public, non-paywalled sources that can explain seasonality, household spending, trade flows, and how tree sales move across countries. Sources used include items such as US Census Bureau retail datasets, US International Trade Commission trade statistics, USDA updates on tree farms and related crops, Eurostat retail and trade series, and FAO forestry and land-use indicators.
After that, we relied on secondary reading to translate those macro signals into market inputs. This included annual reports and investor presentations for large sellers and distributors, association websites for growers and holiday retailers, and reputable press coverage on pricing and shortages during the season. In some cases, a paid subscription for company financials and news intelligence helped us check revenue splits and confirm expansion moves. We also used a shipment-level import-export database selectively to validate artificial tree inflows. These desk sources are not exhaustive, and we used additional public references for data collection, validation, and clarification.
Primary Interviews and Surveys
Primary work was used to pressure-test the desk model with real market behavior, especially around average selling prices, channel mix, and how demand shifts between natural and artificial trees. We spoke with a mix of growers, importers, wholesalers, retailers, and commercial buyers across the Americas, EMEA, and APAC, and we used that input to correct assumptions before finalizing the totals.
Distribution of primary research fieldwork respondents
| Company type | Respondent position | Region |
|---|---|---|
| Top tier: 29% | CXOs: 12% | APAC: 49% |
| Mid tier: 52% | Functional/Unit leaders: 30% | EMEA: 33% |
| Smaller Players: 19% | Managers: 58% | Americas: 18% |
Market-Sizing & Forecasting
The core sizing logic uses a top-down build that reconstructs demand from the seasonal shopper pool and retail spend patterns, then splits the result into natural and artificial trees using adoption signals gathered from interviews. Once the headline value is formed, we corroborate it with selective bottom-up checks, including sampled price-by-volume math from retailers, channel checks on promotional pricing, and importer and wholesaler throughput estimates. When the comparisons show gaps, we adjust the model inputs accordingly.
Inputs used in the model include holiday-season unit sales tendencies, price bands by tree height and feature sets (for example, pre-lit versus unlit), the share moving through online versus offline retail, import intensity for artificial trees, and weather or supply effects that can tighten natural tree availability in key producing areas. Where direct unit indicators are missing for a country, we handle the gap using proxy relationships to household counts, urbanization, and comparable seasonal spend profiles, followed by a reasonableness check from local interviews.
For forecasting, we mainly rely on scenario analysis because this market can shift quickly due to short seasonal shocks and promotion timing, and because the balance between artificial and natural trees can change fast in some years. The scenarios are anchored to expected price progression, channel expansion, and interview-based expectations on consumer preference and inventory planning, so the growth path stays explainable and repeatable.
Data Validation & Update Cycle
Outputs are validated through multiple passes that compare the model totals against independent signals, including retail seasonal sales patterns, import movements for artificial trees, and stated revenue exposure from key participants. When a variance looks too large, we revisit assumptions, re-check currency conversions and timing, and re-contact select respondents to confirm whether the change is real or a timing mismatch.
Before sign-off, another analyst reviews the file to catch input errors and inconsistent growth rates across regions. Reports are refreshed annually, and interim updates are made when material events occur, such as unusual supply disruptions or large pricing shifts. Right before delivery, a final pass is completed so clients receive the latest updated view.
Mordor Intelligence's Christmas Tree Market Size Versus Other Published Estimates
Published market sizes for Christmas trees can look far apart because the scope can shift between natural-only, artificial-only, or a combined view, and because some estimates mix in adjacent holiday decor items. The year chosen for the base number also matters, since this is a seasonal market, and a different pricing assumption for peak-season promotions can change the final value.
Another common gap comes from how channels are treated. Online pricing and bulk commercial purchases can move average selling prices in different directions. Some sources also lean on a single base year and carry forward a smooth growth rate, even when weather-linked supply tightness or import cost swings change the season outcome. If currency conversion timing is not aligned to the selling season, the USD number can drift.
Benchmark comparison
| Source | Market Size | Gaps in Research Methodology |
|---|---|---|
| Mordor Intelligence | USD 6.59 B (2026) | |
| Global Research Publisher A | USD 4.91 B (2025) | Uses an earlier base year and places more emphasis on a combined natural plus artificial view with broader end-use mentions, which can shift pricing and channel weights versus a season-specific sell-through build. |
| Industry Research Publisher B | USD 3.79 B (2024) | Reports a 2024 base and presents a wide segmentation set, but the public summary does not show the exact price-by-height logic or how peak-season discounting is handled, which can compress the value outcome. |
The spread is mainly explained by base-year choice, what gets counted with the tree purchase, and how price and channel mix are carried through the seasonal peak. Some estimates appear to include a broader retail framing. For Mordor Intelligence, only the tree revenue is counted, and pricing is aligned to the selling season with interview checks that keep the totals tied to realistic unit and channel behavior.


Key Questions Answered in the Report
What is the current size of the Christmas tree market?
The Christmas tree market size is USD 6.59 billion in 2026 and is forecast to hit USD 8.12 billion by 2031.
Which segment holds the largest Christmas tree market share?
Vertical tree systems dominate with 84.35% of Christmas tree market share in 2025.
How fast is the offshore portion of the Christmas tree market growing?
Offshore installations are projected to expand at a 5.82% CAGR through 2031 as deepwater projects accelerate.
Why are AI-enabled controls important for Christmas tree systems?
AI platforms deliver predictive maintenance, reduce crew requirements and boost production efficiency, supporting long-term cost savings.
Which region leads global demand?
The Middle East and Africa region commands 42.65% of 2025 demand and is set to grow at 4.82% CAGR through 2031.
Page last updated on:


 Your data is secure and never sold or shared.


