
Market Overview
| Study Period | 2021 - 2031 |
|---|---|
| Forecast Data Period | 2026 - 2031 |
| Base Year Market Size (2025) | USD 5.57 Billion |
| Market Size (2026) | USD 5.85 Billion |
| Market Size (2031) | USD 7.45 Billion |
| Growth Rate (2026 - 2031) | 4.96 % |
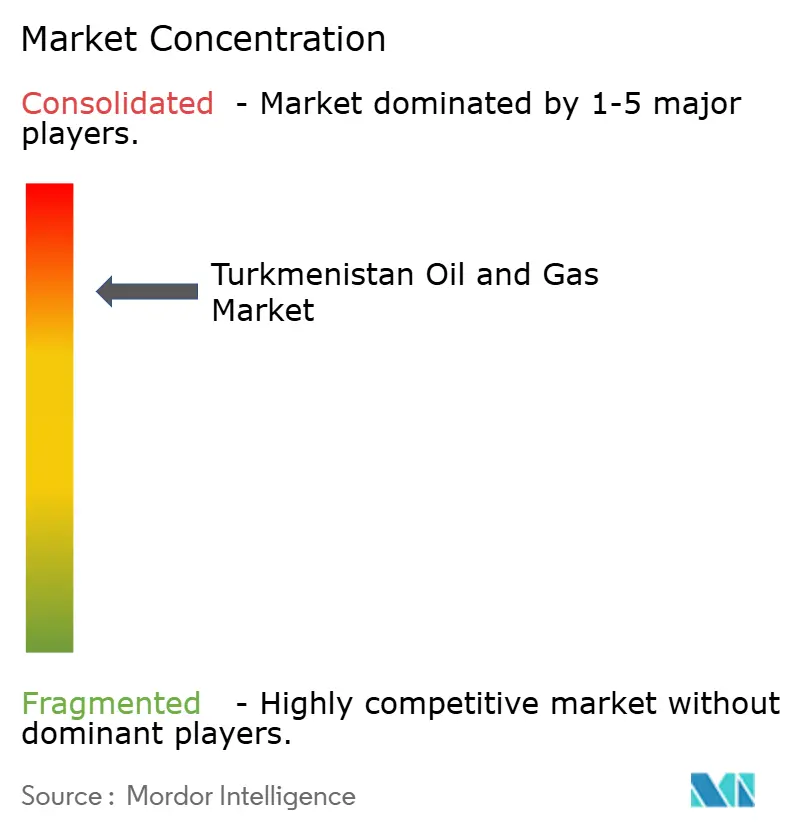
| Market Concentration | High |
Major Players *Disclaimer: Major Players sorted in no particular order Image © Mordor Intelligence. Reuse requires attribution under CC BY 4.0. | |
Turkmenistan Oil And Gas Market Analysis by Mordor Intelligence
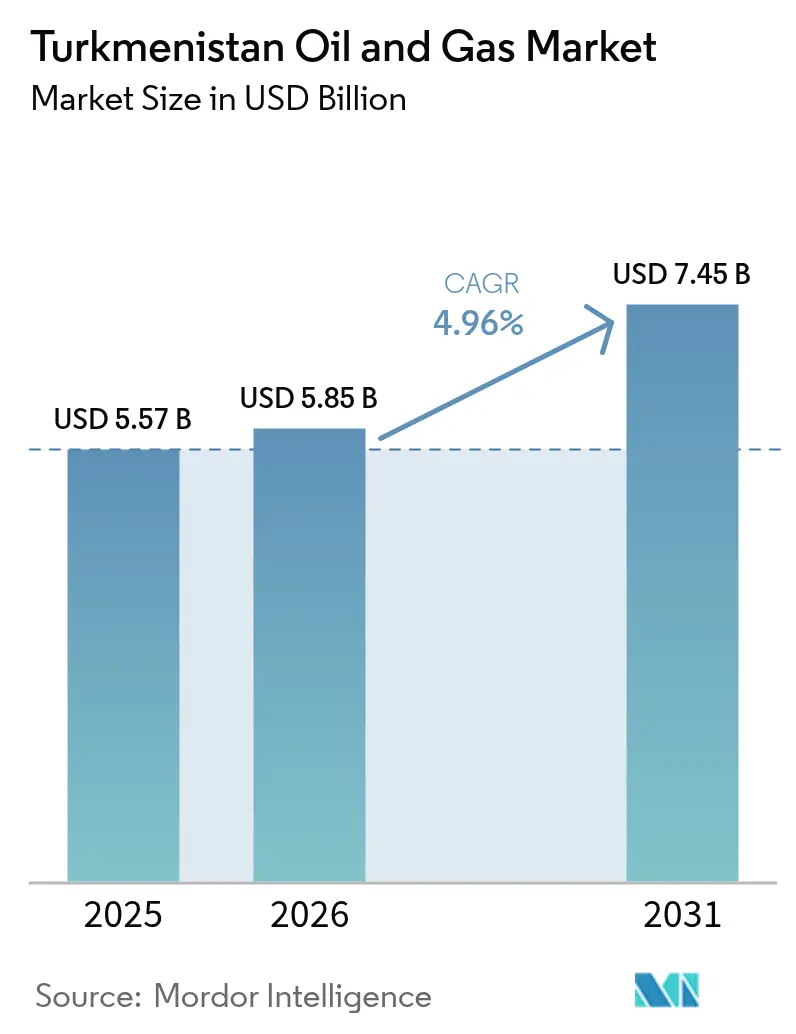
The Turkmenistan Oil And Gas Market size is expected to grow from USD 5.57 billion in 2025 to USD 5.85 billion in 2026 and is forecast to reach USD 7.45 billion by 2031 at 4.96% CAGR over 2026-2031.
The surge is anchored in reserves that exceed 71 billion tons of oil equivalent, with more than 20 billion tons of oil and 50 trillion cubic meters of gas.[1]Eurasianet Staff, “Turkmen Hydrocarbon Reserves Overview,” Eurasianet, eurasianet.org Growing Chinese demand, rising foreign investment, and large-scale infrastructure projects continue to accelerate field developments and midstream build-outs. The upstream segment remains the backbone, yet midstream pipelines and compressor stations are gaining traction as export diversification efforts gather pace. Government priorities now also target value-added petrochemicals, prompting joint ventures that channel advanced technology into production hubs. International investors view Turkmen assets as strategic footholds in Central Asia despite regulatory opacity and single-market exposure.
Key Report Takeaways
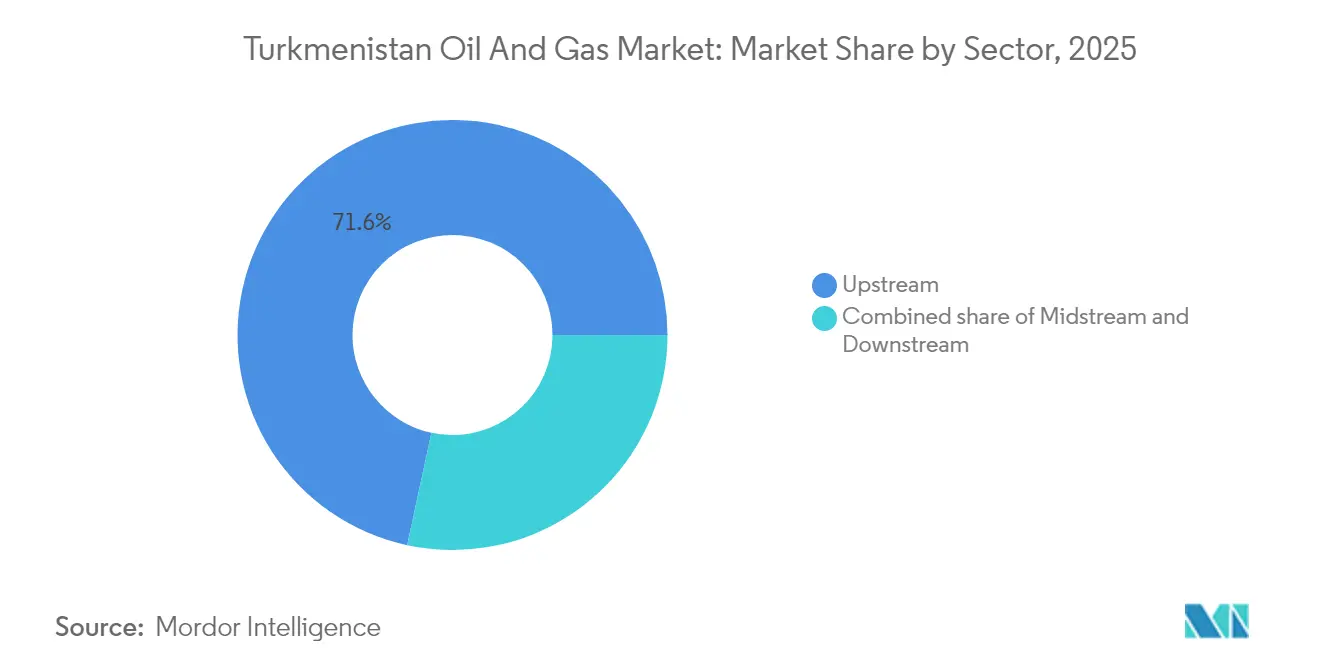
- By sector, upstream held 71.62% revenue share in 2025, while the midstream segment is forecast to expand at a 6.64% CAGR through 2031.
- By location, onshore fields accounted for 94.35% of 2025 revenue, and offshore operations recorded the fastest 7.02% CAGR through 2031.
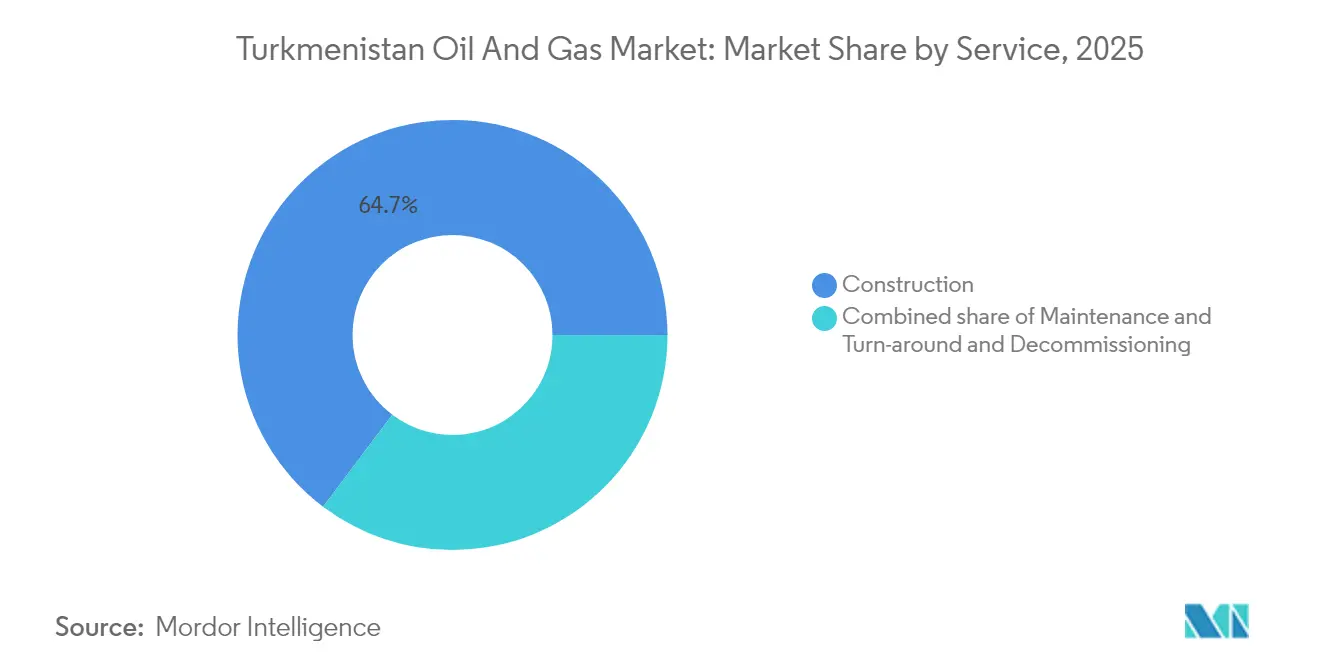
- By service, construction services commanded a 64.72% share in 2025 and are projected to advance at a 6.24% CAGR through 2031.
Note: Market size and forecast figures in this report are generated using Mordor Intelligence’s proprietary estimation framework, updated with the latest available data and insights as of 2026.
Turkmenistan Oil And Gas Market Trends and Insights
Drivers Impact Analysis*
| Driver | (~) % Impact on CAGR Forecast | Geographic Relevance | Impact Timeline |
|---|---|---|---|
| Rising gas export demand from China | +1.8% | National, with concentration in Galkynysh and Amu Darya fields | Medium term (2-4 years) |
| Downstream diversification push (petrochemicals) | +0.9% | National, focused on Kiyanly and Turkmenbashi complexes | Long term (≥ 4 years) |
| Foreign investment in Caspian Sea blocks | +0.7% | Offshore Caspian sector, Cheleken and Block 19 areas | Long term (≥ 4 years) |
| TAPI pipeline unlocking new output | +0.6% | National, with transit through Afghanistan to Pakistan-India | Medium term (2-4 years) |
| EOR pilots in mature onshore fields | +0.4% | Onshore legacy fields, primarily western regions | Medium term (2-4 years) |
| Digital oilfield initiatives by Türkmengaz | +0.3% | National, across upstream and midstream operations | Short term (≤ 2 years) |
| Source: Mordor Intelligence | |||
Rising Gas Export Demand from China
Turkmenistan shipped USD 2.4 billion worth of gas to China in Q1 2024, equivalent to approximately 75% of its national export volumes.[2]MEES Editorial, “Q1 2024 Gas Export Data,” MEES, mees.com CNPC’s long-running Amu Darya PSC underscores Beijing’s enduring appetite, shaping production schedules and pipeline expansions. Heightened rivalry with Russian suppliers since the Ukraine conflict deepens Turkmenistan’s appeal as a reliable feedstock source. Still, single-buyer reliance curtails pricing leverage and has triggered discussions with Iran and Turkey to broaden outlets through supply swaps. Successful delivery into multiple corridors would mitigate revenue volatility and encourage balanced capacity additions.
Downstream Diversification Push (Petrochemicals)
Authorities view polymers and fertilizers as buffers against fluctuations in raw commodity prices. South Korean groups pledged more than USD 11 billion for plants that process local feedstock into polyethylene, polypropylene, and mineral fertilizers.[3]BusinessKorea Reporter, “Hyundai Signs Kiyanly Agreement,” BusinessKorea, businesskorea.co.kr Hyundai Engineering’s normalization plan for the Kiyanly Polymer Plant aims to activate facilities constructed in 2018 that have remained idle. Daewoo E&C’s USD 730 million phosphate-fertilizer project in Turkmenabat widens the value chain and creates exportable products for Afghanistan, Uzbekistan, and the UAE. Diversification should stabilize fiscal receipts, yet it demands continual upgrades in power, water, and logistics.
Foreign Investment in Caspian Sea Blocks
Ashgabat has divided its Caspian sector into 32 licenses, which hold an estimated 12.1 billion tons of oil and 6.1 trillion cubic meters of gas. Dragon Oil has already produced 447 million barrels and plans USD 10 billion of extra spending to lift output and appraise Block 19. ADNOC’s 2025 incorporation of a GBP-denominated entity with USD 2.5 million capital signals Gulf interest in Galkynysh tie-ins. Deepwater targets at depths beyond 3,000 meters require advanced rigs and subsea expertise seldom available locally. Full monetization hinges on a Trans-Caspian route that can underpin bankable cash flows for offshore oil and gas discoveries.
TAPI Pipeline Unlocking New Output
The 700 km Turkmen section is finished, and work on the Serhetabat-Herat stretch began in September 2024. Once operational, the 1,814 km conduit could transport large volumes of energy to energy-deficient Pakistan and India, thereby sharpening Turkmenistan’s bargaining power with China. Islamabad’s energy ministry highlighted lower LNG import bills and job creation as key benefits. Nevertheless, security issues in Afghanistan and multi-sovereign coordination pose a schedule risk. A successful start could boost field developments that are currently constrained by export capacity ceilings.
Restraints Impact Analysis*
| Restraint | (~) % Impact on CAGR Forecast | Geographic Relevance | Impact Timeline |
|---|---|---|---|
| Regulatory opacity & investment risk | -1.2% | National, affecting all international partnerships | Short term (≤ 2 years) |
| Ageing production infrastructure | -0.8% | Onshore legacy fields, western and central regions | Medium term (2-4 years) |
| Water scarcity for EOR & refining | -0.5% | Arid regions, particularly around major processing facilities | Long term (≥ 4 years) |
| Sanctions-related financing constraints | -0.7% | National, impacting international banking and equipment access | Short term (≤ 2 years) |
| Source: Mordor Intelligence | |||
Regulatory Opacity & Investment Risk
Despite 67 bilateral treaties, the inconsistent application of customs and tax rules increases transaction costs and delays approvals for equipment and visas.[4]Commonspace Analysts, “Legal Reform Roadmap,” Commonspace, commonspace.eu State firms Türkmengaz and Türkmennebit veto key decisions, creating bottlenecks for production sharing partners. FDI inflows reached USD 11 billion in 2024, surpassing targets, yet many investors still report unpredictability in contract amendments. Proposed legal reforms in 2024 aim to align corporate law with global norms; however, the practical enforcement of these reforms will determine whether new capital flows continue.
Ageing Production Infrastructure
Decades-old wells and refineries require heavy rehabilitation. The Seydi complex processed 489,684 tons of crude in 2023 after targeted upgrades, yet many units still exceed design lifespans. Petrofac’s USD 200+ million extension for Galkynysh maintenance reflects rising OPEX needs. Equipment fatigue elevates environmental and safety risks, and without a systematic overhaul, output could plateau sooner than reserve forecasts suggest.
*Our forecasts treat driver/restraint impacts as directional, not additive. The impact forecasts reflect baseline growth, mix effects, and variable interactions.
Segment Analysis
By Sector: Upstream Dominance Drives Market Foundation
The upstream segment captured 71.62% of the Turkmenistan oil and gas market share in 2025, primarily driven by the Galkynysh super-giant field, which contains 27.4 trillion cubic meters of gas. Hyundai Engineering’s framework for Stage IV, comprising 30 wells and a new processing plant, illustrates the expansion rhythm. The Turkmenistan oil and gas market size for midstream assets is projected to surge in tandem, as Çalik Enerji’s USD 586 million Shatlyk-1 compressor station enters construction. ADNOC’s recent entry diversifies operator profiles and foregrounds Gulf financing in future drilling and gathering projects.
While upstream remains capital-intensive, midstream is expected to show a 6.64% CAGR outlook, reflecting pipeline build-outs for TAPI and potential Iran swap flows. Downstream growth is still in its early stages, but the political will behind petrochemical hubs and refinery revamps could increase its share by 2031. Integrated foreign service contracts now encompass drilling, production, and digital optimization scopes, signaling a market shift toward the deployment of total solutions. Enhanced oil recovery pilots in mature reservoirs and AI-based seismic analytics reaffirm that technology adoption is a competitive differentiator.



By Location: Offshore Expansion Challenges Onshore Supremacy
Onshore assets generated 94.35% of revenue in 2025, proving the historical gravity of fields such as Nebit-Dag and Barsa-Gelmez. Lower lifting costs and existing road access support continued project sanctioning. Offshore acreage, however, posts a 7.02% CAGR, outpacing onshore as Dragon Oil and new entrants exploit high-impact structures. The Turkmenistan oil and gas market size, which is currently parked in licensed Caspian blocks, is expected to increase as drilling depths extend beyond 3,000 meters. Trans-Caspian export solutions would enhance project netbacks and stimulate additional deepwater commitments.
Two recent subsea tie-backs linked LAM-B to adjacent platforms, showcasing the specialized hardware now present in Turkmen waters. By 2031, the offshore share could rise by multiple percentage points, thanks to AI-driven prospect mapping and extended-reach drilling. Onshore EOR pilots and gathering network upgrades will still dominate capital allocations thanks to immediate cash-flow benefits. Together, the mixed geologic portfolio enables operators to balance frontier risk with the stability of mature fields.
By Service: Construction Leadership Reflects Infrastructure Imperative
Construction accounted for 64.72% of service revenue in 2025 and is driving growth at a 6.24% CAGR, as megaprojects, refineries, and power plants demand turnkey execution. The Turkmenistan oil and gas market share allocated to construction enlarges each time a new fertilizer, polymer, or compression facility breaks ground. Daewoo E&C’s USD 730 million fertilizer plant and Çalik Enerji’s 1,574 MW power complex highlight sizable order books. International EPC players also commit to skills transfer programs that broaden local labor competence and enhance future project economics.
Maintenance services increase steadily, driven by aging assets and methane-reduction mandates under global climate pledges. Petrofac’s long-term contract for Galkynysh exemplifies the value of ongoing maintenance. Decommissioning remains marginal for now, but it will gain relevance once mature wells reach the end of their life and flare-reduction guidelines become tighter. Construction’s primacy underscores an irreversible infrastructure cycle: every successful build introduces new maintenance obligations, thus expanding ancillary service demand.
Geography Analysis
Turkmenistan's landlocked setting channels 75% of gas exports to China via established trunklines. A heavy reliance on a single buyer exposes earnings to single-market risk and exchange-rate swings, so Ashgabat pursues alternative corridors. The Iran-Iraq swap for 9 billion cubic meters annually, combined with early-stage Turkey transits, would spread sales and raise negotiating leverage.
The Caspian Sea theater promises a significant upside yet depends on complex maritime boundaries and the clearance of transboundary pipelines. SOCAR's 2023 office opening in Ashgabat and Azerbaijan's pledge to double EU exports signal that new regional alignments could facilitate the development of a Trans-Caspian line. Neighboring Uzbekistan's 2025 free-trade accord eases customs for drilling goods, remapping supply-chain efficiencies between Tashkent and Turkmen oil centers.
Global Gateway and World Bank methane programs offer Western financing for greener infrastructure, but sanction-linked banking hurdles temper full uptake. Meanwhile, South Korean and Gulf entities are accelerating project cycles, balancing China's predominance. Overall, geography forces policymakers to juggle export diversification imperatives with geopolitical sensitivities, shaping midstream spending and bilateral diplomacy.
Regulatory Landscape
Turkmenistan's oil and gas sector is overseen through the Cabinet of Ministers, alongside sector-specific oversight by the State Agency for Management and Use of Hydrocarbon Resources and operational roles for state entities such as Turkmengaz (gas) and Turkmennebit (oil). The upstream legal basis is the Law on Hydrocarbon Resources (2008), under which international participation is typically arranged through PSAs and licensing for onshore assets and the Turkmen sector of the Caspian Sea.
Operational compliance is increasingly tied to efficiency and emissions management. The Law on Energy Saving and Increasing Energy Efficiency introduced requirements such as energy audits and energy passports for major energy consumers, which raises the compliance bar for upstream facilities, processing plants, and their utilities. Methane-emissions governance is also being formalized through international cooperation workstreams (for example, UNECE technical framework work), while procurement remains a practical gate for market access. Turkmennebit ran international tenders in May to June 2026 and June to July 2026 for equipment and oilfield services that reflect current operator requirements and contracting processes.
Competitive Landscape
Competitive Landscape
State enterprises Türkmengaz and Türkmennebit anchor the Turkmenistan oil and gas market, while PSA partners, such as Dragon Oil, CNPC, and Petronas, operate discrete contract areas. ADNOC XRG’s 2025 registration marks a significant milestone for Gulf capital in upstream developments and may catalyze co-investment in gathering and processing assets. Dragon Oil leverages AI for reservoir modeling, thereby prolonging asset life and enhancing recovery from the Cheleken and Block 19 fields.
Hyundai Engineering and Daewoo E&C straddle upstream and downstream scopes, converting engineering dominance into recurring O&M revenues. Petrofac, Technip Energies, and Baker Hughes deploy integrated service packages that include digital oilfield components and methane-monitoring systems, meeting evolving environmental requirements. Competitive differentiation is increasingly based on delivering turnkey construction paired with advanced analytics, as clients prioritize uptime and compliance.
Gulf, Korean, and Chinese entrants create a multi-polar vendor ecosystem. Financing structures ranging from sovereign loans to export credit guarantee facilities hedge sovereign risk and facilitate large CAPEX programs. Overall intensity is moderate because the state awards acreage selectively, yet the growing pool of foreign EPCs and technology vendors drives incremental rivalry across service niches.
Turkmenistan Oil And Gas Industry Leaders
JSC Türkmengaz
JSC Türkmennebit
CNPC (Turkmenistan)
Dragon Oil PLC
Petronas Carigali
- *Disclaimer: Major Players sorted in no particular order

Market Opportunities and Future Outlook
Large-scale gas development and export-enabling infrastructure remain the clearest opportunity set, anchored by Galkynysh. In April 2026, Turkmengaz and CNPC Amudarya Petroleum Company Ltd. signed a USD 5.1 billion turnkey contract for Phase IV of Galkynysh, covering a 10 bcm per year processing facility and new wells. This expands the near-term addressable demand for EPC, drilling, compression, automation, and O&M services tied to a defined scope. The government also reiterated 2026 priorities covering new Galkynysh phases and the Serhetabat-Herat section of TAPI, keeping midstream build-outs (pipelines, compressor stations, metering, and SCADA) central to activity.
Offshore Caspian exploration and appraisal are a second whitespace, supported by new contracting momentum and demand for deepwater-capable technical services. In June 2026, Turkmennebit and Petronas Carigali (Turkmenistan) Sdn. Bhd. formalized PSAs for offshore Block 19 and Block 20 and signed a cooperation agreement covering 2D seismic studies for northern offshore blocks, creating demand for seismic acquisition and processing, marine logistics, subsea engineering, and HSSE systems. A third opportunity area is compliance-led modernization. Implementation of energy-efficiency requirements and methane-management frameworks expands demand for measurement, monitoring, leak detection, and retrofit packages, reinforced by EU/GIZ technical activities in 2026 focused on energy-sector technology and integration topics.
Recent Industry Developments
- June 2026: Turkmennebit and Petronas Carigali (Turkmenistan) Sdn. Bhd. formalized production sharing agreements for offshore Block 19 and Block 20 in the Turkmen sector of the Caspian Sea. The parties also signed a cooperation agreement covering 2D seismic studies of northern offshore blocks, broadening the pipeline of exploration and subsurface work that drives demand for marine seismic, appraisal drilling support, and offshore services.
- April 2026: Turkmengaz and CNPC Amudarya Petroleum Company Ltd. signed a USD 5.1 billion contract for turnkey construction of Phase IV of the Galkynysh gas field. The scope includes a 10 bcm per year processing facility and new production wells, expanding the active market for EPC execution, drilling services, automation, and long-cycle maintenance tied to one of the country’s strategic gas assets.
- October 2024: Daewoo E&C secured a USD 730 million EPC contract for a mineral fertilizer plant in Turkmenabat. The project’s planned output of phosphate and ammonium sulfate links gas and petrochemical feedstock availability to higher-value exports, supporting additional requirements across utilities, logistics, and construction services in Turkmenistan’s downstream diversification agenda.


Research Methodology Framework and Report Scope
Market Definition and Coverage
For this report, the Turkmenistan oil and gas market is defined as the value of revenue generated from upstream, midstream, and downstream activities in the country, including related field and asset services across onshore and offshore operations.
Scope exclusions: Petrochemicals and gas-to-liquids product sales are excluded when they are reported as standalone chemical outputs rather than as part of oil and gas sector revenue.
Segmentation Overview
- By Sector
- Upstream
- Midstream
- Downstream
- By Location
- Onshore
- Offshore
- By Service
- Construction
- Maintenance and Turn-around
- Decommissioning
Data Sources, Market Sizing, and Validation
Desk Research
Desk work started with building a fact base for production, reserves, processing, and exports, and then translating those signals into revenue pools that can be modeled year by year for Turkmenistan. We used public sources such as IEA energy statistics, the Energy Institute Statistical Review, UN Comtrade, the World Bank, and OPEC and Gas Exporting Countries Forum publications to understand supply, demand, and trade directions.
To ground the numbers, we also reviewed operator releases, project announcements, and government and regulator websites where available, then checked reputed press coverage for pipeline, processing, and refinery activity timelines. Where public series were incomplete, paid subscriptions for company financials and shipment level trade intelligence were used selectively to cross-check revenue exposure and trade values. These examples are indicative only, and many other sources were also referred to for data collection, validation, and clarification during the study.
Primary Interviews and Surveys
Interviews and surveys with operators, service providers, transport and refining specialists, and public-sector energy experts in Turkmenistan are used to test the secondary findings. Discussions clarify field activity, service pricing, project timing, utilization, and export assumptions, after which the feedback is compared with reported production and trade data before the model is finalized.
Distribution of primary research fieldwork respondents
| Company type | Respondent position |
|---|---|
| Top tier: 29% | CXOs: 15% |
| Mid tier: 46% | Functional/Unit leaders: 35% |
| Smaller Players: 25% | Managers: 50% |
Market-Sizing & Forecasting
Sizing was built using a top-down model where production, processing, and trade signals are reconstructed into revenue pools for upstream, midstream, and downstream, then filtered by the share that is realistically monetized in-country. To keep the totals practical, we corroborated the outputs with selective bottom-up approximations such as sampled project values for construction, service intensity assumptions for maintenance and turn-arounds, and simple price times volume checks where data was available.
Key inputs used in the model included oil and gas production levels, export volumes, major pipeline and processing throughput indicators, announced project capex and commissioning schedules, and service mix splits across construction, maintenance, and decommissioning. Since pricing can move quickly, we applied a scenario analysis overlay to test how different oil and gas price paths and utilization rates would change the final revenue numbers. We then aligned the base case with what interviewees viewed as most likely. Where activity level detail was missing for smaller projects, we used benchmark cost ranges and activity ratios from similar asset types, which were then moderated during validation calls.
Data Validation & Update Cycle
Model outputs were checked against independent signals such as production and export trends, known asset capacities, and the visible pace of project development in Turkmenistan, and then inconsistencies were investigated until the drivers were clear. We also ran variance checks across sectors and services so that no single input, like price or utilization, was pushing the totals beyond what operations can support.
Before sign-off, a separate analyst review is completed and follow-up calls are triggered when an estimate sits outside expected ranges or when new information changes the demand picture. Reports are refreshed annually, with interim updates when material events occur, and a final pre-delivery pass is done so clients receive the latest view.
Mordor Intelligence's Turkmenistan Oil and Gas Market Size Measured Against Other Published Estimates
Published sizes for Turkmenistan oil and gas can look far apart because some sources emphasize hydrocarbon value as a mix of volume and trade value, while others try to price in a wider industrial energy chain. Differences also come from the year used as the base, the price deck assumed for oil and gas, and whether revenues are counted at the asset activity level or as a broader economic value proxy.
Petrochemicals and GTL product revenues sit outside Mordor Intelligence's scope in this report, which is one practical reason some published totals look larger even when they track similar production and export signals.
Benchmark comparison
| Source | Market Size | Gaps in Research Methodology |
|---|---|---|
| Mordor Intelligence | USD 5.57 B (2025) | |
| Global Consultancy A | USD 7.86 B (2024) | Uses a broader oil and gas framing that can blend value-chain activity with higher-level sector valuation, and it is anchored to a different base year with its own price assumptions. |
| Industry Publisher B | USD 8.70 B (2026) | Extends the scope to include petrochemicals, LNG processing, and GTL outputs, and it reports a later year that can reflect planned capacity additions sooner in the published number. |
The comparison mainly points to scope layering and timing as the two biggest drivers of the spread. By keeping the sizing tied to upstream, midstream, downstream, and directly linked services, and by checking the result against observable production, export, and project signals, the final number stays traceable and repeatable for planning discussions.


Key Questions Answered in the Report
What is the current value of the Turkmenistan oil and gas market?
The Turkmenistan Oil And Gas Market is valued at USD 5.85 billion in 2026 and is projected to reach USD 7.45 billion in 2031.
What CAGR is expected for Turkmenistan's oil and gas sector through 2031?
A 4.96% compound annual growth rate is forecast for 2026-2031.
Which segment is growing fastest within the national energy portfolio?
The midstream segment leads with a 6.64% CAGR, driven by pipeline and compressor station projects.
How significant is China to Turkmenistan,s gas exports?
China accounts for roughly 75% of Turkmen gas exports, equivalent to USD 2.4 billion in Q1 2024 deliveries.
What role does the TAPI pipeline play in future growth?
TAPI offers the first large-scale alternative export route and could unlock new production once operational, reducing single-market dependency.
Which foreign companies recently expanded in Turkmen upstream projects?
Dragon Oil, Hyundai Engineering, and, most recently, ADNOC XRG have committed capital and technology to major field developments.
Page last updated on:





