
Mobility As A Service Market Size and Share
Market Overview
| Study Period | 2020 - 2032 |
|---|---|
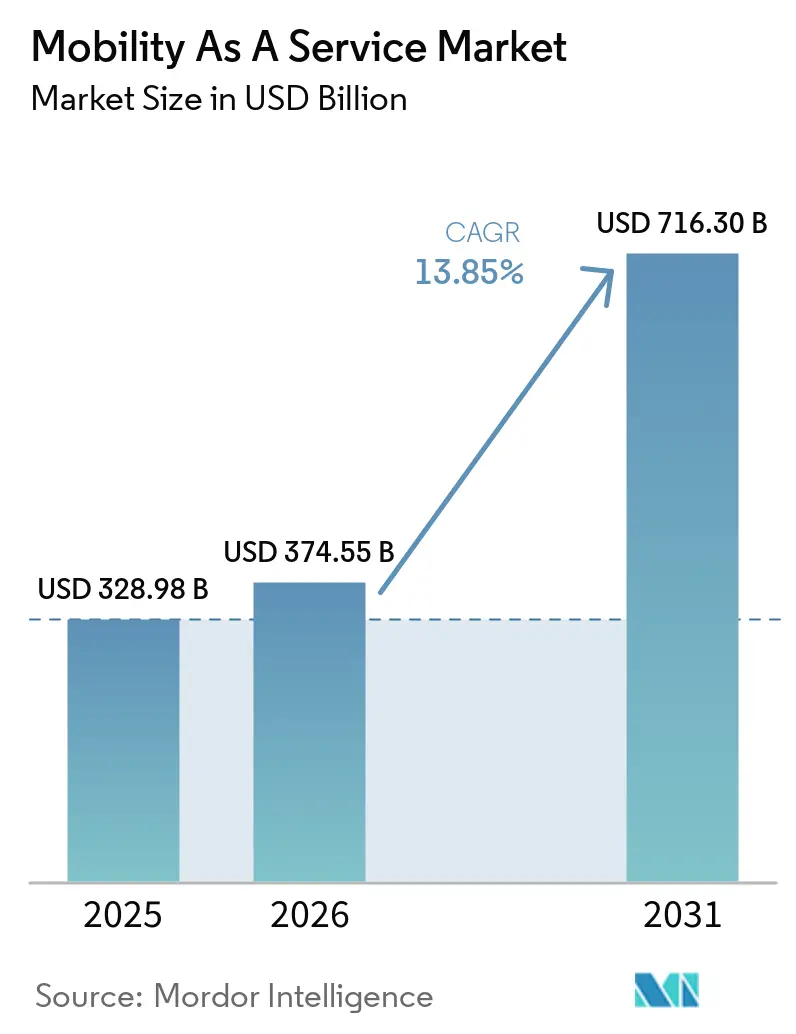
| Market Size (2027) | USD 374.55 Billion |
| Market Size (2032) | USD 716.30 Billion |
| Growth Rate (2027 - 2032) | 13.85 % |
| Fastest Growing Market | Middle East and Africa |
| Largest Market | Asia-Pacific |
| Market Concentration | Medium |
Major Players *Disclaimer: Major Players sorted in no particular order Image © Mordor Intelligence. Reuse requires attribution under CC BY 4.0. | |
Mobility As A Service Market Analysis by Mordor Intelligence
The mobility as a service market size was valued at USD 328.98 billion in 2026 and is projected to grow from USD 374.55 billion in 2027 to USD 716.30 billion by 2032 at 13.85% CAGR over 2027-2032. Strong urban population growth, continuous smartphone adoption, and heightened environmental awareness are shifting consumers from private vehicle ownership toward integrated, shared, and multimodal transport offerings. API standardization, adoption of electric and hydrogen propulsion, and seamless payment innovation are accelerating platform interoperability, improving the customer experience, and driving provider revenue diversification. Policymakers are pushing zero-emission goals that prioritize public–private partnerships and stimulate large-scale deployments of electric fleets. At the same time, 5G and IoT upgrades enable real-time fleet orchestration and predictive journey management. Intensifying competition between incumbent ride-hailing leaders and emerging specialized MaaS orchestrators is prompting aggressive investment in artificial intelligence, data monetization, and subscription models as companies seek defensible differentiation.
Key Report Takeaways
- By service type, ride-hailing captured 45.85% of the mobility-as-a-service market share in 2026; micro-mobility is projected to expand at a 19.12% CAGR through 2032.
- By solution, technology platform solutions held 37.72% of the mobility-as-a-service market share in 2026; payment and wallet services are forecast to grow at 20.95% CAGR through 2032.
- By vehicle type, passenger cars accounted for 56.63% of the mobility-as-a-service market in 2026, while autonomous pods advanced at a 22.74% CAGR through 2032.
- By transportation type, private transportation led with a 61.34% of the mobility-as-a-service market share in 2026; public transportation is anticipated to post a 14.93% CAGR over 2027-2032.
- By business model, pay-as-you-go accounted for 67.25% of the mobility-as-a-service market share in 2026; subscription bundles are rising at a 23.88% CAGR through 2032.
- By application, personal mobility accounted for 70.62% of the mobility-as-a-service market size in 2026, and logistics/last-mile delivery is projected to grow at a 20.53% CAGR through 2032.
- By end-user, individuals held 77.46% of the mobility-as-a-service market share in 2026; enterprise adoption is gaining momentum at a 16.96% CAGR to 2032.
- By operating system, Android held a 62.55% of the mobility-as-a-service market share in 2026; other platforms, including HarmonyOS and PWAs, are set to expand at a 23.05% CAGR through 2032.
- By propulsion, electric powertrains represented 41.58% of the mobility-as-a-service market share in 2026; hydrogen fuel-cell vehicles are expected to post a 25.42% CAGR during 2027-2032.
- By geography, Asia Pacific secured 34.12% of the mobility-as-a-service market share in 2026; the Middle East and Africa are positioned as the fastest-growing region at a 14.05% CAGR to 2032.
Note: Market numbers in this report are based on Mordor Intelligence's proprietary estimation framework, which combines nine months of actuals with Q4 projections for base year 2026.
Market Trends and Insights
Drivers Impact Analysis of Mobility As A Service Market*
| Driver | (~) % Impact on CAGR Forecast | Geographic Relevance | Impact Timeline |
|---|---|---|---|
| Integration of Micro-Mobility and Public Transit Across European Cities | +3.2% | Europe, with spillover to North America | Medium term (2-4 years) |
| Government Zero-Emission Targets Fueling EV-Centric MaaS Bundles (APAC) | +2.9% | Asia Pacific, Europe | Long term (≥ 4 years) |
| API Standardization (NeTEx, GTFS-RT) Enabling Account-Based Ticketing | +2.5% | Global, with early adoption in Europe and North America | Medium term (2-4 years) |
| Surge in VC Funding for South America MaaS Super-Apps | +2.1% | South America, particularly Brazil and Chile | Short term (≤ 2 years) |
| 5G/IoT-Driven Real-Time Mobility Orchestration | +1.6% | North America, Europe, Advanced Asian markets | Medium term (2-4 years) |
| Corporate Travel Sustainability Mandates in North America | +1.5% | North America, with spillover to Europe | Short term (≤ 2 years) |
| Source: Mordor Intelligence | |||
Integration of Micro-Mobility and Public Transit Across European Cities
The seamless integration of micro-mobility options with traditional public transit systems creates multimodal transportation networks that significantly enhance first-mile/last-mile connectivity. European cities like Helsinki and Vienna are pioneering this integration, with public transport authorities actively incorporating bike-sharing and e-scooter services into unified mobility platforms. This integration is yielding remarkable results, with the International Transport Forum reporting that properly integrated micro-mobility can increase public transit ridership by up to 35% in urban corridors.[1]The most successful implementations feature standardized docking stations strategically positioned near transit hubs, unified payment systems, and real-time availability data. Beyond improving transit accessibility, this integration is reshaping urban planning priorities, with cities like Barcelona redesigning street infrastructure to accommodate micro-mobility lanes that connect directly to transit stations.
Government Zero-Emission Targets Fueling EV-Centric MaaS Bundles
Stringent emission-reduction targets across regions such as Asia-Pacific are catalyzing the development of electric-vehicle-focused offerings in the Mobility as a Service Market, combining EV ride-hailing, electric car-sharing, and e-bike rentals into comprehensive mobility packages. China's mandate for 40% of vehicles to be electric by 2030 has prompted companies like Didi to launch "Green Alliance" MaaS bundles that exclusively feature zero-emission transportation options. These EV-centric services are gaining significant traction, with TÜV SÜD reporting that electric mobility services can reduce urban transport emissions by up to 70% compared to conventional vehicle usage.
API Standardization (NeTEx, GTFS-RT) Enabling Account-Based Ticketing
The widespread adoption of standardized data exchange protocols such as NeTEx (Network Timetable Exchange) and GTFS-RT (General Transit Feed Specification Real-Time) is revolutionizing account-based ticketing systems, enabling seamless multimodal journeys without requiring multiple tickets or payment methods. These standards provide a common language for disparate transportation systems to communicate, allowing real-time data synchronization across modes. Beyond operational efficiencies, these standards enable innovative fare models like mobility credits and dynamic pricing based on real-time demand. The Metropolitan Transportation Commission in San Francisco has demonstrated that standardized APIs can reduce the time required to integrate new mobility services into existing platforms by up to 60%, significantly accelerating the expansion of the MaaS ecosystem.
Surge in VC Funding for South America MaaS Super-Apps
South America is experiencing unprecedented venture capital investment in MaaS super-apps that combine transportation, food delivery, and financial services into unified platforms tailored to the region's unique mobility challenges. This funding surge enables rapid expansion of services in previously underserved markets, with Brazil and Mexico leading adoption. These super-apps address critical regional challenges, including limited access to banking, by incorporating alternative payment methods and micro-lending features specifically for transportation. The integration of previously informal transit options, such as "collectives" in Mexico and "kombis" in Brazil, into digital platforms is formalizing these services while enhancing their reliability and safety, creating a more inclusive mobility ecosystem that serves diverse socioeconomic segments.
Restraints Impact Analysis of Mobility As A Service Market*
| Restraint | (~) % Impact on CAGR Forecast | Geographic Relevance | Impact Timeline |
|---|---|---|---|
| Fragmented Regulatory Frameworks Across U.S. States | -1.9% | North America, particularly United States | Medium term (2-4 years) |
| GDPR/CCPA-Driven Data-Privacy Compliance Costs | -1.7% | Europe, North America | Short term (≤ 2 years) |
| Profitability Challenges from Driver/Provider Subsidies | -1.5% | Global, more pronounced in emerging markets | Medium term (2-4 years) |
| Legacy Transit IT Systems Limiting Integration Depth | -1.4% | Global, particularly in established transit markets | Long term (≥ 4 years) |
| Source: Mordor Intelligence | |||
Fragmented Regulatory Frameworks Across U.S. States
The inconsistent patchwork of transportation regulations across U.S. states is creating significant operational challenges for MaaS providers attempting to scale nationally. Each state imposes different licensing requirements, insurance mandates, and operational restrictions. This regulatory fragmentation forces companies to develop state-specific operational models, substantially increasing compliance costs and slowing market penetration. The Federal Highway Administration highlights that this lack of regulatory harmonization has resulted in up to 35% higher operational costs for multi-state MaaS providers than those operating in more unified regulatory environments.
GDPR/CCPA-Driven Data-Privacy Compliance Costs
The implementation of stringent data protection regulations such as the European Union's General Data Protection Regulation (GDPR) and California's Consumer Privacy Act (CCPA) is imposing substantial compliance costs on MaaS providers, who must navigate complex requirements governing data collection, storage, and sharing. These regulations are particularly challenging for MaaS platforms that rely on extensive user data to optimize routes, predict demand, and personalize services.
*Our forecasts treat driver/restraint impacts as directional, not additive. The impact forecasts reflect baseline growth, mix effects, and variable interactions.
Mobility As A Service Market Segment Analysis
By Service Type:
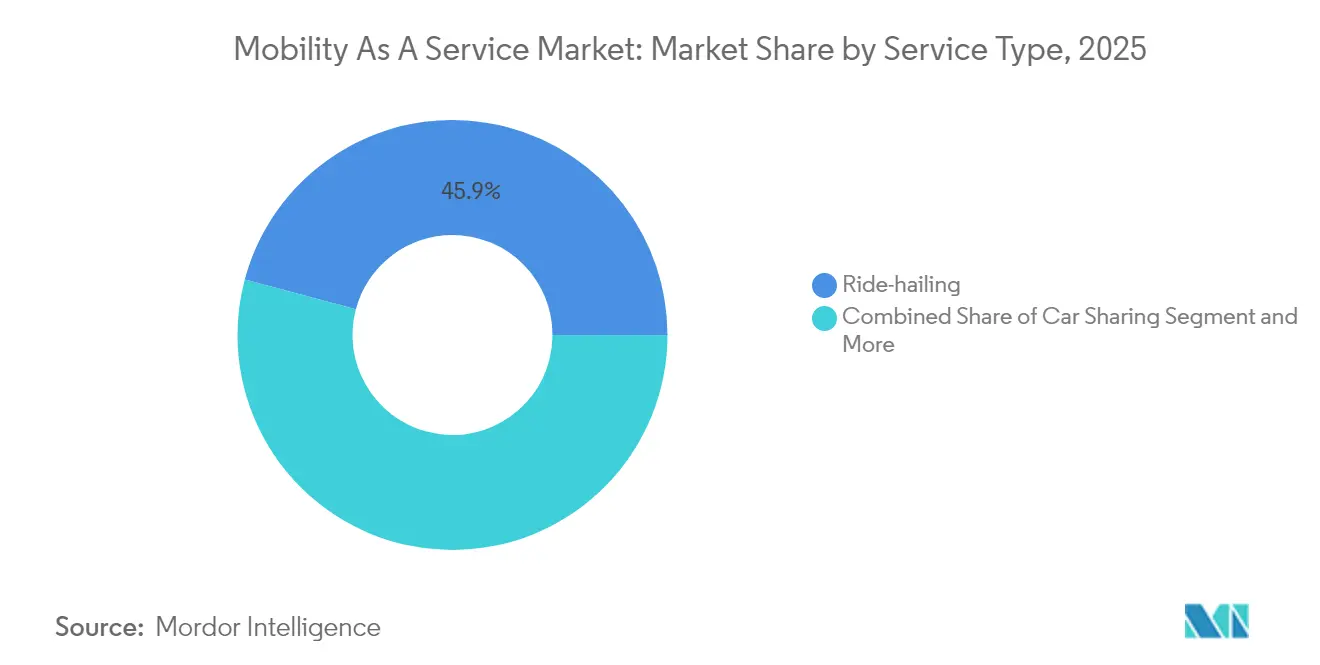
Micro-Mobility Disrupting Urban Transit PatternsRide-hailing dominates the mobility-as-a-service market, accounting for a 45.85% share in 2026. Its established user base and extensive driver networks support its market leadership. However, micro-mobility services, including scooter and bike sharing, are projected to be the fastest-growing segment, with a CAGR of 19.12% through 2032. Their ability to address first- and last-mile connectivity challenges drives this growth. IoT-enabled micro-mobility solutions with high-performance batteries enhance the user experience by improving vehicle stability and enabling real-time availability tracking. City governments are further supporting segment growth by increasingly allocating dedicated infrastructure for micro-mobility lanes and parking zones.
The car-sharing segment is witnessing substantial innovation through the introduction of flexible, free-floating models that eliminate fixed pickup and drop-off locations, while bus-sharing services are gaining traction in corporate environments and campus settings. The scooter sharing segment, despite regulatory challenges in some markets, is expanding rapidly due to its low implementation costs and high user adoption rates.

By Solution:
Payment Innovations Driving Seamless MobilityTechnology platforms lead this segment with 37.72% of the mobility-as-a-service market share in 2026, serving as the foundational infrastructure that enables service integration and user interface. Meanwhile, payment and wallet solutions are experiencing the fastest growth, at a 20.95% CAGR through 2032, as they address a critical friction point in the multimodal journey. The emergence of open-loop payment systems is particularly transformative, with PaymentGenes reporting that MaaS platforms implementing these systems see up to 40% higher user retention compared to those using closed-loop systems. These systems eliminate the need for users to preload funds or maintain multiple payment methods across different services.
Trip planning and navigation solutions continue to evolve with the integration of artificial intelligence that can predict disruptions and suggest alternatives in real-time. Connectivity and telematics solutions are enabling enhanced vehicle tracking and fleet management capabilities, while insurance and support services are expanding to address the unique needs of shared mobility users.
By Vehicle Type:
Autonomous Pods Poised for Breakthrough GrowthPassenger cars maintain their dominance with 56.63% of the mobility-as-a-service market share in 2026, reflecting the continued importance of ride-hailing and car-sharing services in the MaaS ecosystem. However, autonomous pods are projected to achieve the highest growth rate, at a 22.74% CAGR from 2027-2032, as they offer a compelling solution for controlled environments and first- and last-mile connectivity.
Micro-mobility vehicles (e-bikes, e-scooters) continue to gain market share, particularly in dense urban areas where they offer superior maneuverability and parking convenience. Shuttles and buses are evolving with the introduction of on-demand routing algorithms that optimize occupancy rates and reduce wait times.
By Transportation Type:
Public Sector Innovation Accelerating GrowthPrivate transportation options account for 61.34% of the mobility-as-a-service market share in 2026, driven by the flexibility and convenience they offer compared to fixed-route alternatives. However, public transportation is growing faster at 14.93% CAGR through 2032, as transit agencies increasingly embrace digital transformation and service integration.
The American Public Transportation Association's study of European MaaS implementations reveals that public transit agencies that position themselves as the backbone of MaaS ecosystems can increase ridership by up to 25% while expanding their relevance beyond traditional service models. This growth is supported by significant investments in contactless payment systems, real-time tracking, and API development, enabling seamless integration with private mobility services.
By Business Model:
Subscription Bundles Transforming Consumer RelationshipsThe pay-as-you-go model accounted for 67.25% of the mobility-as-a-service market share in 2026, appealing to occasional users and those exploring MaaS services. However, subscription bundles are expected to grow at a CAGR of 23.88% through 2032, as they provide predictable revenue streams for providers while offering cost savings and convenience to frequent users.
Peer-to-peer models are gaining traction in markets with high vehicle ownership costs, enabling private vehicle owners to monetize idle capacity. Ticketing-only aggregator models serve as entry-level MaaS offerings that focus on simplifying payment across multiple transit services without full service integration.
By Application:
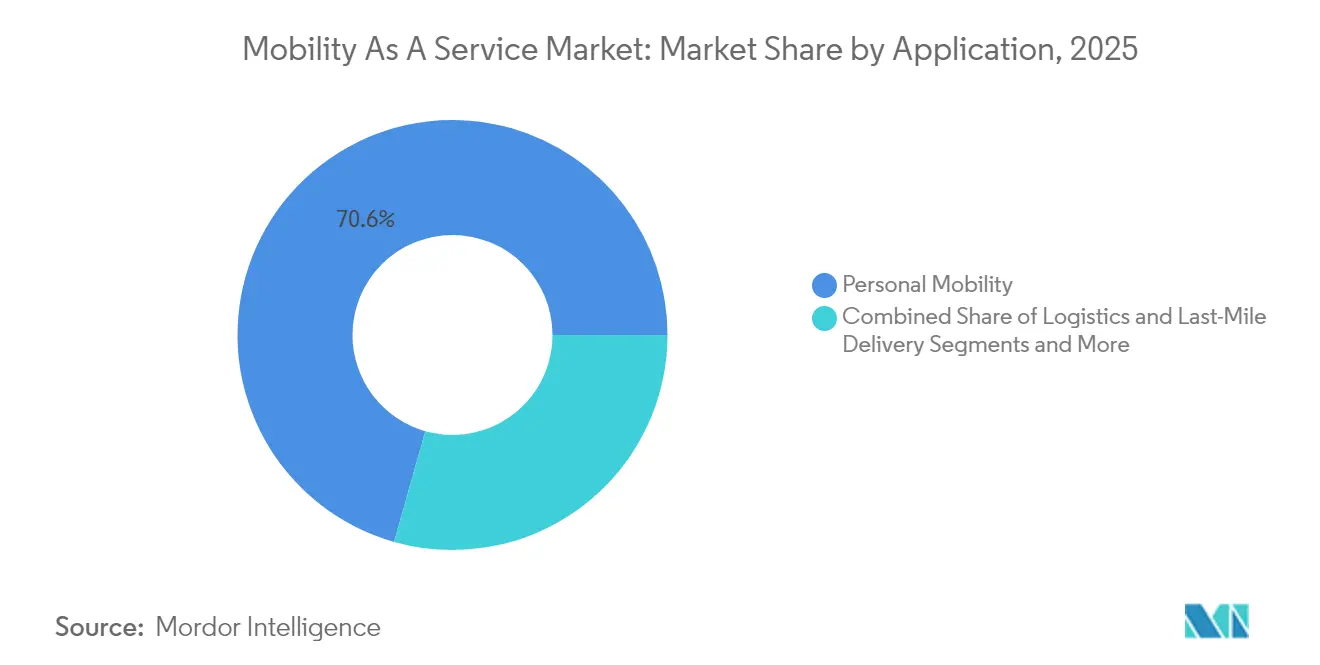
Last-Mile Logistics Emerging as Growth EnginePersonal mobility applications command 70.62% of the mobility-as-a-service market share in 2026, reflecting the primary focus of most MaaS platforms on moving people rather than goods. However, logistics and last-mile delivery applications are growing at a 20.53% CAGR through 2032, as e-commerce growth drives demand for efficient urban delivery solutions.
Business/corporate mobility applications are evolving beyond traditional corporate car services to encompass comprehensive mobility management platforms that support diverse employee transportation needs. The logistics and last-mile delivery segment is benefiting from innovations in route optimization and load consolidation, enabling more efficient resource utilization, with particular growth in electric cargo bikes that can replace up to 30% of urban truck deliveries in suitable environments.
By End-User:
Enterprise Adoption Driving B2B GrowthIndividuals represent 77.46% of the mobility-as-a-service market share in 2026, as consumer-focused ride-hailing and micro-mobility services continue to dominate the landscape. However, the enterprise segment is growing faster at 16.96% CAGR (2027-2032), driven by corporate sustainability mandates and the desire to optimize employee mobility costs.
Government and municipal agencies are increasingly adopting MaaS platforms to enhance public service delivery and optimize resource allocation. The individual segment continues to evolve with more personalized offerings that adapt to user preferences and travel patterns over time.
By Operating System:
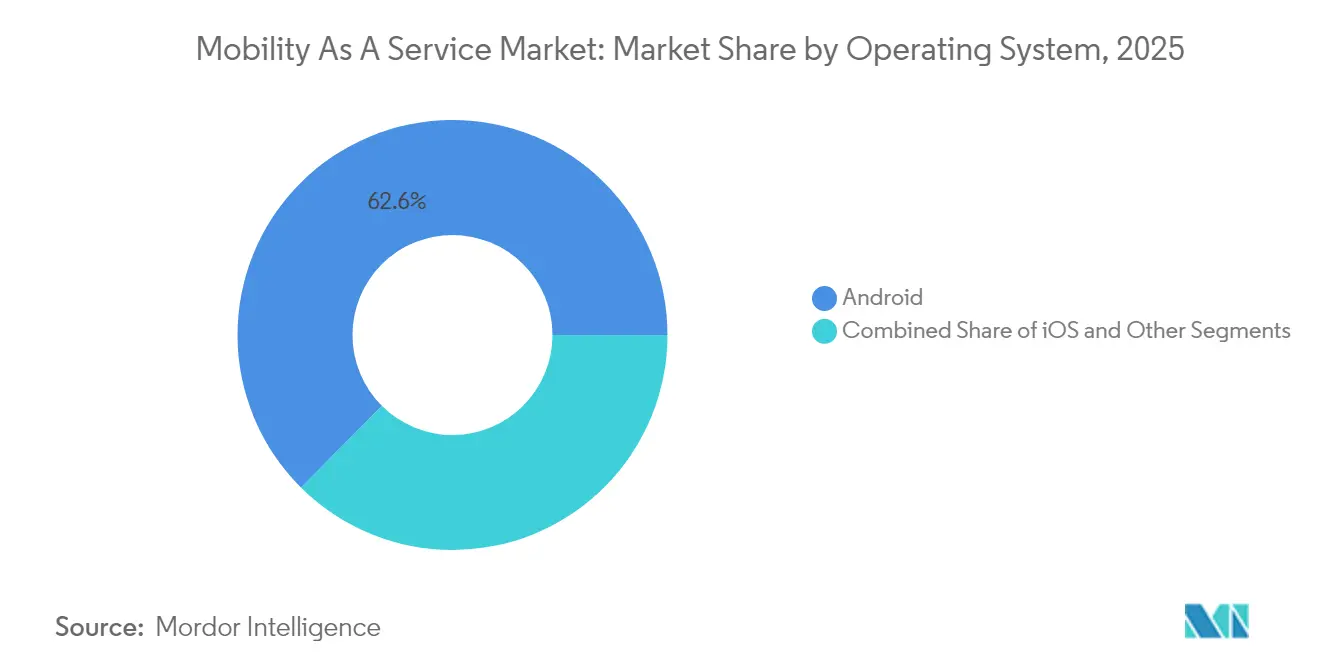
Emerging Platforms Challenging DuopolyAndroid dominates the mobility-as-a-service market with a 62.55% share in 2026, benefiting from its wider global adoption, particularly in emerging markets where MaaS growth is accelerating. However, other operating systems (HarmonyOS, KaiOS, Windows/PWAs) are growing the fastest, at a 23.05% CAGR (2027-2032), as they address specific regional needs and overcome the limitations of mainstream platforms. Progressive Web Apps (PWAs) are particularly significant in this growth, as they offer cross-platform compatibility without requiring dedicated app development for each operating system. This approach reduces development costs while ensuring broader accessibility across device types.
iOS maintains a significant market share, particularly in high-income regions where Apple devices are more prevalent. The "others" category, including emerging platforms like HarmonyOS, is gaining traction in markets where these systems have strong ecosystem support. The diversity of operating systems presents challenges for MaaS providers, who must ensure consistent user experiences across platforms. However, the rise of platform-agnostic development approaches is mitigating these challenges, with MaaS providers increasingly adopting responsive design principles that adapt to different screen sizes and operating systems while maintaining core functionality.
By Propulsion:
Hydrogen Fuel-Cell Driving Zero-Emission InnovationElectric propulsion leads with a 41.58% of the mobility-as-a-service market share in 2026, driven by expanding charging infrastructure and favorable regulatory environments. However, hydrogen fuel-cell propulsion is experiencing the highest growth rate, with a 25.42% CAGR through 2032, as it addresses the range and refueling-time limitations of battery electric vehicles. Linde reports that countries are implementing ambitious hydrogen mobility targets. Japan plans to establish a supply chain producing 300,000 tons of hydrogen by 2030 to support 800,000 fuel-cell cars and 1,200 fuel-cell buses.
Internal combustion engine (ICE) vehicles still maintain a significant market share, particularly in regions with limited electric charging infrastructure. Hybrid vehicles serve as a transitional technology, offering improved efficiency without requiring dedicated charging infrastructure. The emergence of hydrogen fuel cell technology in the MaaS ecosystem is particularly significant for high-utilization applications such as shuttle services and taxi fleets, where minimizing downtime is critical. UC Riverside's launch of the nation's only hydrogen-powered carshare program demonstrates the practical application of this technology in MaaS contexts, offering zero-emission mobility with refueling times comparable to conventional vehicles.
Geography Analysis
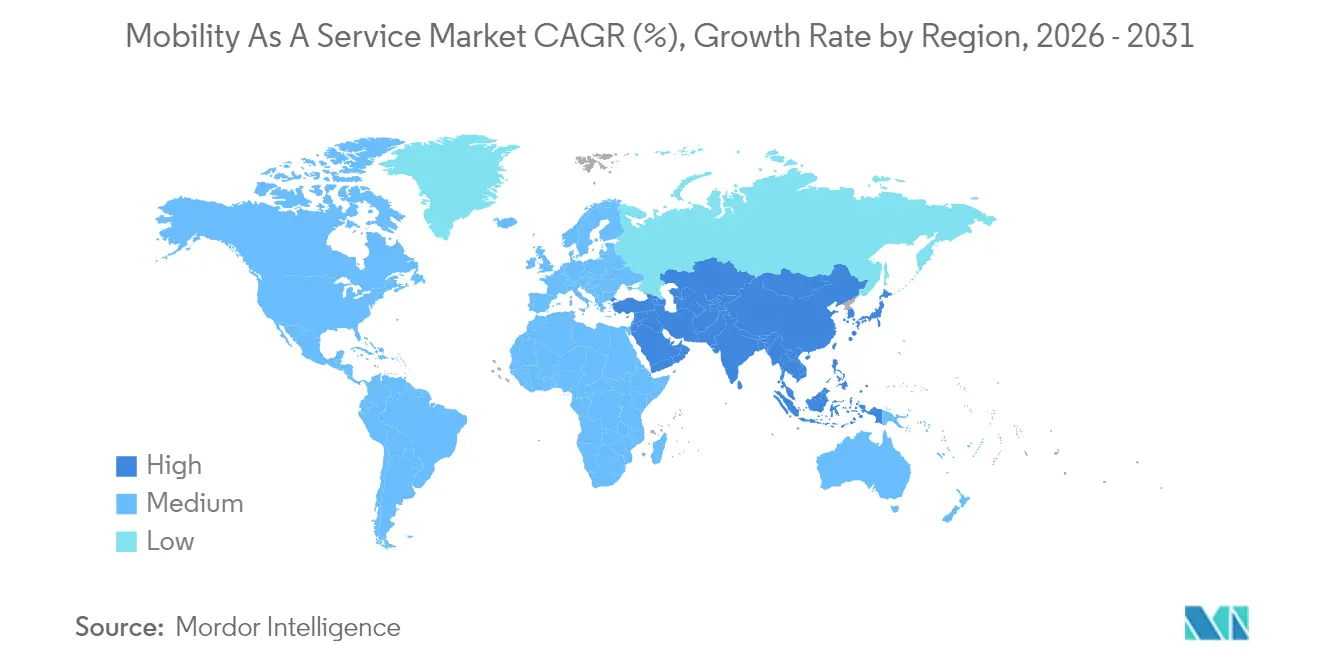
Asia-Pacific accounted for 34.12% of the mobility-as-a-service market share in 2026, capitalizing on dense cities, advanced digital payments, and coordinated infrastructure investments. China’s restriction on vehicle registrations in major metros nudges commuters toward shared platforms, while India’s expanding middle class embraces affordable ride-hailing. Singapore’s Smart Nation blueprint integrates public transit, micro-mobility, and unified payments into a single citizen app that exemplifies best-practice integration.
North America ranks second in market size. High ownership costs, renewed urban densification, and corporate travel sustainability mandates are propelling shared mobility growth, though state-by-state regulatory divergence is slowing national platform scale. Technology leadership in San Francisco, Austin, and Toronto supports early adoption of predictive analytics and autonomous pilots. Government incentives for electric vehicle fleets further strengthen the region’s shift toward mobility.
The Middle East and Africa region is expected to record the fastest growth, at a CAGR of 14.05% through 2032. This expansion is supported by government-led investments in smart mobility infrastructure, digital transportation platforms, and urban development initiatives across the region. Gulf Cooperation Council governments are prioritizing Mobility-as-a-Service (MaaS) in smart-city megaprojects, such as NEOM and Expo City. They are allocating capital to autonomous shuttles, integrated fare systems, and connected public transportation networks. These initiatives aim to improve urban mobility, reduce traffic congestion, and support the development of sustainable and technology-enabled transport ecosystems.
Competitive Landscape
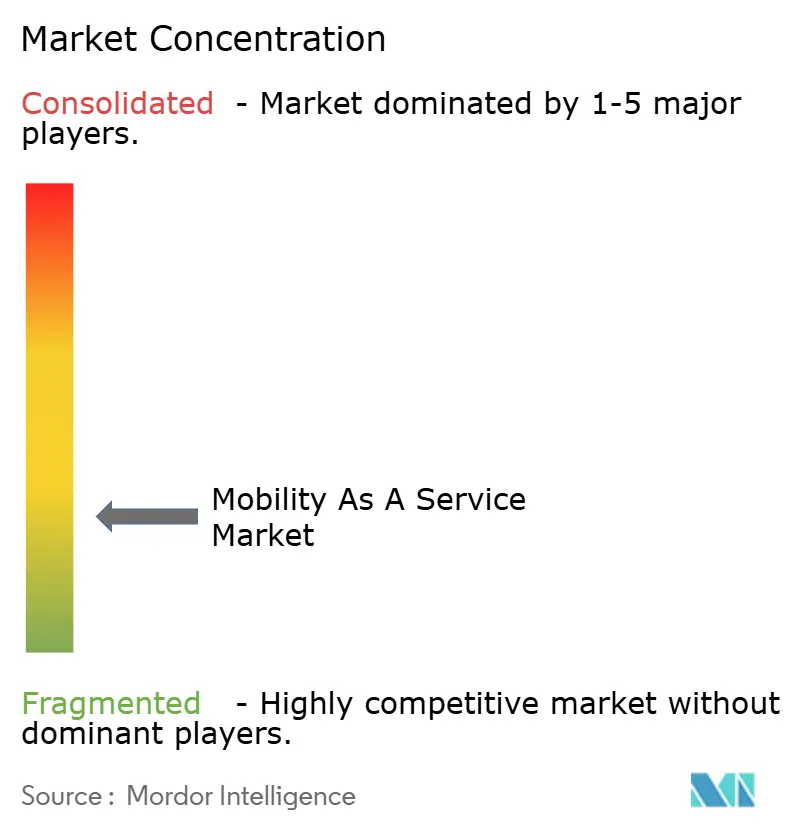
Competition in the mobility as a service market is moderate and shifting from single-mode dominance to platform orchestration. Ride-hailing incumbents Uber and Lyft are integrating transit schedules and scooter rentals into their apps to broaden stickiness. Transit agencies are launching branded MaaS hubs that retain fare revenue while offering private add-ons. Strategic data alliances, such as Uber’s partnership with May Mobility for autonomous fleets, underscore the pivot toward technology synergy rather than outright asset ownership.
Industry white space remains in niche verticals such as healthcare patient transfers, tourism bundles, and rural demand-responsive services, where incumbents have limited reach. Data monetization is emerging as a standalone revenue stream as platforms analyze anonymized origin-destination flows for planners and retailers. Providers that master local regulatory navigation and maintain secure data governance are better positioned to secure long-term contracts with municipalities.
Artificial intelligence investment is accelerating in demand prediction, surge-pricing calibration, and multimodal routing. Companies pursuing open API ecosystems invite third-party innovators to enrich trip-planning features, reinforcing network effects. Operators that align their roadmaps with public policy objectives of decarbonization, accessibility, and equity gain preferential treatment in tender awards and pilot programs.
Mobility As A Service Industry Leaders
-
Uber Technologies Inc.
-
Didi Chuxing
-
Avis Budget Group
-
Enterprise Holdings, Inc.
-
The Hertz Corporation
- *Disclaimer: Major Players sorted in no particular order
Mobility As A Service Market Companies Covered in this Report
- Uber Technologies Inc.
- Didi Chuxing
- Lyft Inc.
- Grab Holdings Ltd.
- FREE NOW (Lyft)
- Bolt Technology OÜ
- MaaS Global (Whim)
- Moovit Inc.
- Citymapper Ltd.
- Via Transportation Inc.
- Beeline Mobility
- UbiGo AB
- Tier Mobility SE
- Lime Technology Inc.
- Bird Global Inc.
- Bridj Technology Pty Ltd.
- Zipcar (AVIS Budget Group)
- The Hertz Corporation
- Enterprise Holdings Inc.
- Free2Move (STELLANTIS)
- BlaBlaCar (Comuto SA)
- Gojek (GoTo Group)
Recent Industry Developments in Mobility As A Service Market
- September 2026: Lyft launched its app in Europe. Riders initially gained early access to the Lyft app in Barcelona and Hamburg. Lyft is expanding app availability to several major European cities, including London, Rome, Paris, Berlin, Athens, and Warsaw.
- April 2026: MOIA America, LLC, a Volkswagen Group company that develops autonomous mobility technology, and Uber Technologies, Inc. began on-road validation testing of purpose-built autonomous ID. Buzz vehicles in Los Angeles. This initiative marked the next phase of their strategic partnership, which the companies introduced in 2023.
Global Mobility As A Service Market Report Scope
Mobility as a service integrates various forms of transportation services. It provides access to a variety of transportation services, including public transport, ride-share, and rental.
The Mobility As A Service Market Report is Segmented by Service Type (Ride-Hailing, Car Sharing, and More), Solution (Technology Platform, Payment and Wallet, and More), Vehicle Type (Passenger Cars, Shuttles and Buses, and More), Transportation Type (Public and Private), Business Model, Application, End-User, Operating System, Propulsion, and Geography. The Market Forecasts are Provided in Terms of Value (USD).
Segmentation Overview
| Ride-Hailing |
| Car Sharing |
| Bike Sharing |
| Scooter Sharing |
| Bus Sharing |
| Technology Platform |
| Payment and Wallet |
| Trip Planning and Navigation |
| Connectivity and Telematics |
| Insurance and Support Services |
| Passenger Cars |
| Micro-Mobility Vehicles (E-Bikes, E-Scooters) |
| Shuttles and Buses |
| Autonomous Pods |
| Public |
| Private |
| Subscription (Mobility Bundles, Corporate Plans) |
| Pay-As-You-Go |
| Peer-to-Peer |
| Ticketing-Only Aggregator |
| Personal Mobility |
| Business/Corporate Mobility |
| Logistics and Last-Mile Delivery |
| Individuals |
| Enterprises |
| Government and Municipal Agencies |
| iOS | |
| Android | |
| Others | HarmonyOS |
| KaiOS | |
| Windows/PWAs |
| Internal Combustion Engine (ICE) |
| Electric |
| Hybrid |
| Hydrogen Fuel-Cell |
| North America | United States |
| Canada | |
| Rest of North America | |
| South America | Brazil |
| Argentina | |
| Chile | |
| Rest of South America | |
| Europe | Germany |
| United Kingdom | |
| France | |
| Spain | |
| Italy | |
| Nordics | |
| Rest of Europe | |
| Asia-Pacific | China |
| India | |
| Japan | |
| South Korea | |
| Australia | |
| Rest of Asia-Pacific | |
| Middle East and Africa | Saudi Arabia |
| United Arab Emirates | |
| Egypt | |
| Turkey | |
| South Africa | |
| Rest of Middle East and Africa |
| By Service Type | Ride-Hailing | |
| Car Sharing | ||
| Bike Sharing | ||
| Scooter Sharing | ||
| Bus Sharing | ||
| By Solution | Technology Platform | |
| Payment and Wallet | ||
| Trip Planning and Navigation | ||
| Connectivity and Telematics | ||
| Insurance and Support Services | ||
| By Vehicle Type | Passenger Cars | |
| Micro-Mobility Vehicles (E-Bikes, E-Scooters) | ||
| Shuttles and Buses | ||
| Autonomous Pods | ||
| By Transportation Type | Public | |
| Private | ||
| By Business Model | Subscription (Mobility Bundles, Corporate Plans) | |
| Pay-As-You-Go | ||
| Peer-to-Peer | ||
| Ticketing-Only Aggregator | ||
| By Application | Personal Mobility | |
| Business/Corporate Mobility | ||
| Logistics and Last-Mile Delivery | ||
| By End-User | Individuals | |
| Enterprises | ||
| Government and Municipal Agencies | ||
| By Operating System | iOS | |
| Android | ||
| Others | HarmonyOS | |
| KaiOS | ||
| Windows/PWAs | ||
| By Propulsion | Internal Combustion Engine (ICE) | |
| Electric | ||
| Hybrid | ||
| Hydrogen Fuel-Cell | ||
| By Geography | North America | United States |
| Canada | ||
| Rest of North America | ||
| South America | Brazil | |
| Argentina | ||
| Chile | ||
| Rest of South America | ||
| Europe | Germany | |
| United Kingdom | ||
| France | ||
| Spain | ||
| Italy | ||
| Nordics | ||
| Rest of Europe | ||
| Asia-Pacific | China | |
| India | ||
| Japan | ||
| South Korea | ||
| Australia | ||
| Rest of Asia-Pacific | ||
| Middle East and Africa | Saudi Arabia | |
| United Arab Emirates | ||
| Egypt | ||
| Turkey | ||
| South Africa | ||
| Rest of Middle East and Africa | ||
Key Questions Answered in the Report
What is the current size and growth rate of the mobility-as-a-service market?
The mobility as a service market size was valued at USD 328.98 billion in 2026 and is projected to grow from USD 374.55 billion in 2027 to USD 716.30 billion by 2032 at 13.85% CAGR over 2027-2032.
Which region contributes the most to the mobility-as-a-service market revenue?
Asia-Pacific leads the market with a 34.12% share in 2026, driven by rapid urbanization, rising smartphone penetration, and extensive smart-city investments.
Which service type holds the largest share in 2026?
Ride-hailing accounts for 45.85% of revenue in 2026, supported by extensive driver networks and a large, established user base.
Why are subscription bundles gaining traction?
Subscription bundles provide predictable revenue for service providers and cost savings for frequent users, driving the model at a CAGR of 23.88% during 2027-2032.