Micro Mobility Market Size and Share
Market Overview
| Study Period | 2021 - 2031 |
|---|---|
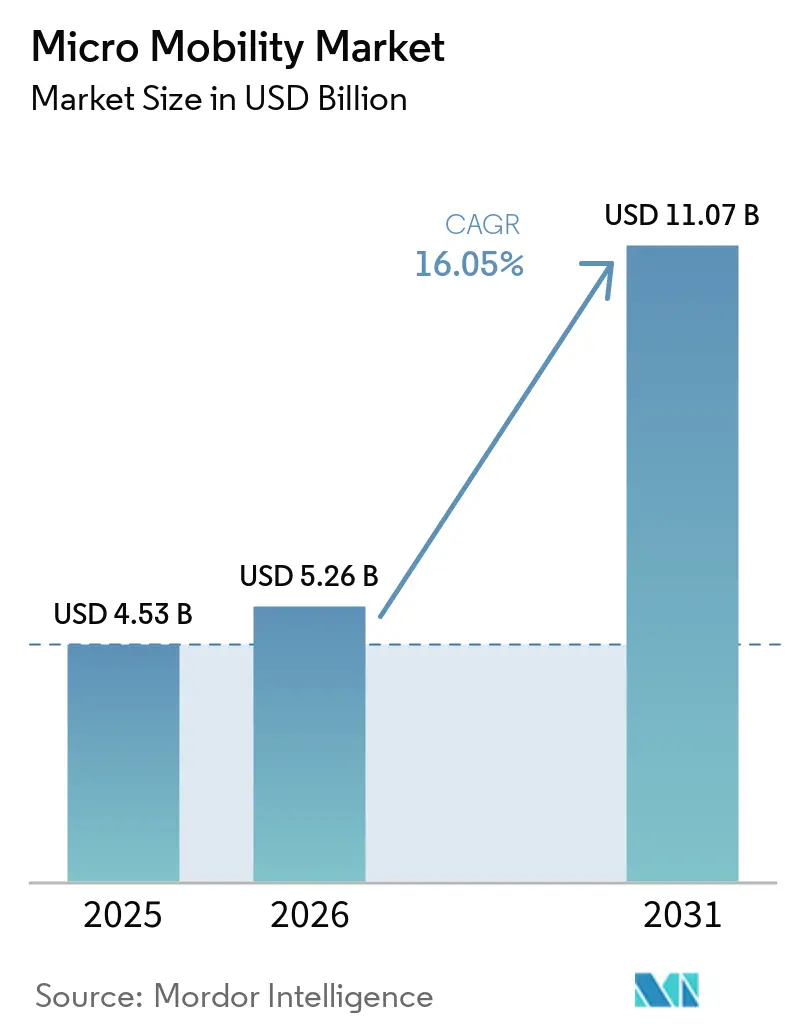
| Market Size (2026) | USD 5.26 Billion |
| Market Size (2031) | USD 11.07 Billion |
| Growth Rate (2026 - 2031) | 16.05% CAGR |
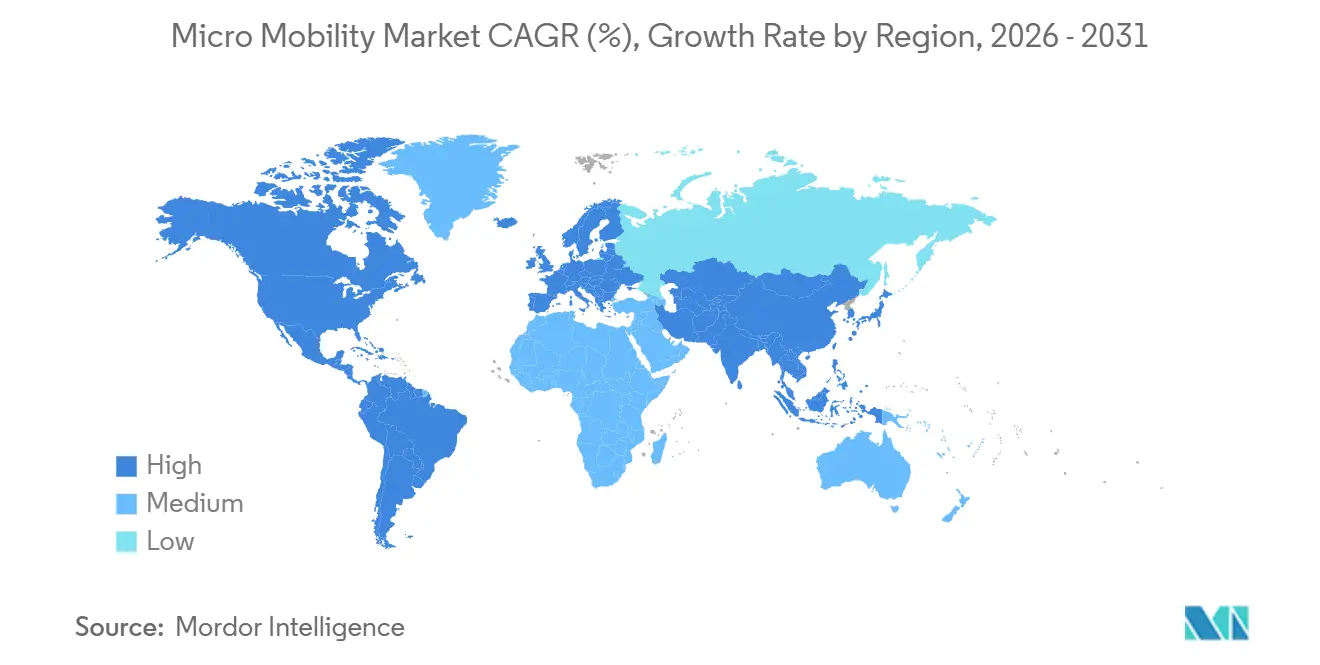
| Fastest Growing Market | Europe |
| Largest Market | Asia Pacific |
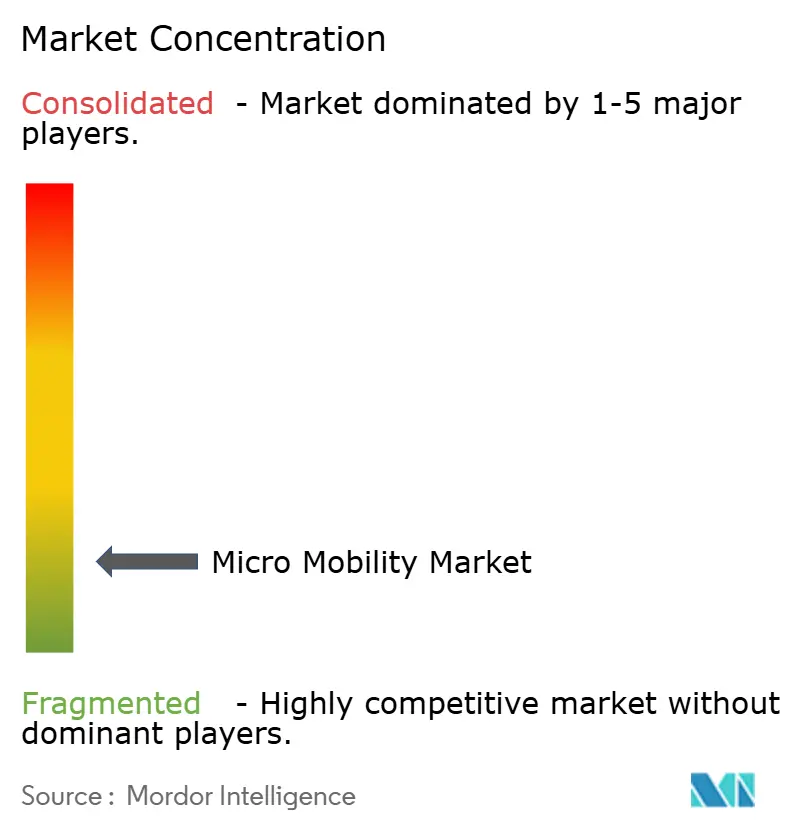
| Market Concentration | Low |
Major Players *Disclaimer: Major Players sorted in no particular order Image © Mordor Intelligence. Reuse requires attribution under CC BY 4.0. | |
Micro Mobility Market Analysis by Mordor Intelligence
The global micro mobility market size was valued at USD 4.53 billion in 2025 and estimated to grow from USD 5.26 billion in 2026 to reach USD 11.07 billion by 2031, at a CAGR of 16.05% during the forecast period (2026-2031). Widespread urban congestion, post-pandemic shifts away from fixed-route transit, and the growing appeal of point-to-point travel underpin brisk adoption in dense cities. Cost declines in lithium-ion batteries and battery-swapping pilots that cut downtime strengthen both private and shared-fleet economics. Asia-Pacific leads by installed base, yet Europe delivers the fastest revenue growth as operators consolidate for profitability. Business models are also evolving, with corporate subscriptions adding stable demand while operators refine fleet analytics to extend vehicle life and improve margins. Finally, municipal purchase incentives and infrastructure grants accelerate household uptake, balancing headwinds from insurance premiums and fragmented safety rules.
Key Report Takeaways
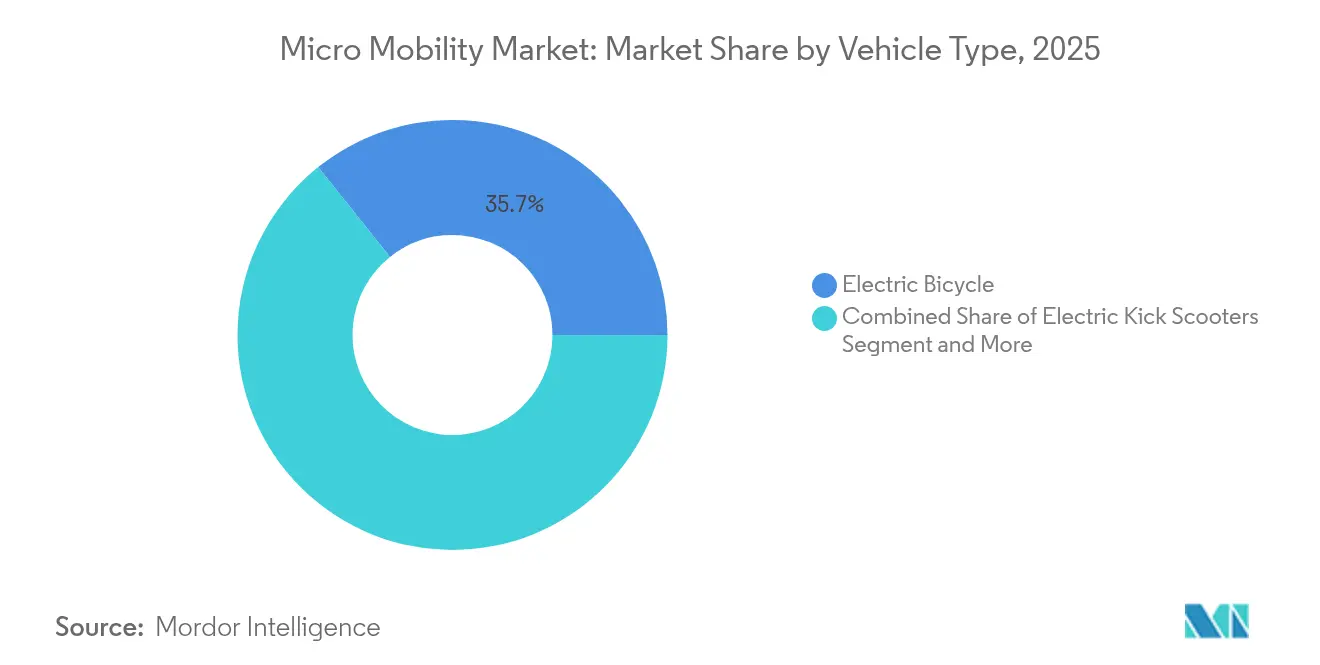
- By vehicle type, electric bicycles led with 35.74% of the micro mobility market share in 2025, while electric cargo bikes are projected to expand at a 23.65% CAGR through 2031.
- By battery type, Li-ion batteries dominated the market with an 82.65% share in 2025 and are expected to grow further at a 16.62% CAGR between 2026 and 2031.
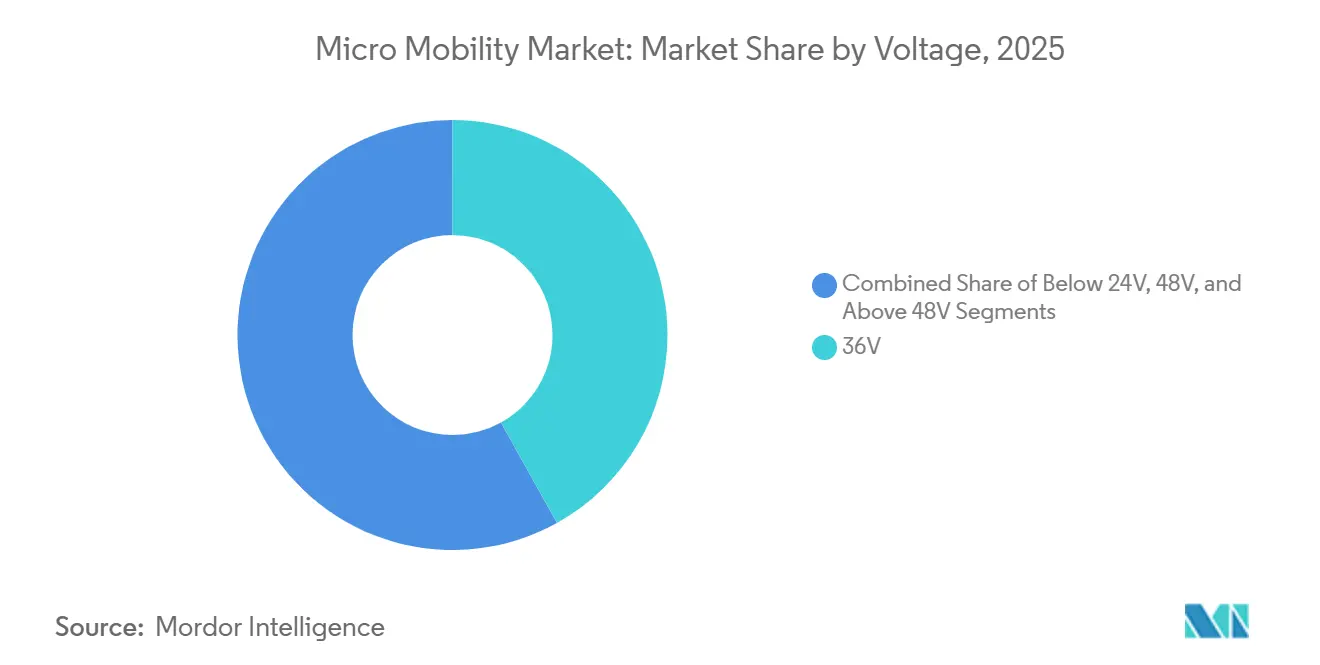
- By voltage level, the 36V segment held the largest share at 41.92% in 2025 in the micro mobility market, whereas the 48V category is anticipated to register the fastest growth, at a CAGR of 18.07% over the forecast period.
- By sharing model, dockless systems accounted for 66.58% of the market in 2025, while subscription-based models are gaining traction and forecast to grow at a 29.85% CAGR from 2026 to 2031.
- By geography, Asia-Pacific dominated the micro mobility market with a 38.05% share in 2025; however, Europe is set to witness the fastest growth, advancing at a CAGR of 18.1% over the same period.
Note: Market size and forecast figures in this report are generated using Mordor Intelligence’s proprietary estimation framework, updated with the latest available data and insights as of 2026.
Global Micro Mobility Market Trends and Insights
Drivers Impact Analysis*
| Driver | (~) % Impact on CAGR Forecast | Geographic Relevance | Impact Timeline |
|---|---|---|---|
| Urban Congestion & Modal Shift | +4.2% | Global, with concentration in North America & Europe | Medium term (2-4 years) |
| Falling Li-Ion Costs | +3.8% | Global, led by APAC manufacturing hubs | Long term (≥ 4 years) |
| Municipal Subsidies & Infrastructure | +2.5% | North America & Europe, selective APAC cities | Short term (≤ 2 years) |
| Corporate Micromobility | +1.8% | North America & Europe corporate centers | Medium term (2-4 years) |
| Used LEV Market Boom | +1.6% | Global, with early adoption in North America | Medium term (2-4 years) |
| AI-Powered Fleet Analytics | +1.1% | Global, concentrated in major metropolitan areas | Long term (≥ 4 years) |
| Source: Mordor Intelligence | |||
Rapid Urban Congestion & Post-Pandemic Modal Shift
Traffic density has climbed 15-20% in major cities since 2024, prompting commuters to seek nimble alternatives that bypass gridlock. The micro mobility market now fills service gaps left when riders reduced bus and rail use for health reasons. As hybrid work alters peak-hour patterns, flexible door-to-door modes such as e-bikes and kick scooters gain traction. Mixed-use districts display the highest uptake because a single vehicle can serve commuting, errands, and leisure needs. City planners have begun incorporating protected lanes and parking corrals into master plans, confirming that the current modal shift is a structural realignment rather than a passing response.
Falling Li-ion Battery Costs Lengthening Range & Duty-Cycles
Global battery pack prices keep sliding, letting manufacturers install larger 48 V units without raising retail prices. Chinese output exceeding 45 million electric two-wheelers a year creates unmatched economies of scale that ripple across the micro mobility market. Modern battery-management systems stretch operational life to 8 years, shrinking total cost of ownership and enabling shared-fleet operators to run profitable depreciation schedules. Swapping networks pioneered in Asia and now spreading to Europe, remove charging downtime, delivering quasi-continuous service to couriers and commuters alike.
Municipal Subsidies & Pop-Up Infrastructure for Active Mobility
More than USD 50 million in e-bike vouchers flowed through U.S. cities in 2024, and federal programs added USD 44.55 million for protected-lane projects. States such as Massachusetts now cover up to 90% of the purchase price for income-qualified buyers, delivering measurable equity gains as 70% of new programs include means-tested provisions. Temporary “pop-up” lanes piloted during pandemic recovery have become permanent corridors. Taken together, these incentives accelerate demand and lift the micro mobility market by improving perceived safety and convenience.
Corporate Micromobility Programs for Employee ESG Targets
Large employers seek verifiable carbon savings and reduced parking spend. Subscription platforms now integrate payroll deductions with fleet maintenance and safety training, replacing 6.5 car trips per week per participating employee. Walmart, Amazon, and Google deploy dedicated charging hubs to reach participation targets, creating consistent weekday demand clusters that bolster operator utilization. Pending U.S. tax legislation modeled on European commuter benefits could amplify uptake, putting additional upward pressure on the micro mobility market.
Restraints Impact Analysis*
| Restraint | (~) % Impact on CAGR Forecast | Geographic Relevance | Impact Timeline |
|---|---|---|---|
| Patchwork Regulations & Vehicle Class Gaps | -2.3% | Global, with particular challenges in Europe & North America | Long term (≥ 4 years) |
| Limited Charging/Parking in Dense Downtowns | -1.7% | Global urban centers, acute in Asia-Pacific megacities | Medium term (2-4 years) |
| Rising Insurance Post Battery Fires | -1.4% | North America & Europe, spreading to other regions | Short term (≤ 2 years) |
| Escalating Per-Vehicle City Fees | -0.9% | Europe & North America, selective implementation | Medium term (2-4 years) |
| Source: Mordor Intelligence | |||
Patchwork Safety Regulations & Vehicle Classification Gaps
Divergent speed caps and power limits force operators to deploy region-specific fleets, hindering scale in the micro mobility market. The European Commission studies a unified Personal Mobility Device category to streamline rules, while U.S. state laws still vary widely on motor wattage and helmet use. New York City introduced Local Law 39 after e-mobility fire costs reached USD 520 million between 2019-2023[1]“E-mobility Fires Cost NYC Nearly USD 520 Million from 2019 to 2023,” UL Standards & Engagement, ulse.org. The resulting insurance uncertainty raises premiums and deters risk-averse consumers.
Insufficient Charging / Parking Bays in Dense Downtowns
Vehicle counts often outpace charging points, creating range anxiety for private owners and rebalancing headaches for fleet managers. Pilot battery-swap cabinets in Manhattan and solar-powered smart docks in Chicago show promise but remain limited in scale. Asian megacities face the steepest siting challenges where sidewalk space is scarce. Without reliable curbside power and secure parking, usage potential of the micro mobility market remains capped despite rising consumer interest.
*Our forecasts treat driver/restraint impacts as directional, not additive. The impact forecasts reflect baseline growth, mix effects, and variable interactions.
Segment Analysis
By Vehicle Type: Cargo Bikes Drive Commercial Transformation
Electric bicycles remained the anchor of the micro mobility market size, capturing 35.74% share in 2025. Growth now tilts toward cargo variants that log a 23.65% CAGR by satisfying last-mile parcel demand in Europe and emerging zero-emission zones. Retailers and logistics firms pivot to front-loading box designs capable of 160 kg payloads, cutting van mileage inside city centers.
Operators favor cargo units because average daily revenue per vehicle runs 45% higher than for standard bikes, offsetting their higher capital cost. Shared scooter fleets continue to serve leisure and first-mile needs, yet expansion cools as operators optimize existing networks for profitability. Mopeds fill the mobility gap in Asian markets where two-wheelers replace cars for everyday travel, underscoring regional diversity within the micro mobility market.
Battery-swap compatibility is emerging as a purchase criterion for commercial buyers who target near-continuous utilization. Yamaha’s Enyring push into Germany and the Netherlands highlights Europe’s growing logistics focus. In contrast, electric skateboards remain a niche pastime with limited regulatory acceptance for street use. Overall, the vehicle mix shows that one platform cannot satisfy every urban task; instead, specialized designs unlock value by matching payload, speed, and range requirements.


By Battery Type: Li-ion Dominance Drives Performance Evolution
Li-ion held 82.65% of the micro mobility market size in 2025 and is on track for a 16.62% CAGR to 2031. The chemistry’s high energy density and falling price enable longer trips without weight penalties, aligning with commuter expectations for 40-60 km real-world range. Advanced battery-management software featuring predictive analytics now extends pack life to 8 years, lowering per-ride depreciation for fleet operators. Manufacturing scale in China supports global supply, while European assemblers add value with robust thermal management to meet stricter safety codes.
Sealed lead-acid persists only in ultra-budget offerings where upfront price outweighs performance, yet its share continues to erode as second-hand Li-ion packs enter the resale market. NiMH remains marginal, restricted to specialized industrial carts or compliance-driven procurement.
By Voltage: 48V Systems Capture Range-Focused Growth
Systems rated at 36V controlled 41.92% of revenue in 2025 in the micro mobility market, an equilibrium where cost, weight, and regulatory compliance meet. Emerging demand for longer range, steeper-grade capability, and cargo hauling accelerates 48V adoption at an 18.07% CAGR. Higher voltage enables peak outputs beyond 800 W while keeping current low for thermal efficiency, extending component life, and climbing ability without oversizing wire harnesses.
The below-24V setups stay relevant in jurisdictions restricting assisted top speed to 20 km/h, catering to entry-level riders and older demographics. Conversely, >48V platforms appeal to performance enthusiasts and commercial couriers who justify premium spend with productivity gains. Universal chargers that auto-detect voltage now reach the field, smoothing customer experience and reducing operator inventory. Voltage stratification thus mirrors user segmentation inside the micro mobility market.
By Sharing Model: Subscription Models Transform Corporate Adoption
Dockless fleets represented 66.58% of revenue in 2025 in the micro mobility market, owing to frictionless pick-up and drop-off that supports spontaneous travel. The model’s capital-light rollout complements city policies that restrict fixed infrastructure. However, subscription services record the highest growth at 29.85% CAGR because they offer predictable monthly cash flow and align with employer ESG programs. Enterprises negotiate fleet access as an employee benefit, bundling maintenance and safety training, which lifts retention.
Dock-based systems still thrive where theft concerns and parking order carry weight, for example, around transit hubs and university campuses. Hybrid approaches emerge in which stations handle overnight charging while dockless use dominates daytime turnover. The sharing landscape, therefore, reflects a portfolio of mechanisms aimed at balancing convenience, cost, municipal rules, and utilization—each one expanding the micro mobility market in complementary ways.
Geography Analysis
Asia-Pacific accounted for 38.05% of the micro mobility market size in 2025, buoyed by China’s installed base of 400 million electric two-wheelers and India’s 1.14 million unit sales in FY2025. Average retail prices near USD 336 in China open ownership to mass segments, while India’s fleet scales on favorable GST rates and domestic manufacturing incentives. The United Nations Environment Programme directs USD 130 million in grants to lower-income Asian and African nations, signaling future upside for exported vehicles and components.
Europe, the fastest-growing region at 18.1% CAGR, benefits from cohesive climate policy and advancing regulatory harmonization. Germany sold 2.05 million e-bikes in 2024, representing 53% of domestic bicycle volume even as average prices dipped. Operators amalgamate to chase scale economies, most notably the Tier-Dott union worth EUR 150 million. Profit focus intensifies, illustrated by Voi’s EUR 17.2 million EBITDA in 2024 and debt refinancing via a EUR 50 million bond. As cities enforce low-emission zones, cargo bikes accelerate adoption by logistics firms seeking tariff-free access.
North America posts a 17.72% CAGR on the back of more than USD 50 million in local purchase subsidies and USD 44.55 million in federal active-transport grants. Lime shows commercial viability with two straight years of positive cash flow and an IPO roadmap, backed by an Uber partnership that funnels riders from an established app user base. Yet safety fears weigh on sentiment after New York City quantified USD 520 million in fire-related costs. Pending constructive rules and expanding curbside charging stand to unlock further market depth.

Competitive Landscape
The micro mobility market now sits in a consolidation phase. Lime leads, sustaining margin through proprietary swappable batteries, AI-driven fleet diagnostics, and scale partnerships. Bird’s sale to Third Lane Mobility underscores price discipline as investors favor cash-generating operations. Mergers such as Tier-Dott place a premium on geographic overlap, cost reduction, and combined ridership to lift utilization.
Technology, rather than pure vehicle differentiation, drives durable advantage. Swappable battery ecosystems compress downtime to minutes, supporting gig-economy couriers that value availability over aesthetics. Predictive maintenance from telematics reduces unscheduled repairs by up to 30%, directly improving EBITDA. Operators with strong data science teams thus outpace rivals that focus solely on headcount or territory.
White-space remains in corporate subscriptions where RidePanda secures enterprise contracts with Amazon and Google, bundling theft insurance and safe-riding tutorials. At the component level, battery suppliers vie to provide eight-year warranty packs that lower total fleet cost. Competitive intensity therefore shifts from land-grab to efficiency, setting the stage for moderate consolidation and the entrance of industrial incumbents attracted by clearer profit pools.
Micro Mobility Industry Leaders
Bird Global, Inc.
Lime Micromobility
Voi Technology
Dott
Bolt Technology OÜ
- *Disclaimer: Major Players sorted in no particular order

Recent Industry Developments
- January 2025: Lime renewed its multiyear agreement with Uber, keeping platform integration ahead of an anticipated IPO.
- April 2024: Lime committed USD 55 million to add 30,000 bikes across three continents, citing a 32% rise in gross bookings.
- February 2024: Yamaha created Enyring to deploy e-bike battery-swap stations in Germany and the Netherlands by 2025.


Research Methodology Framework and Report Scope
Market Definitions and Key Coverage
Our study defines the micro-mobility market as the annual revenue generated from sales and short-term rentals of lightweight electric or human-powered vehicles, principally e-bikes, kick scooters, skateboards, and low-speed mopeds, that travel below 45 km/h and serve trips under 10 kilometers. Mordor Intelligence sizes the global market at USD 4.53 billion in 2025 and projects USD 9.61 billion by 2030, reflecting a 16.2 percent CAGR.
Custom and performance motorcycles, personal mobility aids, and purely pedal bicycles without an electric assist are excluded to avoid inflating totals with dissimilar product economics.
Segmentation Overview
- By Vehicle Type
- Electric Kick Scooters
- Electric Mopeds
- Electric Bicycles
- Electric Skateboards
- Electric Cargo Bikes
- By Battery Type
- Sealed Lead Acid
- NiMH
- Li-ion
- By Voltage
- Below 24V
- 36V
- 48V
- Above 48V
- By Sharing Model
- Docked
- Dockless
- Subscription-based
- By Geography
- North America
- United States
- Canada
- Mexico
- South America
- Brazil
- Argentina
- Rest of South America
- Europe
- Germany
- United Kingdom
- France
- Italy
- Spain
- Russia
- Rest of Europe
- Asia-Pacific
- China
- Japan
- India
- South Korea
- Australia
- New Zealand
- Rest of Asia-Pacific
- Middle East & Africa
- Middle East
- United Arab Emirates
- Turkey
- Israel
- Saudi Arabia
- Rest of Middle East
- Africa
- South Africa
- Nigeria
- Kenya
- Rest of Africa
- Middle East
- North America
Detailed Research Methodology and Data Validation
Primary Research
Mordor analysts interviewed shared-fleet operators, last-mile delivery aggregators, battery-pack suppliers, and municipal transport officials across North America, Europe, and Asia-Pacific. Discussions provided real-world inputs on fleet utilization, subsidy uptake, insurance costs, and expected price trajectories, which we used to stress-test secondary findings and refine regional assumptions.
Desk Research
We first mapped the universe using publicly available data from agencies such as NACTO, Eurostat, the International Transport Forum, and UN DESA, which detail urban trip volumes, modal splits, and vehicle stock. Trade-flow statistics from UN Comtrade, import/export dashboards like Volza, and battery price trackers from the International Energy Agency helped ground unit counts and average selling prices. Company 10-Ks, city fleet license registries, and global news coverage accessed through Dow Jones Factiva allowed us to trace expansion announcements and fee schedules that move service revenues. Paid resources, including D&B Hoovers for operator financials and Marklines for electric two-wheeler build-outs, filled firm-level gaps. The sources listed are illustrative; many additional references supported validation and clarification throughout the study.
Market-Sizing & Forecasting
We begin with a top-down reconstruction: urban population × average trips per capita × observed micro-mobility modal share, adjusted for vehicle life and fleet turnover. Select bottom-up checks, import volumes of e-bikes, city license caps, and sampled ASP × unit roll-ups, anchor the totals before reconciliation. Key variables include lithium-ion pack cost curves, commuter willingness to shift under 10 km, city-level subsidy budgets, smartphone penetration, and seasonality in dockless ridership. A multivariate regression model coupled with scenario analysis forecasts each driver, after which results are reviewed against expert consensus. When bottom-up evidence is thin, we interpolate using nearest-market benchmarks and flag confidence ranges.
Data Validation & Update Cycle
Outputs pass a three-layer review: automated variance checks, peer analyst scrutiny, and senior sign-off. Material deviations trigger source re-verification. We refresh models annually and issue interim updates if major policy, pricing, or technology shifts occur. A final sense-check is performed just before client delivery.
Why Mordor's Micro Mobility Baseline Commands Reliability
Published estimates differ widely because firms pick different revenue pools, forecast horizons, and refresh cadences. Industry trackers, for instance, quote 2025 market values of roughly USD 46 billion and USD 75 billion when shared-fleet fares, accessories, and advertising flows are folded in.
Key gap drivers include: Scope breadth, some studies merge hardware sales with ride fares and ancillary services, whereas Mordor focuses on core vehicle and rental revenue streams. Variable selection, others extrapolate from passenger-kilometer spend; we rely on physically verifiable units and tariffs. Update rhythm, our twelve-month cadence captures subsidy revisions and battery cost drops sooner, limiting forecast drift.
Benchmark comparison
| Market Size | Anonymized source | Primary gap driver |
|---|---|---|
| USD 4.53 B | Mordor Intelligence | - |
| USD 5.05 B | Regional Consultancy A | Counts only three APAC nations and omits city rental fees |
| USD 46.3 B | Global Consultancy B | Adds fleet ride revenue, aftermarket parts, and advertising income |
| USD 75.1 B | Industry Association C | Aggregates passenger-kilometer spend and applies aggressive penetration rates |
Taken together, the comparison shows that by ring-fencing a clearly defined revenue pool, cross-checking with ground-level datasets, and revisiting models every year, our baseline offers decision-makers a balanced, transparent figure they can trace back to explicit variables and repeatable steps.


Key Questions Answered in the Report
What is the current size of the light electric vehicle micromobility market?
The market is valued at USD 5.26 billion in 2026 and is forecast to expand at a 16.05% CAGR through 2031.
Which region leads in revenue today?
Asia-Pacific holds the largest regional share at 38.05% thanks to China’s and India’s high two-wheeler volumes.
Where is the fastest regional growth expected?
Europe is projected to post the quickest expansion at an 18.1% CAGR between 2026-2031 as operators consolidate and regulations harmonize.
Which vehicle type is growing the fastest?
Electric cargo bikes show the highest growth rate at 23.65% CAGR, driven by last-mile delivery demand.
What battery chemistry dominates the industry?
Lithium-ion technology accounts for 82.65% of total market share and benefits from falling costs and longer lifespans.
How are business models evolving?
Dockless sharing still commands 66.58% of revenue, but subscription services aimed at corporate ESG goals are growing quickest at 29.85% CAGR.
Page last updated on:


