Shared Mobility Market Size and Share
Market Overview
| Study Period | 2020 - 2031 |
|---|---|
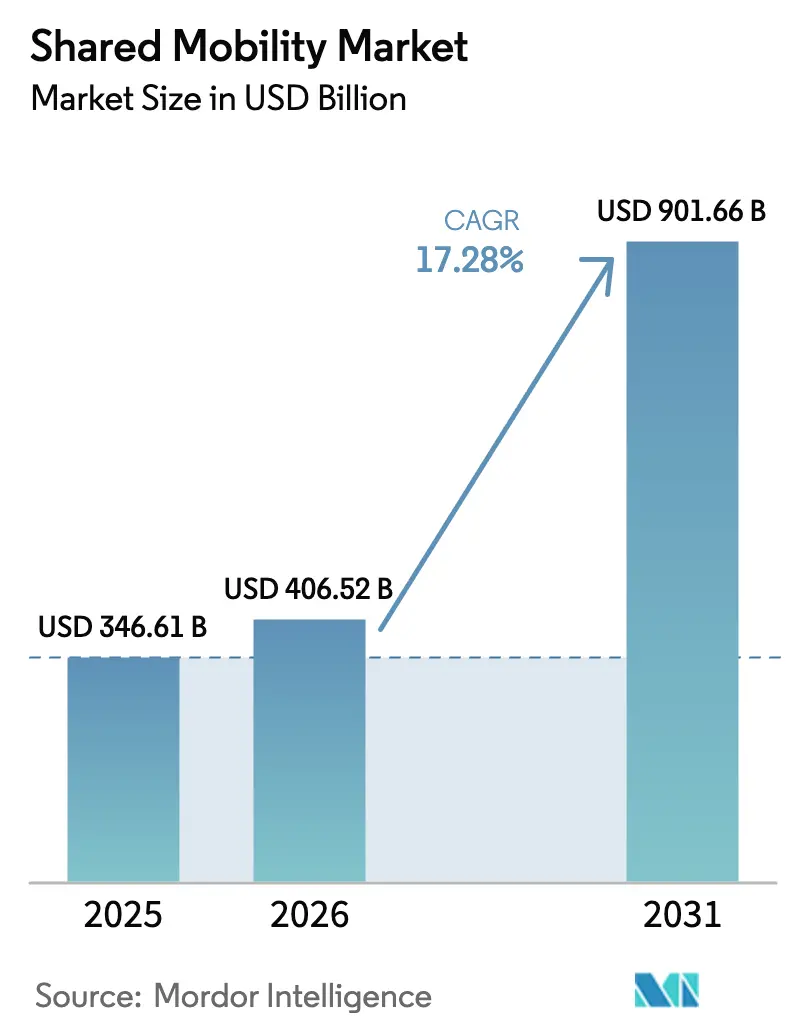
| Market Size (2026) | USD 406.52 Billion |
| Market Size (2031) | USD 901.66 Billion |
| Growth Rate (2026 - 2031) | 17.28% CAGR |
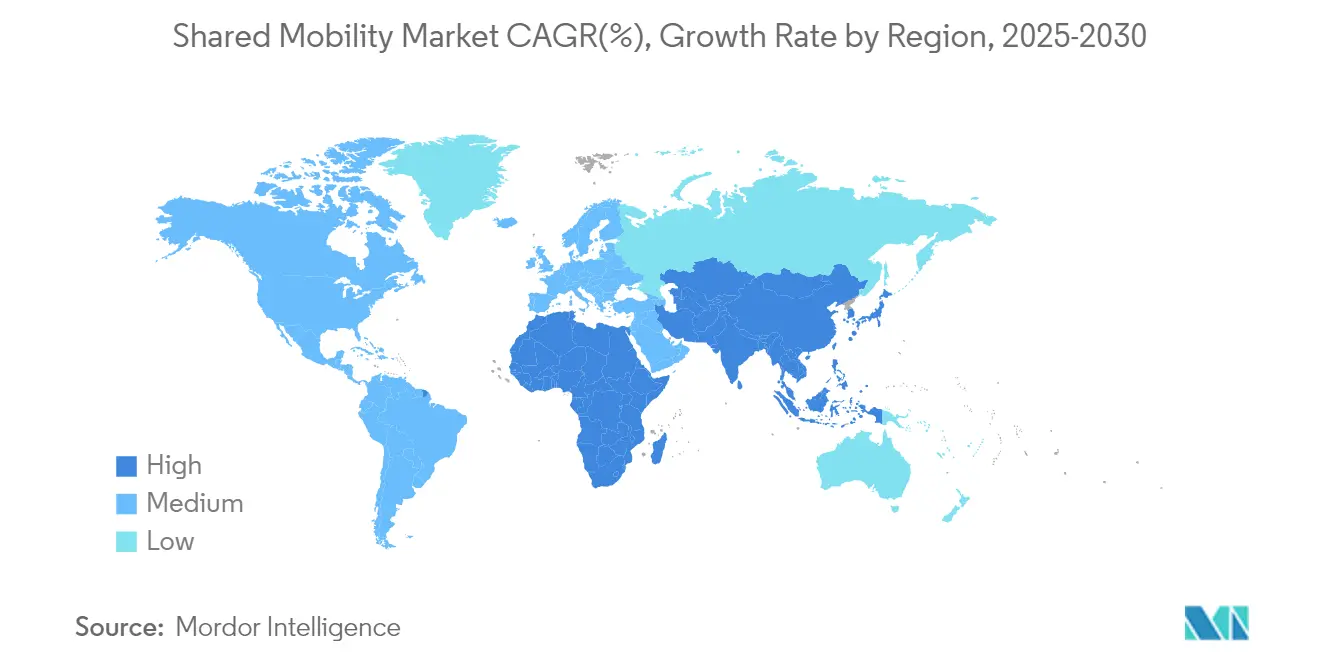
| Fastest Growing Market | North America |
| Largest Market | Asia Pacific |
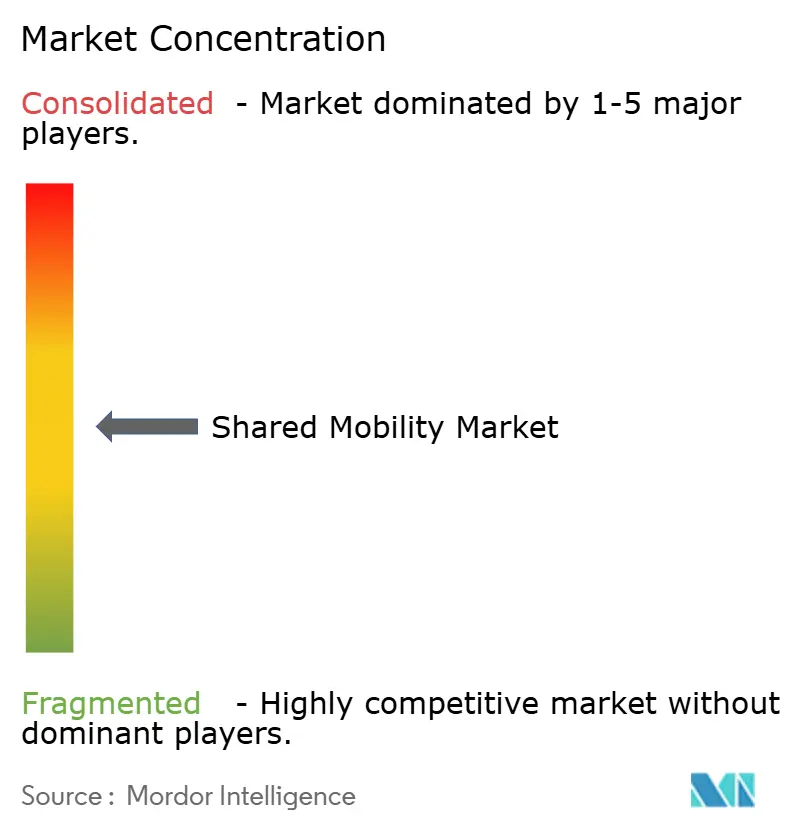
| Market Concentration | Medium |
Major Players *Disclaimer: Major Players sorted in no particular order Image © Mordor Intelligence. Reuse requires attribution under CC BY 4.0. | |
Shared Mobility Market Analysis by Mordor Intelligence
Shared Mobility Market size market size in 2026 is estimated at USD 406.52 billion, growing from 2025 value of USD 346.61 billion with 2031 projections showing USD 901.66 billion, growing at 17.28% CAGR over 2026-2031. This steep trajectory reflects the global pivot from private car ownership toward on-demand, multimodal services that blend ride-hailing, micromobility, car sharing, and corporate mobility subscriptions. Battery-swap hubs and broader charging networks keep shared electric fleets on the road around the clock. At the same time, smartphone penetration above 80% in most urban markets removes nearly all discovery and payment frictions. Digital platforms also scale faster because ride-hailing drivers are adopting electric cars at a rate five times higher than private owners, compressing the total cost of ownership and meeting city-level net-zero mandates. Competitive energy remains intense as market leaders forge autonomous-vehicle alliances, consolidate regionally, and embed AI assistants that personalize trip selection. Even so, licensing caps, critical minerals bottlenecks, and grid constraints continue to temper near-term expansion in certain cities.
Key Report Takeaways
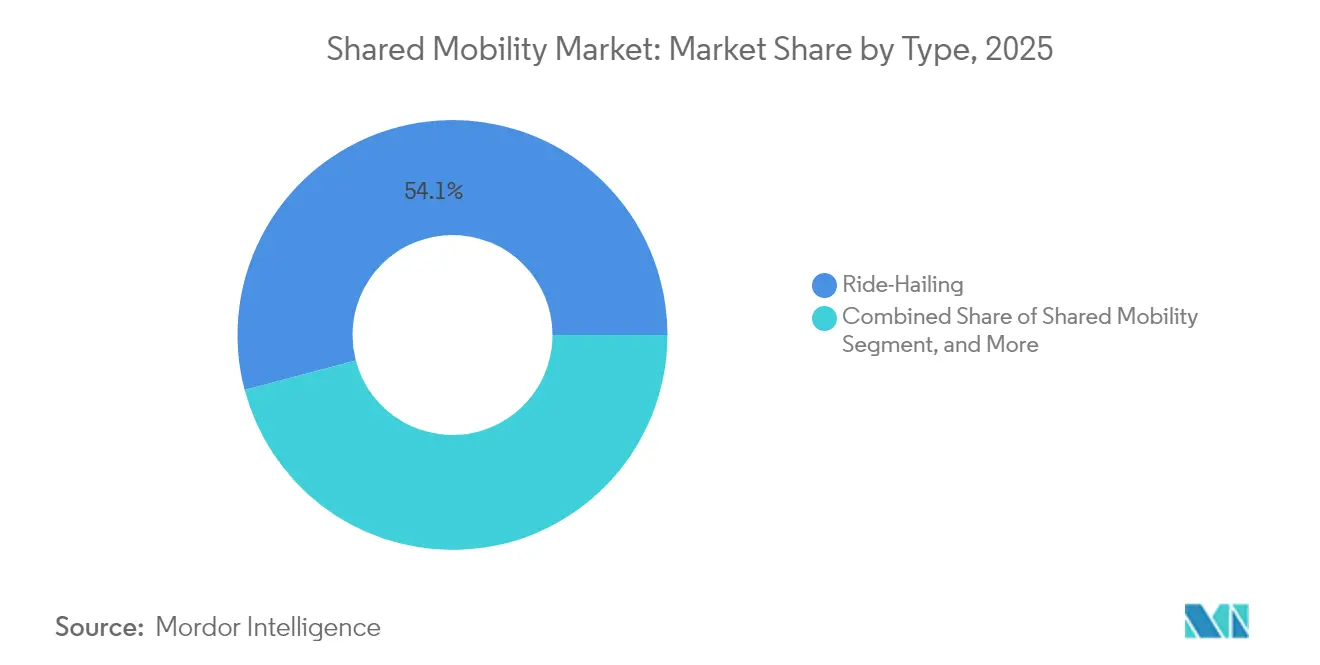
- By type, ride-hailing held 54.12% of the shared mobility market share in 2025, while shared micromobility is forecast to grow the fastest at a 13.21% CAGR through 2031.
- By vehicle category, passenger cars captured 64.78% of the shared mobility market share in 2025, whereas two-wheelers are projected to expand at a 9.52% CAGR to 2031.
- By business model, the B2C segment accounted for 67.62% of the shared mobility market size in 2025; peer-to-peer platforms are advancing at an 8.31% CAGR during the same horizon.
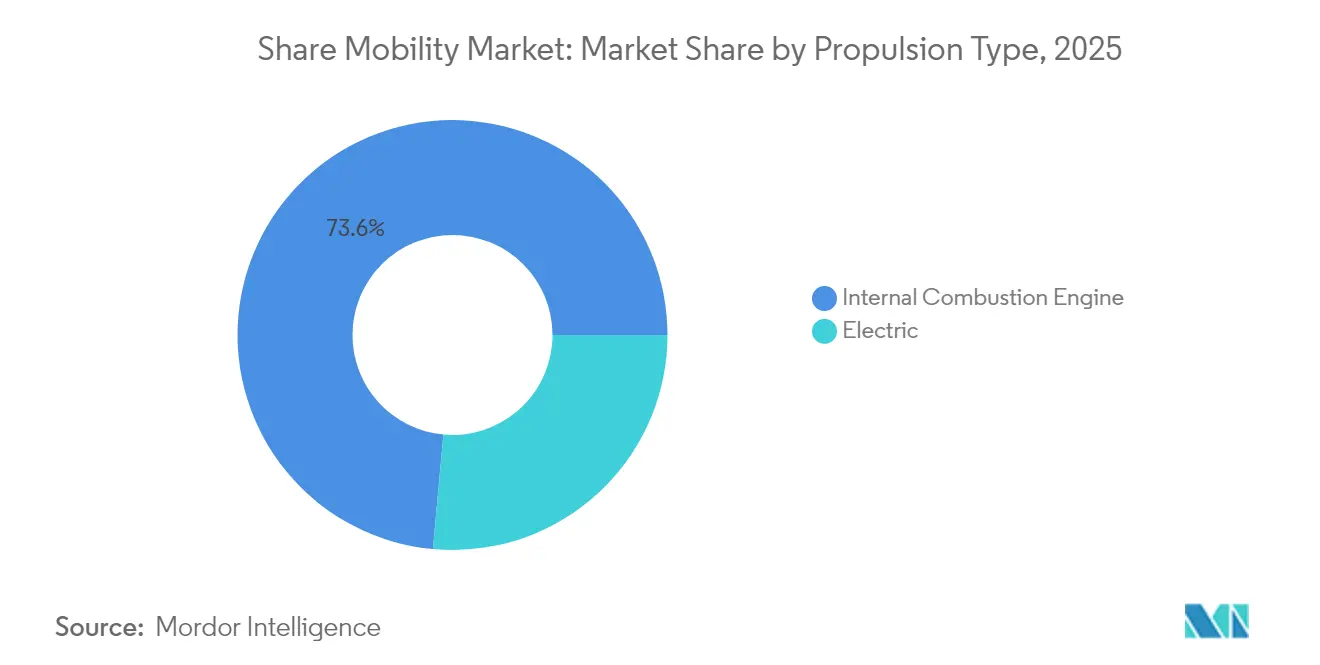
- Internal-combustion fleets retained 73.55% of the shared mobility market share in 2025 by propulsion, yet electric vehicles will post the highest 15.26% CAGR to 2031.
- By autonomy level, human-driven operations dominated the shared mobility market, with 92.21% of the share in 2025, while robotaxi services led growth at 7.28% CAGR.
- By geography, Asia-Pacific led 36.32% with the shared mobility market share in 2025; North America exhibits the fastest 13.49% CAGR through 2031.
Note: Market size and forecast figures in this report are generated using Mordor Intelligence’s proprietary estimation framework, updated with the latest available data and insights as of 2026.
Global Shared Mobility Market Trends and Insights
Drivers Impact Analysis*
| Driver | (~) % Impact on CAGR Forecast | Geographic Relevance | Impact Timeline |
|---|---|---|---|
| Growing ride-hailing preference | +3.2% | Global, strongest in Asia-Pacific and North America | Medium term (2-4 years) |
| Rising private-car costs & congestion | +4.1% | North America & EU, extending to Asia-Pacific | Long term (≥4 years) |
| Expanding smartphone & e-wallet use | +2.8% | Asia-Pacific core, MEA & South America spillover | Short term (≤2 years) |
| Battery-swap hubs for e-micromobility | +1.9% | China lead, pilots in EU & North America | Medium term (2-4 years) |
| Corporate net-zero mobility pledges | +2.3% | North America & EU, early Asia-Pacific uptake | Medium term (2-4 years) |
| Rise of transit super-apps | +1.7% | EU leadership, North America & Asia-Pacific next | Long term (≥4 years) |
| Source: Mordor Intelligence | |||
Increasing Consumer Preference for Ride-Hailing Services
Ride-hailing now penetrates secondary cities where fixed-route commuter options are scarce, underscoring demand for affordable, predictable travel. Uber’s Route Share charges half the price of a typical UberX ride, unlocking a substantial USD 150 billion under-utilized vehicle pool in the United States. Younger adults, motivated by cost and sustainability, skip car ownership entirely and default to app-based access. Enterprises amplify this shift by embedding ride-hailing into travel policies, showcased by Delta Air Lines’ AI-enabled concierge that sequences airport transfers. On-demand rides remain the rational economic choice in dense corridors where parking outlays exceed USD 5,000 per year. These dynamics collectively push the shared mobility market deeper into daily commuting rather than discretionary outings.
Rising Cost of Private Vehicle Ownership & Urban Congestion
Insurance, parking, and maintenance now rise faster than general inflation, particularly in North America and Western Europe, compelling asset-light travel. Enterprise Mobility’s Commute with Enterprise program eliminated 49,000 cars from U.S. roads and trimmed commuter miles measurably, easing bottlenecks[1] “Commute with Enterprise Program Results,”, Enterprise Mobility, enterprisemobility.com. Congestion pricing and low-emission zones further penalize single-occupancy vehicles, nudging commuters toward shared fleets that qualify for regulatory incentives.
Growing Smartphone and E-Wallet Penetration
Seamless digital payments underpin frictionless booking, particularly across Southeast Asia, where cash usage once dominated. Grab’s financial services arm posted 38% revenue growth in 2024 by cross-selling e-wallet functions to nearly 44 million monthly mobility users[2]“Grab Posts Record Profitability in Q1 2025,”, The Asian Banker, theasianbanker.com. Smartphone saturation above 80% in major metros turns every resident into a prospective rider. Uber’s GPT-4o EV adviser, rolled out in early 2025, guides drivers toward optimal charging windows, lifting driver utilization. Regionally, mobile-first India and Indonesia see e-wallet adoption exceed 60% of urban transactions, expanding the total addressable base for the shared mobility market in those economies.
Transit “Super-Apps” Integrating Public & Shared Mobility APIs
Europe leads with MaaS platforms that unify public transit, micromobility, and ride-hailing under one interface, reducing wait-time variability and payment friction. Helsinki’s Whim and Berlin’s Jelbi prove that multimodal bundles can elevate public-transit load factors by over 10%. Municipal agencies support API standardization, enabling third-party developers to layer personalized routing and carbon scores. The rising super-app movement fosters network effects that lock in daily riders, strengthening the long-term revenue runway for the shared mobility market.
Restraints Impact Analysis*
| Restraint | (~) % Impact on CAGR Forecast | Geographic Relevance | Impact Timeline |
|---|---|---|---|
| Licensing caps on ride-hailing fleets | -2.7% | EU & select North American metros, spreading in Asia-Pacific | Short term (≤2 years) |
| Passenger safety & data-privacy concerns | -1.8% | Global, heightened in EU & North America | Medium term (2-4 years) |
| Critical-minerals shortages for EVs | -2.1% | Worldwide, most acute in North America & EU | Long term (≥4 years) |
| Undersized urban grids for high-capacity charging | -1.4% | Emerging Asia-Pacific & MEA cities, parts of North America | Medium term (2-4 years) |
| Source: Mordor Intelligence | |||
Stringent Local Licensing & Cap Schemes on Ride-Hailing Vehicles
Spain’s 2023 VTC decree and New York City’s cap on new for-hire licenses exemplify political pushback aimed at congestion and labor concerns. California’s Senate Bill 915 allows large cities to create bespoke autonomous-vehicle ordinances, risking a patchwork of rules. Compliance professionals must now monitor dozens of local filings, raising the fixed-cost base and deterring smaller entrants. License scarcity also inflates secondary-market plate prices, indirectly pressing fares upward. Collectively, such regulations shave growth from the shared mobility market in mature cities even as green-field markets remain open.
Passenger Safety & Data-Privacy Concerns
In Europe, GDPR constrains behavioral data storage, restricting algorithmic pricing and driver-matching improvements. U.S. regulators are considering extending drug-and-alcohol testing norms to ride-hailing drivers, which will increase onboarding costs. Autonomy adds another layer: despite technical gains, public polls show only 27% of Americans are comfortable riding uncrewed vehicles. Elevated risk perception forces operators to invest heavily in redundant safety measures, buffering but not halting the expansion of the shared mobility market.
*Our forecasts treat driver/restraint impacts as directional, not additive. The impact forecasts reflect baseline growth, mix effects, and variable interactions.
Segment Analysis
By Type: Ride-Hailing Dominance Faces Micromobility Disruption
Ride-hailing services accounted for a 54.12% shared mobility market size in 2025, underlining their entrenched network density and broad user cohorts. Growth, however, tilts toward shared e-bikes and e-scooters that deliver a 13.21% CAGR through 2031 as consumers splice longer ride-hailing trips with first-mile micromobility. In parallel, car-sharing programs rebound alongside tourism recovery, while rental services gain from pent-up corporate travel demand.
Consumers now treat mobility like a phone plan, blending pay-as-you-go rides with monthly passes. Platform algorithms surface the cheapest multimodal permutation, increasing cross-sell and lifetime value. Ride-hailing incumbents respond by adding dockless bikes and fixed-route shuttles to defend wallet share. Urban policy also nudges adoption: cities cap ride-hailing permits yet subsidize micromobility docks, balancing curb use. These countervailing forces help stabilize the broader shared mobility market even as individual modes fluctuate


By Vehicle Type: Passenger Cars Lead While Two-Wheelers Accelerate
Passenger cars controlled 64.78% of revenue in 2025, reflecting user comfort and regulatory familiarity. Still, two-wheelers log the briskest 9.52% CAGR through 2031, especially in Asian megacities where narrow streets and congested corridors favor agile formats. Ola seized a 39% share of India’s electric two-wheeler segment in 2025, keeping sales momentum despite sub-6% EV penetration across the wider market.
The cost gap between compact cars and high-volume scooters widens as fuel-price volatility returns, directing price-sensitive riders to two-wheelers. Logistics apps also adopt e-mopeds for last-mile delivery, boosting off-peak utilization. Meanwhile, passenger-car fleets pivot to electric sedans and crossovers that promise longer range, aligning with corporate decarbonization pledges. This mixed demand profile cushions the overall shared mobility market against segment-specific shocks.
By Business Model: B2C Dominance Shifts Toward P2P Innovation
Business-to-Consumer operators captured 67.62% of the shared mobility market share in 2025, yet peer-to-peer platforms outpace with an 8.31% CAGR. Turo’s tie-up with Uber Rent gives private hosts access to the latter’s distribution, reinvigorating growth after year-over-year deceleration. Corporations join the fray, rolling out B2B subscriptions that bundle fleet leasing, insurance, and carbon tracking.
Digital escrow, telematics, and instant damage detection reduce the historic friction of P2P rentals, allowing shorter check-out windows and near-real-time pricing. Hybrid models emerge where professional fleet managers oversee P2P vehicles during idle periods, boosting asset productivity. This convergence enriches consumer choice and underscores the adaptability of the shared mobility market.
By Propulsion: Electric Transition Accelerates Fleet Adoption
Internal-combustion engines still form 73.55% of deployed vehicles, but electric drivetrains scale at a 15.26% CAGR, fueled by total-cost-of-ownership parity and faster amortization at high utilization rates. Uber and BYD committed to 100,000 new EV units across Europe and Latin America, complemented by bespoke financing that lowers driver onboarding barriers. California’s Clean Miles Standard compels ride-hail fleets to be 90% electric by 2030, adding regulatory certainty.
Battery-swap ecosystems reduce downtime, pushing daily EV utilization toward traditional ICE benchmarks. Academic studies show electrifying transportation-network-company vehicles cuts emissions three times more than private EV adoption at identical penetration, owing to fleet mileage intensity. The resulting credibility edge cements electric adoption at the heart of the shared mobility market.
By Autonomy Level: Human-Driven Operations Prepare for Robo-Taxi Integration
Human-driven rides held 92.21% of trips in 2025, but robotaxi services will witness a 7.28% CAGR through 2031 as pilots converted to full commercial routes. Waymo’s USD 5.6 billion raise capped the biggest autonomous-driving funding round to date, facilitating expansion to Washington, D.C. in 2026. Uber maintains a technology-agnostic stance, inking deals with WeRide, Pony.ai, and Volkswagen to hedge regulatory or hardware setbacks.
Labor savings, 24/7 availability, and safer driving profiles motivate platform operators to accelerate autonomous rollouts, yet public acceptance remains tepid outside early adopters. Hybrid dispatch models—where AVs handle low-complexity routes and human drivers focus on premium rides—are likely through the decade. This phased integration supports steady scaling of autonomy within the shared mobility market without abrupt labor displacement
Geography Analysis
Asia-Pacific held 36.32% of 2025 revenue, anchored by China’s normalization and Southeast Asia’s super-app ecosystems. Didi posted 8.5% Q1 2025 revenue growth after the regulatory thaw, regaining pricing power. Grab posted USD 773 million Q1 2025 revenue and 18% year-on-year growth as user onboarding rebounded, demonstrating platform resilience. India offers mixed signals: Ola’s electric two-wheelers scale rapidly, yet scooter demand slips post-IPO amid infrastructure gaps. Smartphone ubiquity and digital wallets keep customer-acquisition costs low, reinforcing Asia-Pacific’s pillar role in the shared mobility market.
North America is projected to log a 13.49% CAGR to 2031, making it the fastest-growing territory. Lyft achieved its first full-year GAAP profit on USD 5.8 billion revenue in 2024, delivering 828 million rides even before its FreeNow acquisition extends reach to 11 European markets. Corporate vanpool schemes remove thousands of commuter vehicles, while autonomous-vehicle pilots spread from Phoenix to Austin and Los Angeles. State-level EV mandates and federal infrastructure grants subsidize charging corridors, advancing the region’s electrification pace and further enlarging the shared mobility market size.
Europe posts steady mid-teen growth, propelled by regulatory consistency around alternative-fuel corridors and integrated ticketing. Regulation 2023/1804 sets binding targets for public charging density, aligning municipal incentives with platform expansion. Mobility wallets in Germany, France, and the Nordics subsume company-car allowances, channeling corporate traffic into pooled services. M&A, such as EasyPark’s Flowbird takeover, consolidates parking, ticketing, and curb-management data under one roof, increasing operational leverage. Fragmented municipal regulation persists, yet overarching EU directives put a floor under the shared mobility market’s regional outlook.

Competitive Landscape
The shared mobility market shows moderate fragmentation: regional super-apps dominate Asia, dual giants compete in North America, and local champions thrive in Europe. Competitive levers emphasize technology over price: fleet electrification, autonomous alliances, and AI-based dispatch optimization. Uber remains platform-agnostic, sewing partnerships with WeRide, Pony.ai, Waymo, and Volkswagen to avoid single-supplier risk. Didi and Grab exploit home-market regulatory know-how, achieving positive EBITDA ahead of many Western peers.
Cross-border acquisitions intensify. Lyft’s EUR 175 million FreeNow buyout nearly doubles its reachable user base. EasyPark’s purchase of Flowbird bundles on-street parking and transit payments created a one-stop data platform coveted by cities. Battery-swap operators seek vertical partnerships, with CATL’s infrastructure build-out dovetailing with mobility platforms that crave minimal downtime. Emerging disruptors focus on enterprise subscriptions, energy services, and multimodal orchestration rather than direct ride-hailing confrontation, broadening the strategic chessboard inside the shared mobility market.
Shared Mobility Industry Leaders
Uber Technologies, Inc.
DiDi Chuxing
Lyft Inc.
Grab Holdings Inc.
Hertz
- *Disclaimer: Major Players sorted in no particular order

Recent Industry Developments
- June 2025: Uber and WeRide committed to deploy autonomous vehicles in 15 additional cities over five years, with Uber handling fleet operations.
- May 2025: Pony.ai and Uber announced Middle East robotaxi launches with expansion plans worldwide.
- April 2025: Lyft agreed to acquire European taxi app FreeNow for EUR 175 million, extending operations to 11 countries.
- April 2025: Uber and Volkswagen partnered to introduce ID Buzz robotaxis in Los Angeles by 2026.


Global Shared Mobility Market Report Scope
Shared mobility refers to a variety of transportation services, including ride-hailing, bike-sharing, car-sharing, rental and leasing, shuttle services, and bus services. These types of services can be availed individually or as a group to share the cost of the trip.
The shared mobility market is segmented by type, vehicle type, business model, propulsion type, and geography. By type, the market is segmented into ride-hailing, car sharing, shared micro-mobility (e-bikes, e-scooters, etc.), rental and leasing, and others (shuttle services, bus services, etc.). By vehicle type, the market is segmented into passenger cars, light commercial vehicles (pickup vans, etc.), buses and coaches, and two-wheelers. By business model, the market is segmented into peer-to-peer (P2P), business-to-business (B2B), and business-to-consumer (B2C). By propulsion type, the market is segmented into internal combustion engine (ICE) and electric. By geography, the market is segmented into North America, Europe, Asia-Pacific, and Rest of the World.
The report offers market size and forecasts for the shared mobility in value (USD) for all the above segments.
| Ride-Hailing |
| Car Sharing |
| Shared Micromobility (e-bikes, e-scooters, etc.) |
| Rental & Leasing |
| Shuttle & Bus Services |
| Passenger Cars |
| Light Commercial Vehicles |
| Buses & Coaches |
| Two-Wheelers |
| Peer-to-Peer (P2P) |
| Business-to-Business (B2B) |
| Business-to-Consumer (B2C) |
| Internal Combustion Engine (ICE) |
| Electric |
| Human-Driven |
| Level-4/5 Robo-Taxi |
| North America | United States |
| Canada | |
| Rest of North America | |
| South America | Brazil |
| Argentina | |
| Rest of South America | |
| Europe | Germany |
| United Kingdom | |
| France | |
| Italy | |
| Spain | |
| Rest of Europe | |
| Asia-Pacific | China |
| India | |
| Japan | |
| South Korea | |
| Australia | |
| Rest of Asia-Pacific | |
| Middle East and Africa | United Arab Emirates |
| Saudi Arabia | |
| South Africa | |
| Rest of Middle East and Africa |
| By Type | Ride-Hailing | |
| Car Sharing | ||
| Shared Micromobility (e-bikes, e-scooters, etc.) | ||
| Rental & Leasing | ||
| Shuttle & Bus Services | ||
| By Vehicle Type | Passenger Cars | |
| Light Commercial Vehicles | ||
| Buses & Coaches | ||
| Two-Wheelers | ||
| By Business Model | Peer-to-Peer (P2P) | |
| Business-to-Business (B2B) | ||
| Business-to-Consumer (B2C) | ||
| By Propulsion Type | Internal Combustion Engine (ICE) | |
| Electric | ||
| By Autonomy Level | Human-Driven | |
| Level-4/5 Robo-Taxi | ||
| By Geography | North America | United States |
| Canada | ||
| Rest of North America | ||
| South America | Brazil | |
| Argentina | ||
| Rest of South America | ||
| Europe | Germany | |
| United Kingdom | ||
| France | ||
| Italy | ||
| Spain | ||
| Rest of Europe | ||
| Asia-Pacific | China | |
| India | ||
| Japan | ||
| South Korea | ||
| Australia | ||
| Rest of Asia-Pacific | ||
| Middle East and Africa | United Arab Emirates | |
| Saudi Arabia | ||
| South Africa | ||
| Rest of Middle East and Africa | ||


Key Questions Answered in the Report
What is the current size of the shared mobility market?
The shared mobility market stands at USD 406.52 billion in 2026 and is set to reach USD 901.66 billion by 2031.
Which segment holds the biggest shared mobility market share?
Ride-hailing accounts for 54.12% of 2025 revenue, making it the largest segment.
Which region is growing the fastest in shared mobility?
North America leads growth with a forecast 13.49% CAGR through 2031, boosted by autonomous-vehicle rollouts and corporate mobility programs.
What role do corporate net-zero targets play in market growth?
Enterprises are replacing company cars with mobility subscriptions, generating stable, high-volume demand that supports double-digit market expansion.
Which region has the biggest share in Shared Mobility Market?
In 2025, the Asia Pacific accounts for the largest market share in Shared Mobility Market.
Which region is growing the fastest in shared mobility?
North America leads growth with a forecast 13.49% CAGR through 2031, boosted by autonomous-vehicle rollouts and corporate mobility programs.
Page last updated on:


