
In-taxi Digital Signage Market Size and Share
Market Overview
| Study Period | 2020 - 2032 |
|---|---|
| Market Size (2027) | USD 0.68 Billion |
| Market Size (2032) | USD 0.79 Billion |
| Growth Rate (2027 - 2032) | 3.01 % |
| Fastest Growing Market | Middle East and Africa |
| Largest Market | North America |
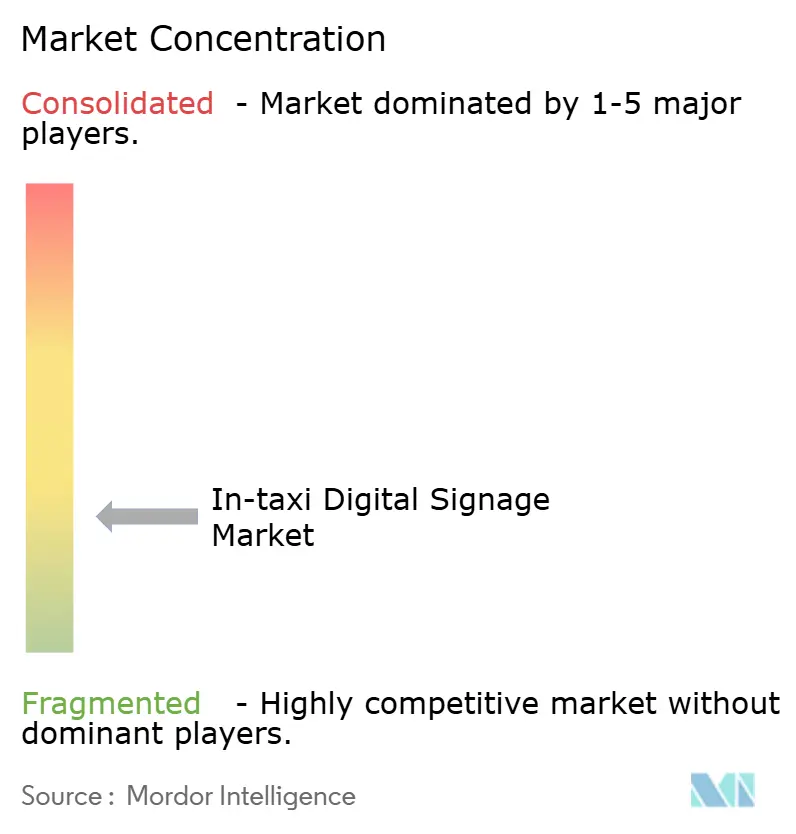
| Market Concentration | Low |
Major Players *Disclaimer: Major Players sorted in no particular order Image © Mordor Intelligence. Reuse requires attribution under CC BY 4.0. | |
In-taxi Digital Signage Market Analysis by Mordor Intelligence
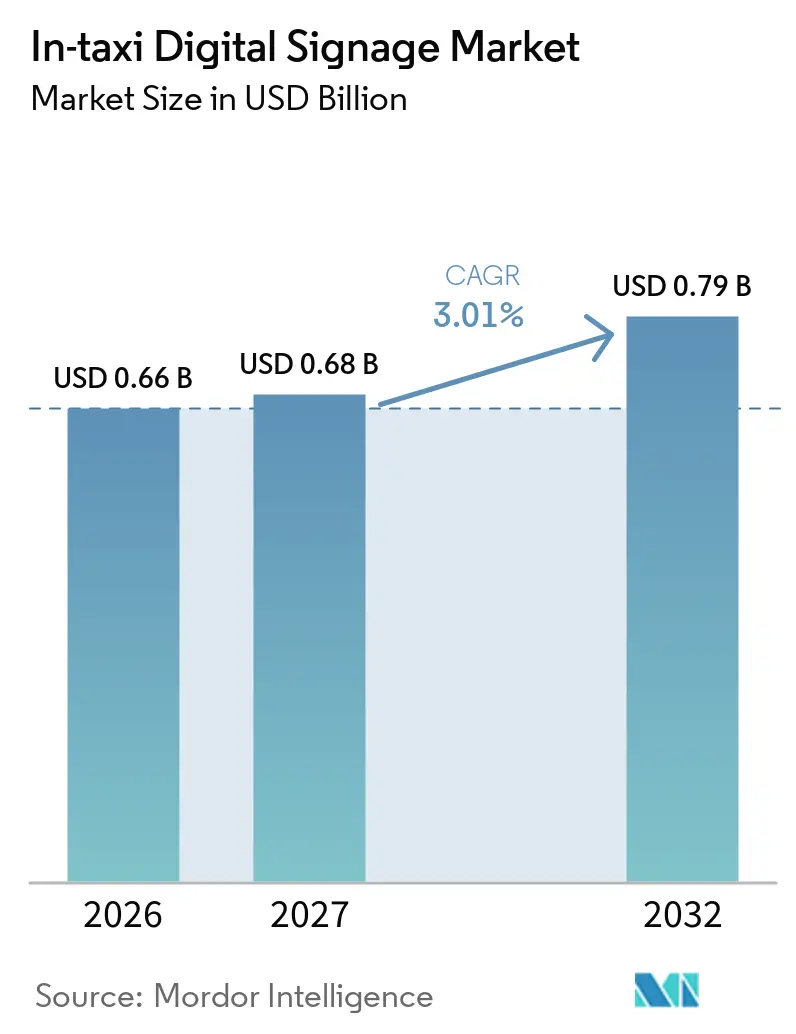
The In-taxi Digital Signage Market size was valued at USD 0.66 billion in 2026 and is projected to grow from USD 0.68 billion in 2027 to USD 0.79 billion by 2032, growing at a CAGR of 3.01% from 2027 to 2032. The In-taxi Digital Signage Market is moving beyond initial hardware rollout toward stronger screen utilization and recurring advertising revenue. Programmatic buying is making it easier to include taxi inventory in broader digital out-of-home plans. Advertisers are also using location, route, and time-of-day signals to make messages more relevant. Larger networks can spread content, compliance, and maintenance costs across more vehicles. Privacy rules and city-level approvals continue to shape where these networks can expand.
Key Report Takeaways
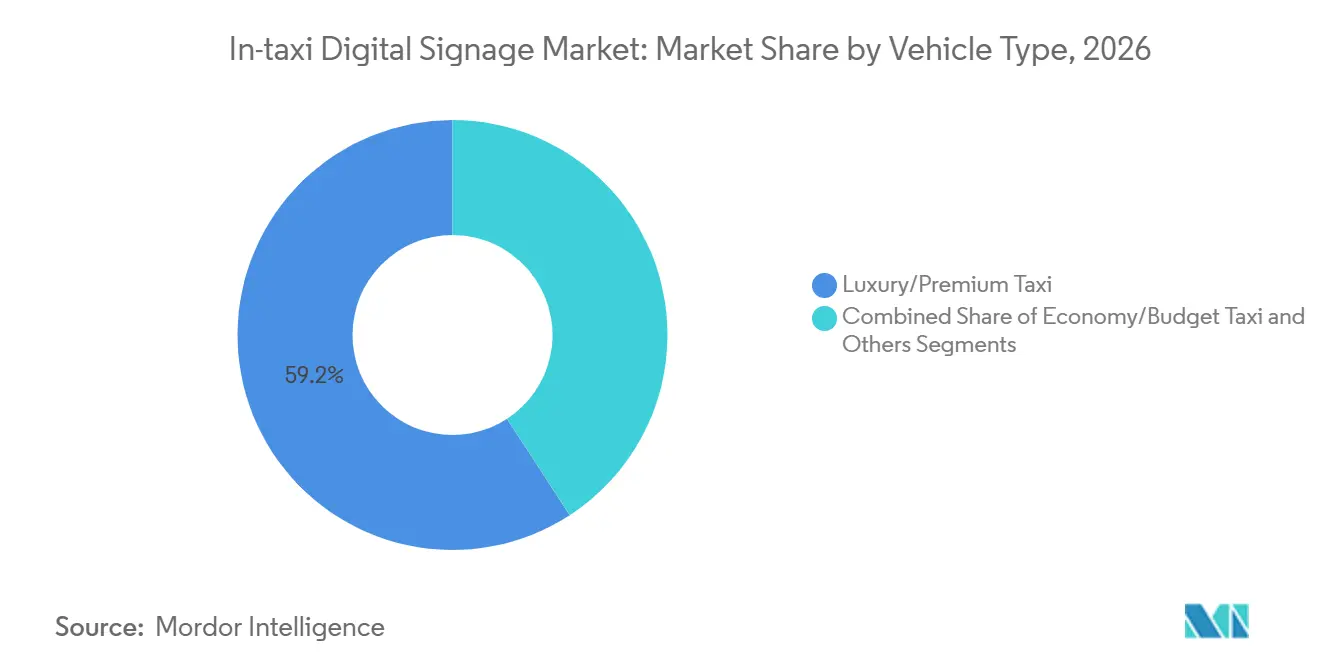
- By vehicle type, luxury and premium taxis held a 59.18% share of the in-taxi digital signage market in 2026, while economy and budget taxis are forecast to grow at a 3.18% CAGR through 2032.
- By display type, LCD held a 46.27% share of the in-taxi digital signage market in 2026, while LED is forecast to grow at a 6.17% CAGR through 2032.
- By placement, in-cabin rear-seat and headrest screens held a 41.27% share of the in-taxi digital signage market in 2026 and are forecast to grow at a 3.52% CAGR through 2032.
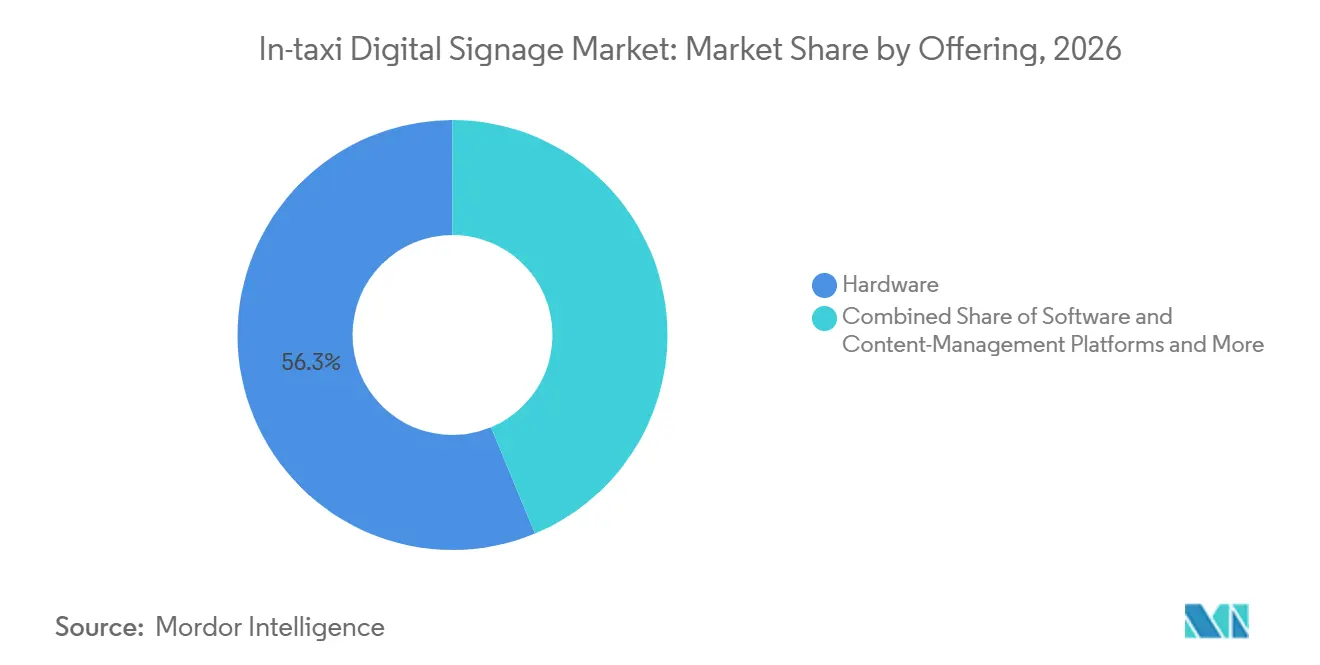
- By offering, hardware held a 56.27% share of the in-taxi digital signage market in 2026, while software and content-management platforms are forecast to grow at a 4.17% CAGR through 2032.
- By screen size, 10-15 inch screens held a 41.27% share of the in-taxi digital signage market in 2026, while above-15-inch screens are forecast to grow at a 3.47% CAGR through 2032.
- By fleet type, traditional street-hail taxis held a 48.17% share of the in-taxi digital signage market in 2026, while ride-hailing and app-based fleets are forecast to grow at a 4.57% CAGR through 2032.
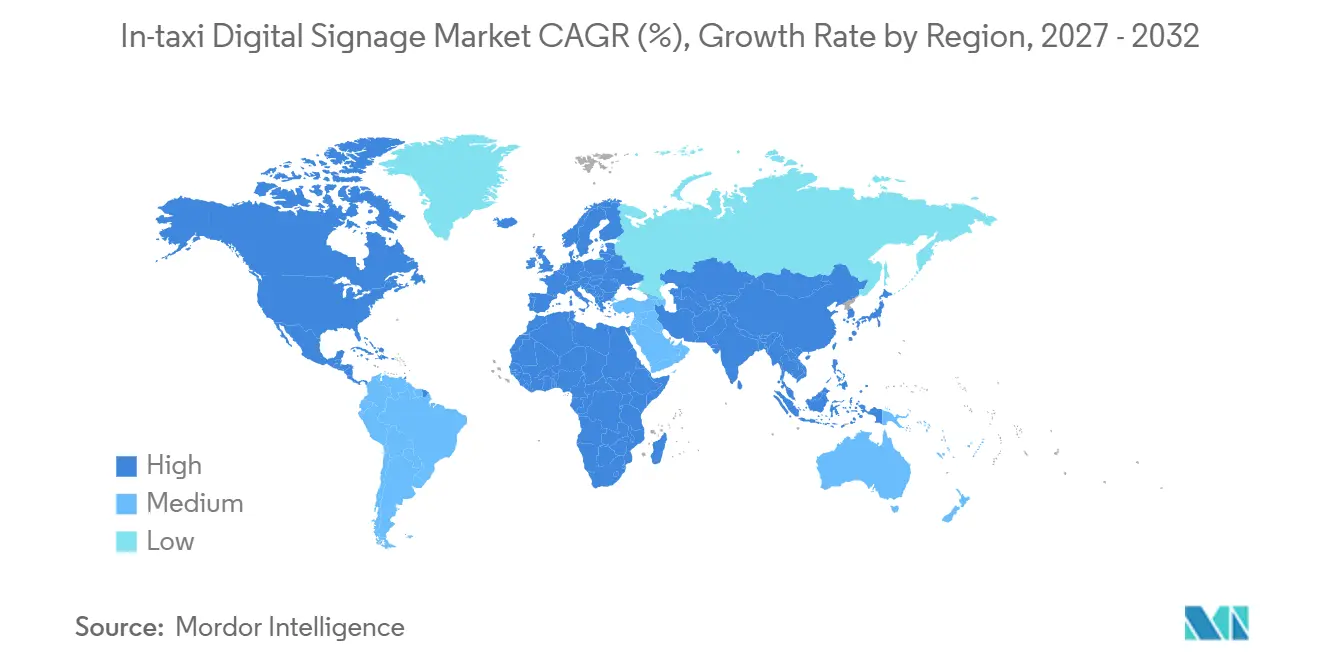
- By geography, North America held a 36.27% share of the in-taxi digital signage market in 2026, while the Middle East and Africa are forecast to grow at a 4.27% CAGR through 2032.
Note: Market numbers in this report are based on Mordor Intelligence's proprietary estimation framework, which combines nine months of actuals with Q4 projections for base year 2026.
Global In-taxi Digital Signage Market Trends and Insights
Drivers Impact Analysis*
| Driver | (~) % Impact on CAGR Forecast | Geographic Relevance | Impact Timeline |
|---|---|---|---|
| Expansion of Programmatic Digital Out-of-Home Advertising | +1.1% | Global, strongest in North America and EMEA | Medium term (2-4 years) |
| Growth of Rideshare and App-Based Fleet Inventory | +0.7% | Global, led by Asia-Pacific and North America | Medium term (2-4 years) |
| Demand for Measurable Location-Based Campaigns | +0.5% | Global, with early gains in North America and Europe | Short term (≤ 2 years) |
| Increasing Passenger Dwell Time and Interactive Content Demand | +0.4% | North America, Asia-Pacific core, spillover to Middle East and Africa | Medium term (2-4 years) |
| Taxi Fleet Digitization in Emerging Urban Centers | +0.3% | Middle East and Africa, South America, Asia-Pacific secondary cities | Long term (≥ 4 years) |
| Driver and Fleet Operator Demand for Incremental Revenue | +0.2% | Global | Short term (≤ 2 years) |
| Source: Mordor Intelligence | |||
Expansion of Programmatic DOOH Bringing Automated Campaign Intelligence to Taxi Networks
Programmatic access is reducing the effort needed to buy inventory across taxi and rideshare networks. Programmatic buying accounted for 30% of U.S. digital out-of-home sales in 2025, up from 3% in 2019[1]. This gives the In-taxi Digital Signage Market a more direct route to budgets already allocated to digital out-of-home media. Networks can be evaluated alongside roadside, transit, and retail screens in the same buying process. The result is greater value from installed screens when demand, pricing, and campaign delivery are coordinated through the software layer.
Growth of Rideshare and App-Based Fleet Inventory Enabling First-Party Data-Driven Targeting
App-based operators can integrate trip information with screen delivery in ways that traditional fleets struggle to match. Uber Advertising stated that JourneyTV achieved a 98% ad completion rate and an average passenger view time of 120 seconds per ride in 2025. New York City's licensing framework permitted interior advertising in for-hire vehicles in 2025 [2]. This framework gave operators a clearer route to deploy in-car advertising in a major urban market. Following its July 2025 launch, inDrive reported that its advertising operation generated 2 billion impressions across 25 countries. Integrated operators can combine fleet expansion, advertising delivery, and driver revenue sharing within a single operating model.
Demand for Measurable Location-Based Campaigns Anchoring Taxi Media as a Performance Channel
GPS-enabled screens allow campaigns to modify creative based on neighborhood, route, time of day, or nearby destinations. Firefly reported that combining moving out-of-home media with stationary placements delivered higher brand lift. It also found that target audiences were more likely to take action than when exposed to stationary placements alone. Firefly used real-time traffic data in a United Airlines campaign in New York City to adjust airport-related messaging. These capabilities make taxi media relevant for advertisers seeking measurable visits, actions, and contextual reach. They also support pricing structures that extend beyond broad audience delivery.
Increasing Passenger Dwell Time and Interactive Content Demand Elevating Engagement Economics
Taxi rides provide a contained environment in which passengers can view advertising and editorial content. Mobility platforms can partner with social media programs to display full-screen, sound-on creator videos across taxis in multiple markets. Campaigns in urban markets can deliver verified impressions to unique passengers and generate repeated exposure per rider. Touchscreens, QR codes, and personalized recommendations can convert viewership into trackable actions. Content partnerships can also help operators maintain passenger engagement between advertising slots.
Restraints Impact Analysis*
| Restraint | (~) % Impact on CAGR Forecast | Geographic Relevance | Impact Timeline |
|---|---|---|---|
| Fragmented City-Level Advertising Approval Requirements | -0.4% | North America and EU, national with city-level variation in Asia-Pacific | Short term (≤ 2 years) |
| Passenger Privacy and Audience-Measurement Restrictions | -0.4% | Global, strongest in EU under GDPR and California under CCPA | Medium term (2-4 years) |
| Vehicle Power, Connectivity, and Maintenance Constraints | -0.3% | Middle East and Africa secondary cities, South America | Long term (≥ 4 years) |
| Limited Advertiser Standardization Across Taxi Media Networks | -0.2% | Global | Medium term (2-4 years) |
| Source: Mordor Intelligence | |||
Fragmented City-Level Advertising Approval Requirements Impeding Scalable Campaign Execution
Cities enforce varying rules for content approvals, installation requirements, and driver revenue arrangements. Transport for London maintains separate regulations for electronic displays on licensed black cabs. Gulf cities also impose local requirements related to display timing, creative formats, and age-appropriate content. This regulatory fragmentation prevents advertisers from using a single creative package unchanged across multiple cities and increases production and approval costs for campaigns requiring rapid modifications.
Passenger Privacy and Audience-Measurement Restrictions Constraining Data Monetization Depth
In-vehicle screens can collect signals related to passenger attention and proximity, making data governance essential. Privacy concerns surrounding mobility-as-a-service data influence user trust and highlight the need to incorporate privacy-by-design principles into mobility platforms. Consent requirements and privacy rights limit the use of detailed passenger data. Therefore, networks use aggregated metrics and consent-aware research methods when individual identification is not permitted. The market benefits when operators provide advertisers with auditable reach metrics while maintaining robust passenger protections.
*Our forecasts treat driver/restraint impacts as directional, not additive. The impact forecasts reflect baseline growth, mix effects, and variable interactions.
Segment Analysis
By Vehicle Type: Premium Fleets Anchor Revenue While Economy Scale Gains Momentum
Luxury and premium taxis captured 59.18% of the In-taxi Digital Signage Market share in 2026. These vehicles often serve business travel, airport routes, and premium hospitality trips. Advertisers value the longer journeys and predictable travel patterns associated with these settings. Financial services, luxury retail, and travel brands can use this environment to reach relevant passengers. The segment also benefits from vehicle interiors that support high-quality screens and content presentation. Airport runs and business corridors provide advertisers with repeatable settings for planning premium travel, retail, and financial services messaging. At the same time, predictable routes can make it easier to align campaign timing with arrival, departure, hotel, and office-related travel needs.
Economy and budget taxis are projected to grow at a 3.18% CAGR through 2032. Lower content management and connectivity costs make advertising deployment more feasible across higher-volume fleets. The In-taxi Digital Signage Market can extend screen coverage when lower-yield trips are aggregated at the fleet scale. GrabCab received a Singapore street-hail license in April 2025 and launched its fully green fleet in July 2025. Other vehicles include airport limousines, corporate shuttles, and specialist medical transport. Their planned routes can support narrowly targeted advertising for healthcare, insurance, and luxury lifestyle services. This is relevant where a smaller vehicle pool still offers an identifiable journey purpose and a clear passenger profile, particularly when a campaign values route predictability and a defined passenger context more than the broadest possible number of vehicles.

By Display Type: LCD Dominates Currently, While LED Gains Momentum in Exterior Economics
LCD held 46.27% of the In-taxi Digital Signage Market revenue in 2026. It is used in rear-seat, partition, and other enclosed-cabin applications. Controlled cabin lighting reduces the need for very high display brightness. LCD also suits standard content layouts and broad installation programs. OLED remains a smaller option for premium interior settings where contrast and image quality are priorities. Its higher unit cost limits broader use to fleets that can support the extra equipment expense through stronger advertising yield.
LED is forecast to expand at a 6.17% CAGR through 2032. Rooftop applications require strong daylight visibility, making brightness above 5,000 nits important. Firefly introduced 3D creative capability for digital taxi tops in May 2025. The development showed how rooftop LED displays can offer more distinctive creative treatments. E-paper and hybrid low-power displays remain relevant where electrical load and power reliability constraints limit their use. These formats can help fleets manage installation choices in markets with less reliable charging and maintenance conditions. They remain useful where operators need to reduce electrical draw on electric vehicles or avoid frequent battery-related servicing, because those operating conditions can determine whether a fleet can maintain display uptime without undermining the economics of advertising deployment.
By Placement: In-Cabin Rear-Seat Screens Define Both Volume and Growth
In-cabin rear-seat and headrest screens accounted for 41.27% of the In-taxi Digital Signage Market revenue in 2026. They are also forecast to grow at a 3.52% CAGR through 2032. The placement gives passengers a direct and less interrupted view of content during a trip. Passenger-facing advertising platforms can achieve strong completion rates for in-vehicle advertising. This performance supports continued investment in passenger-facing screens and content delivery. These placements also provide a practical foundation for interactive formats, including QR code responses and ride-responsive content. Such formats enable operators to use extended passenger viewing periods to generate measurable engagement, rather than relying solely on impressions delivered outside the vehicle.
Rooftop displays reach pedestrians, cyclists, and other road users, extending exposure beyond vehicle passengers. Their value lies in generating moving impressions across city streets and travel corridors. They can complement interior screens in campaigns that require both passenger engagement and broad urban reach. Transportation operators can expand their exterior digital capabilities by deploying large-format digital landscape screens on public transit vehicles. Partition, ceiling, and window placements serve more specialized requirements. However, driver-distraction regulations restrict window and side displays in certain locations. These restrictions limit the deployment potential of these formats, even when they provide a visible exterior advertising surface.
By Offering: Hardware Drives Initial Revenue, Software Platforms Compound Value Over Time
Hardware held 56.27% of the In-taxi Digital Signage Market revenue in 2026. Screens, media players, mounts, and vehicle integration equipment make up much of the initial deployment cost. This structure reflects the capital needs of introducing equipment across a fleet. Hardware remains necessary for every new network and screen refresh. It also creates demand for installation support and ongoing maintenance. The need for screen replacement, mounting adjustments, and vehicle integration work gives service providers a recurring role between major fleet refresh cycles, which can stabilize operator relationships as equipment ages and maintenance requirements become more frequent after several years of use.
Software and content-management platforms are projected to grow at a 4.17% CAGR through 2032. Their value lies in campaign scheduling, programmatic access, location-based creative changes, reporting, and driver settlement. Operators that combine software with hardware can make their systems harder for customers to replace. This can place more competitive value in the technology layer than in hardware supply alone. It also gives operators a way to coordinate GPS-triggered creative, audience reporting, and driver revenue settlement in the same operating environment.
By Screen Size: Mid-Range Screens Lead While Larger Formats Signal Premium Shift
The 10-15-inch band accounted for 41.27% of the In-taxi Digital Signage Market revenue in 2026. This range is suitable for common headrest and partition installations. It balances readability with available cabin space and vehicle ergonomics. The format also works with widely used advertising and entertainment layouts. Below-10-inch screens remain useful in older fleet upgrades where power and mounting space are limited. Their role is likely to remain tied to partition and ceiling installations rather than the premium rear-seat formats being added to newer vehicles.
Above-15-inch screens are forecast to grow at a 3.47% CAGR through 2032. They are being adopted in premium rear-seat entertainment and tablet-style systems. Larger panels can support a wider range of landscape video, trailers, and longer content formats. In 2025, Uber's JourneyTV offered formats ranging from 15-second spots to 90-second spots and full-length trailers. These formats support stronger viewing outcomes on higher-resolution screens. Screen-size standardization remains incomplete across multiple network operators and cities. This can require advertisers to adapt creative files for different screens when a campaign runs across multiple taxi-media networks, adding work that is particularly relevant to multi-city advertisers who need consistent messaging while accommodating varying display dimensions and mounting positions.
By Fleet Type: Street-Hail Networks Retain Scale, App Fleets Redefine Yield Mechanics
Traditional street-hail taxis held 48.17% of the In-taxi Digital Signage Market revenue in 2026. Their installed base, city licensing relationships, and existing equipment support their continued scale. Mature taxi systems in New York, London, and Tokyo provide established operating environments. Taxi advertising networks operate across major cities in Japan. These networks can maintain relevance by integrating their inventory with modern campaign systems. Established medallion and licensing arrangements provide an operating base in cities where authorities restrict new fleet entry. Their ability to retain advertising relevance depends on combining this access with modern capabilities in measurement, content, and campaign management.
Ride-hailing and app-based fleets are projected to grow at a 4.57% CAGR through 2032. Their platforms bring together passenger trip data, fleet participation, advertising delivery, and payments. This coordination can improve audience segmentation and campaign yield. Mixed fleets, including airport shuttles and corporate transport, serve smaller but predictable audiences. Their passenger profiles can support higher pricing for healthcare, financial services, and business-travel campaigns. Competition will depend on whether traditional associations improve programmatic access before app platforms add more licensed taxi inventory. The outcome will influence whether established fleets retain advertising yield or app-native fleets capture a larger share of new demand, since the latter can combine screen deployment with the trip, payment, and audience information already produced through their consumer-facing applications.
Geography Analysis
North America held 36.27% of the In-taxi Digital Signage Market share in 2026. The region has mature digital out-of-home infrastructure and several large mobility-media networks. This combination gives buyers familiar campaign processes and a sizable base of urban screen inventory, allowing the regional network base to serve as a reference point for monetization methods and programmatic buying practices adopted elsewhere in the sector. Out-of-home advertising revenue continued to grow, while digital out-of-home revenue increased from the prior period. Digital formats accounted for a substantial share of total out-of-home advertising revenue. An interior advertising framework expanded the regulatory pathway for for-hire vehicle networks.
Europe places greater weight on privacy, consent, and local advertising compliance. GDPR restricts detailed audience profiling and encourages contextual targeting and aggregated measurement. Transport for London's rules add a separate operating layer for black cab displays. Asia-Pacific is strengthening its taxi media ecosystem through structured taxi media systems and digitally integrated fleets. A leading transit operator secured a contract to manage advertising across a public bus network. The contract reinforces the company’s broader transit media presence across taxi, bus, and other urban advertising formats. Campaigns have also demonstrated the use of verified, impression-level measurement on passenger-facing screens in electric taxis. The region is strengthening its transit media ecosystem through structured taxi media systems and digitally integrated fleets. Transit operators manage advertising across public bus networks, supporting broader transit media operations across taxis, buses, and other urban formats. Campaigns also demonstrate the use of verified, impression-level measurement on passenger-facing screens in electric taxis.
The Middle East and Africa are forecast to lead regional growth at a 4.27% CAGR through 2032. Gulf markets are linking passenger-facing digital screens with smart mobility, tourism, and premium transport programs. Dubai's taxi fleet is a relevant setting for passenger display adoption as the city expands digital mobility services. In sub-Saharan cities, rooftop displays are being added to ride-hailing fleets as mobile connectivity improves. South America has activity in Brazil, Colombia, and Argentina, while fragmented ownership and uneven coverage limit scale beyond large urban corridors. The In-taxi Digital Signage Market, therefore, has different deployment conditions by region, even when advertisers use similar campaign tools. Market access depends on local fleet structure, connectivity, power reliability, urban travel patterns, and advertising rules, which means that a common advertising platform does not remove the need to tailor deployment, creative execution, and compliance processes for each operating geography.
Competitive Landscape
The in-taxi digital signage market is moderately fragmented. Dedicated mobility media networks include Firefly Systems, Curb Mobility, and Vugo. Platform-integrated operators include Uber Advertising and T-Mobile Advertising Solutions through Octopus Interactive. Regional specialists include ComfortDelGro's Moove Media, IRIS Co.'s TOKYO PRIME, and IDOOH International. This structure includes companies that directly operate screens, as well as those that integrate fleet data, content, and advertising systems. It also includes regional operators whose fleet relationships and local regulatory knowledge can be difficult for new entrants to replicate, particularly in markets where taxi permits, content reviews, and city-specific display approvals remain critical to deployment decisions.
Companies use content partnerships to improve passenger engagement. Curb Mobility partnered with TikTok to bring creator videos to taxi screens. Uber launched JourneyTV Presents with content partners, including Cars.com, Time Out, and Minute Media. Firefly introduced creative capabilities for its digital taxi tops. These initiatives aim to make taxi screens more valuable to advertisers seeking recognizable content environments and differentiated formats. They also support a broader shift from simple screen placement toward a passenger media experience that combines advertising, information, and entertainment. This approach can help operators address brand-safety concerns and sustain passenger attention during journeys.
Software capabilities are becoming increasingly important for campaign planning, reporting, and screen utilization. Smaller local operators compete on price but face pressure when larger networks provide broader programmatic access and more robust reporting capabilities. Privacy-preserving measurement tools and compatible campaign standards remain areas for further development. Regulatory requirements in Europe and local licensing rules in the United States may favor networks with greater resources. Smaller providers also face power, maintenance, connectivity, and creative-standardization requirements, which can complicate multi-city expansion.
In-taxi Digital Signage Industry Leaders
-
Curb Mobility LLC
-
Firefly Systems, Inc.
-
Adomni, Inc.
-
Vugo, Inc.
-
T-Mobile USA, Inc.
- *Disclaimer: Major Players sorted in no particular order
Recent Industry Developments
- March 2026: Somo launched a 1,200-screen digital taxi network in Las Vegas. The network combines traditional digital taxi-top units with rear-window displays, which the company calls Digital Taxi Back Displays. These transparent screens convert the rear of each vehicle into an additional advertising surface while maintaining visibility for taxi occupants.
- October 2025: Curb Mobility added Newsmax as a content partner to its Taxi TV platform, bringing national news programming to 15,000 screens across 65 US markets. This partnership supported the company’s strategy to diversify in-ride content and maintain audience engagement between advertising slots.
Global In-taxi Digital Signage Market Report Scope
The In-Taxi Digital Signage Market Report is Segmented by Vehicle Type (Luxury/Premium Taxi, Economy/Budget Taxi, Others), Display Type (LCD, LED, OLED, Others), Placement (Rooftop Toppers, In-Cabin Rear-Seat and Headrest Screens, Partition and Ceiling Screens, Window and Side Displays, Others), Offering (Hardware, Software and Content-Management Platforms, Services), Screen Size (Below 10 Inches, 10-15 Inches, Above 15 Inches), Fleet Type (Traditional Street-Hail Taxis, Ride-Hailing and App-Based Fleets, Mixed and Contracted Commercial Fleets, Others), and Geography (North America, Europe, Asia-Pacific, South America, Middle East and Africa). The Market Forecasts are Provided in Terms of Value (USD).
| Luxury/Premium Taxi |
| Economy/Budget Taxi |
| Others |
| LCD |
| LED |
| OLED |
| Others |
| Rooftop Toppers |
| In-Cabin Rear-Seat and Headrest Screens |
| Partition and Ceiling Screens |
| Window and Side Displays |
| Others |
| Hardware |
| Software and Content-Management Platforms |
| Services |
| Below 10 Inches |
| 10-15 Inches |
| Above 15 Inches |
| Traditional Street-Hail Taxis |
| Ride-Hailing and App-Based Fleets |
| Mixed and Contracted Commercial Fleets |
| Others |
| North America | United States |
| Canada | |
| Rest of North America | |
| South America | Brazil |
| Argentina | |
| Rest of South America | |
| Europe | Germany |
| United Kingdom | |
| France | |
| Italy | |
| Spain | |
| Rest of Europe | |
| Asia-Pacific | China |
| India | |
| Japan | |
| South Korea | |
| Rest of Asia-Pacific | |
| Middle East and Africa | Saudi Arabia |
| United Arab Emirates | |
| South Africa | |
| Rest of Middle East and Africa |
| By Vehicle Type | Luxury/Premium Taxi | |
| Economy/Budget Taxi | ||
| Others | ||
| By Display Type | LCD | |
| LED | ||
| OLED | ||
| Others | ||
| By Placement | Rooftop Toppers | |
| In-Cabin Rear-Seat and Headrest Screens | ||
| Partition and Ceiling Screens | ||
| Window and Side Displays | ||
| Others | ||
| By Offering | Hardware | |
| Software and Content-Management Platforms | ||
| Services | ||
| By Screen Size | Below 10 Inches | |
| 10-15 Inches | ||
| Above 15 Inches | ||
| By Fleet Type | Traditional Street-Hail Taxis | |
| Ride-Hailing and App-Based Fleets | ||
| Mixed and Contracted Commercial Fleets | ||
| Others | ||
| By Geography | North America | United States |
| Canada | ||
| Rest of North America | ||
| South America | Brazil | |
| Argentina | ||
| Rest of South America | ||
| Europe | Germany | |
| United Kingdom | ||
| France | ||
| Italy | ||
| Spain | ||
| Rest of Europe | ||
| Asia-Pacific | China | |
| India | ||
| Japan | ||
| South Korea | ||
| Rest of Asia-Pacific | ||
| Middle East and Africa | Saudi Arabia | |
| United Arab Emirates | ||
| South Africa | ||
| Rest of Middle East and Africa | ||
Key Questions Answered in the Report
What is the projected value of the in-taxi digital signage market by 2032?
The In-Taxi Digital Signage Market is projected to grow from USD 0.68 billion in 2027 to USD 0.79 billion by 2032, at a CAGR of 3.01% during the forecast period.
Which display technology is experiencing the fastest growth in the taxi screen market?
The LED segment is projected to grow at a CAGR of 6.17% through 2032, supported by rooftop applications requiring strong daylight visibility.
Why Are App-Based Taxi Fleets Important for Advertisers?
App-based fleets can integrate trip information, delivery screening, advertising reporting, and driver payments into a single operating model.
Which placement plays the largest role in passenger engagement?
In-cabin rear-seat and headrest screens accounted for 41.27% of revenue in 2026 and are projected to grow at a 3.52% CAGR through 2032.
What factors limit the broader deployment of taxi advertising screens?
City-specific approvals, privacy requirements, vehicle power limits, connectivity gaps, and inconsistent network standards may restrict deployment.